- Swingly
- Posts
- You Need To Be Very Careful Today
You Need To Be Very Careful Today


MARKET ANALYSIS
Here’s All You Need To Know

Markets are opening with a broad, market-wide gap down following renewed tariff rhetoric and geopolitical escalation, and this time the weakness is not isolated to mega-cap technology.
Unlike recent risk events where small and mid-caps acted as shock absorbers, early price action shows pressure across all cap segments, including the prior leadership areas.
This matters because the market has been held together by rotation rather than true breadth expansion, making it more vulnerable when correlations rise.
Volatility is expanding meaningfully, and in environments like this, downside can accelerate quickly if sellers remain in control into the close.
Given how extended and choppy equities have been, this type of gap down has the potential to transition from noise into a short-term liquidation phase if dip buyers fail to show up.
That said, the close is far more important than the open; many headline-driven sell-offs this cycle have reversed intraday once emotion is absorbed.
If price stabilizes and recovers meaningfully into the close, this likely resolves as another rotational reset rather than a trend break.
If weakness persists into the afternoon with expanding volume, risk should be reduced aggressively, as the market has shown very little tolerance for prolonged holding periods.
Nasdaq
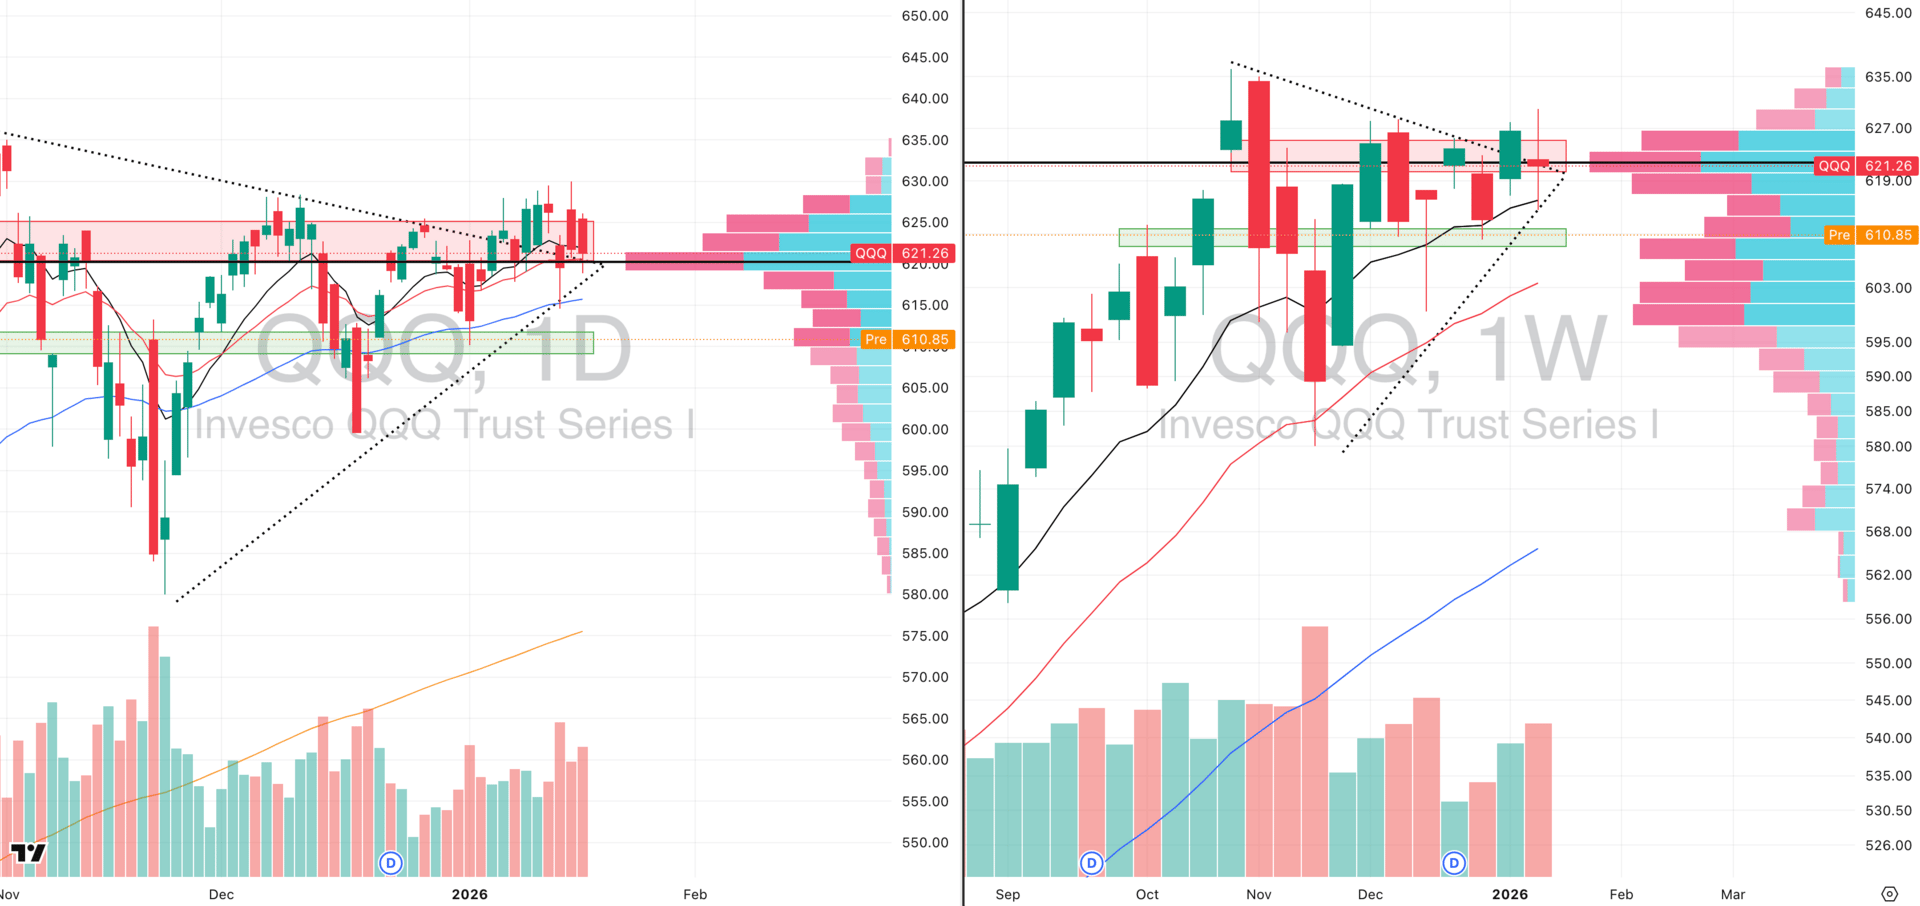
QQQ VRVP Daily & Weekly Chart
53.92%: over 20 EMA | 51.96%: over 50 EMA | 57.84%: over 200 EMA
The NASDAQ is in a structurally vulnerable position after a high-volume rejection at the 630 breakout attempt.
Last week printed 112% relative volume on the weekly chart, followed by another 111% relative volume sell-off on Friday, confirming supply rather than demand.
Volume profile shows clear distribution above 627.75, with materially more shares traded to the downside than the upside in that range.
Price is now below the point of control on both the daily and weekly timeframe, signaling a loss of intermediary trend control.
Current price is sitting near the December 19 lows, with the next logical downside magnet being the rising 20-week EMA near 603.
A failure to hold the 20-week EMA would be a material technical break and would invalidate the entire rally structure that has held since early May.
Mega-cap technology is broadly failing, which means the NASDAQ is likely to remain the weakest index in any continued downside pressure.
The close is critical; without a strong intraday recovery, downside risk remains elevated and could accelerate quickly.
S&P 400 Midcap
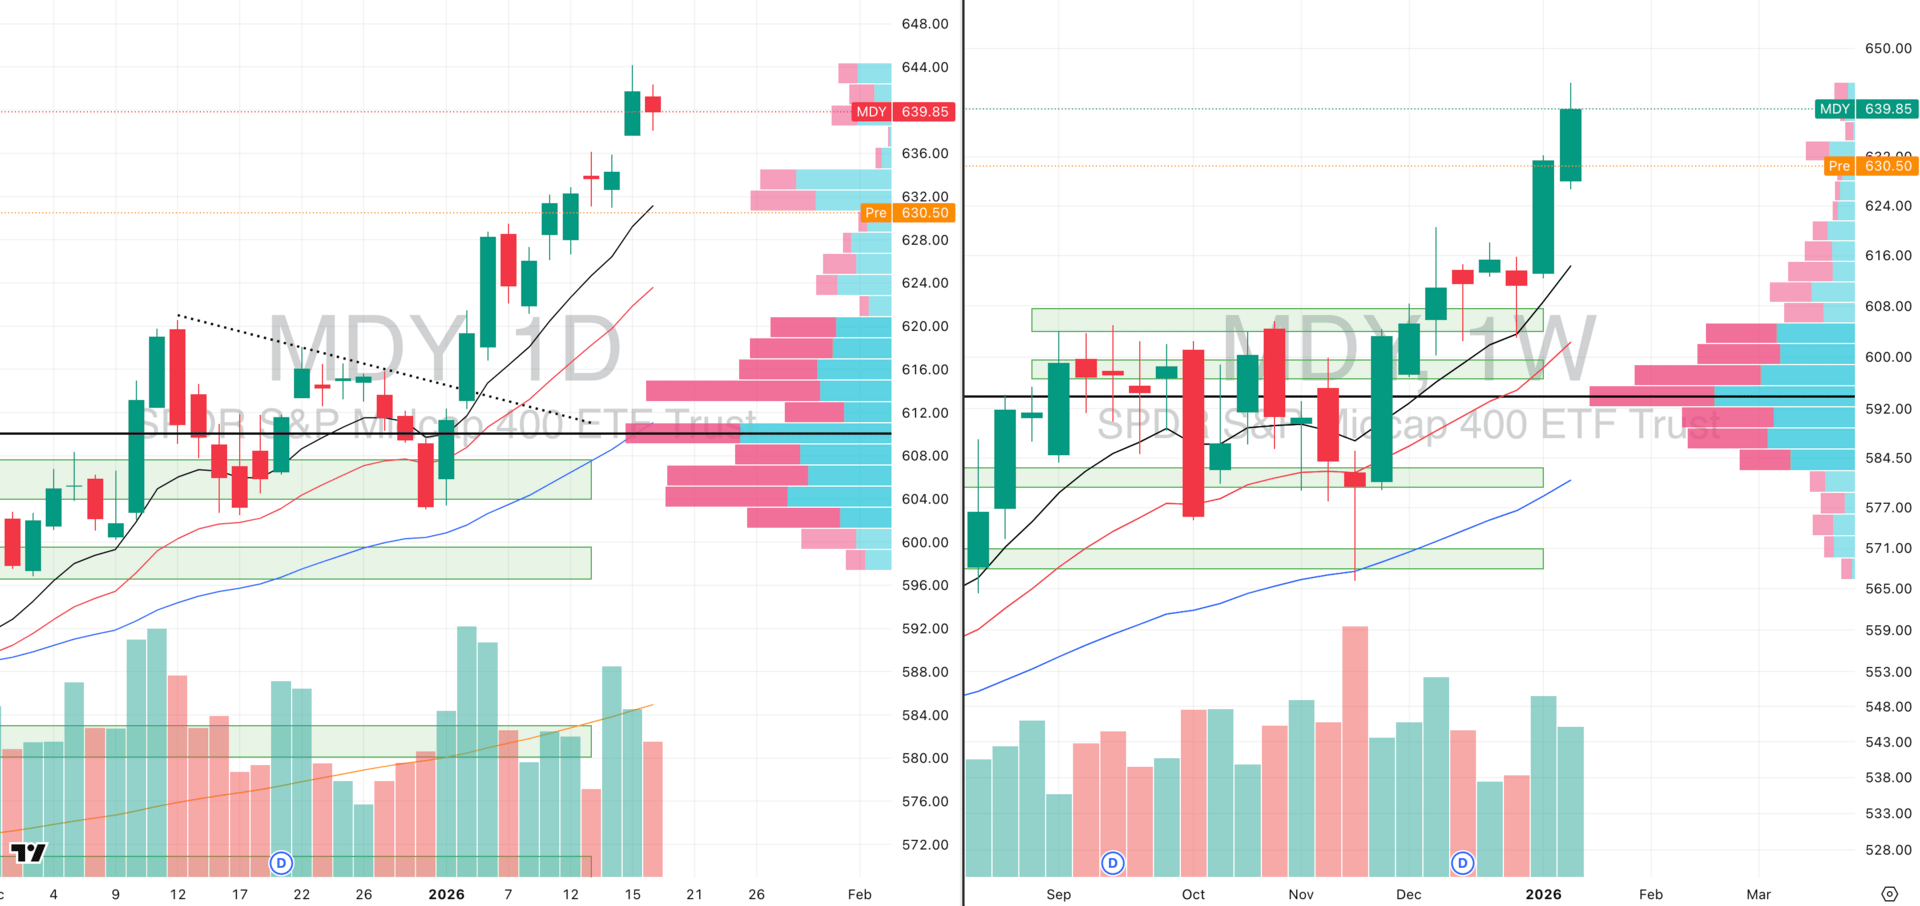
MDY VRVP Daily & Weekly Chart
71.42%: over 20 EMA | 75.43%: over 50 EMA | 69.17%: over 200 EMA
Mid-caps remain structurally stronger than the NASDAQ, supported by meaningfully better internal breadth.
That said, they are also gapping down today and mean-reverting toward the 10-day EMA, which was a logical and overdue move given short-term extension.
A clean reclaim of the 10-day EMA would be a constructive signal and suggest relative strength is still intact.
Failure to reclaim that level opens the door to a move toward the 20-day EMA near 621, which would represent further downside without breaking the broader trend.
Given rising volatility and elevated correlations, mid-caps should not be treated as immune, only relatively stronger.
Any trades taken must be very low duration, quick, and size-adjusted, with strict invalidation levels and overnight holds are still very risky.
Russell 2000
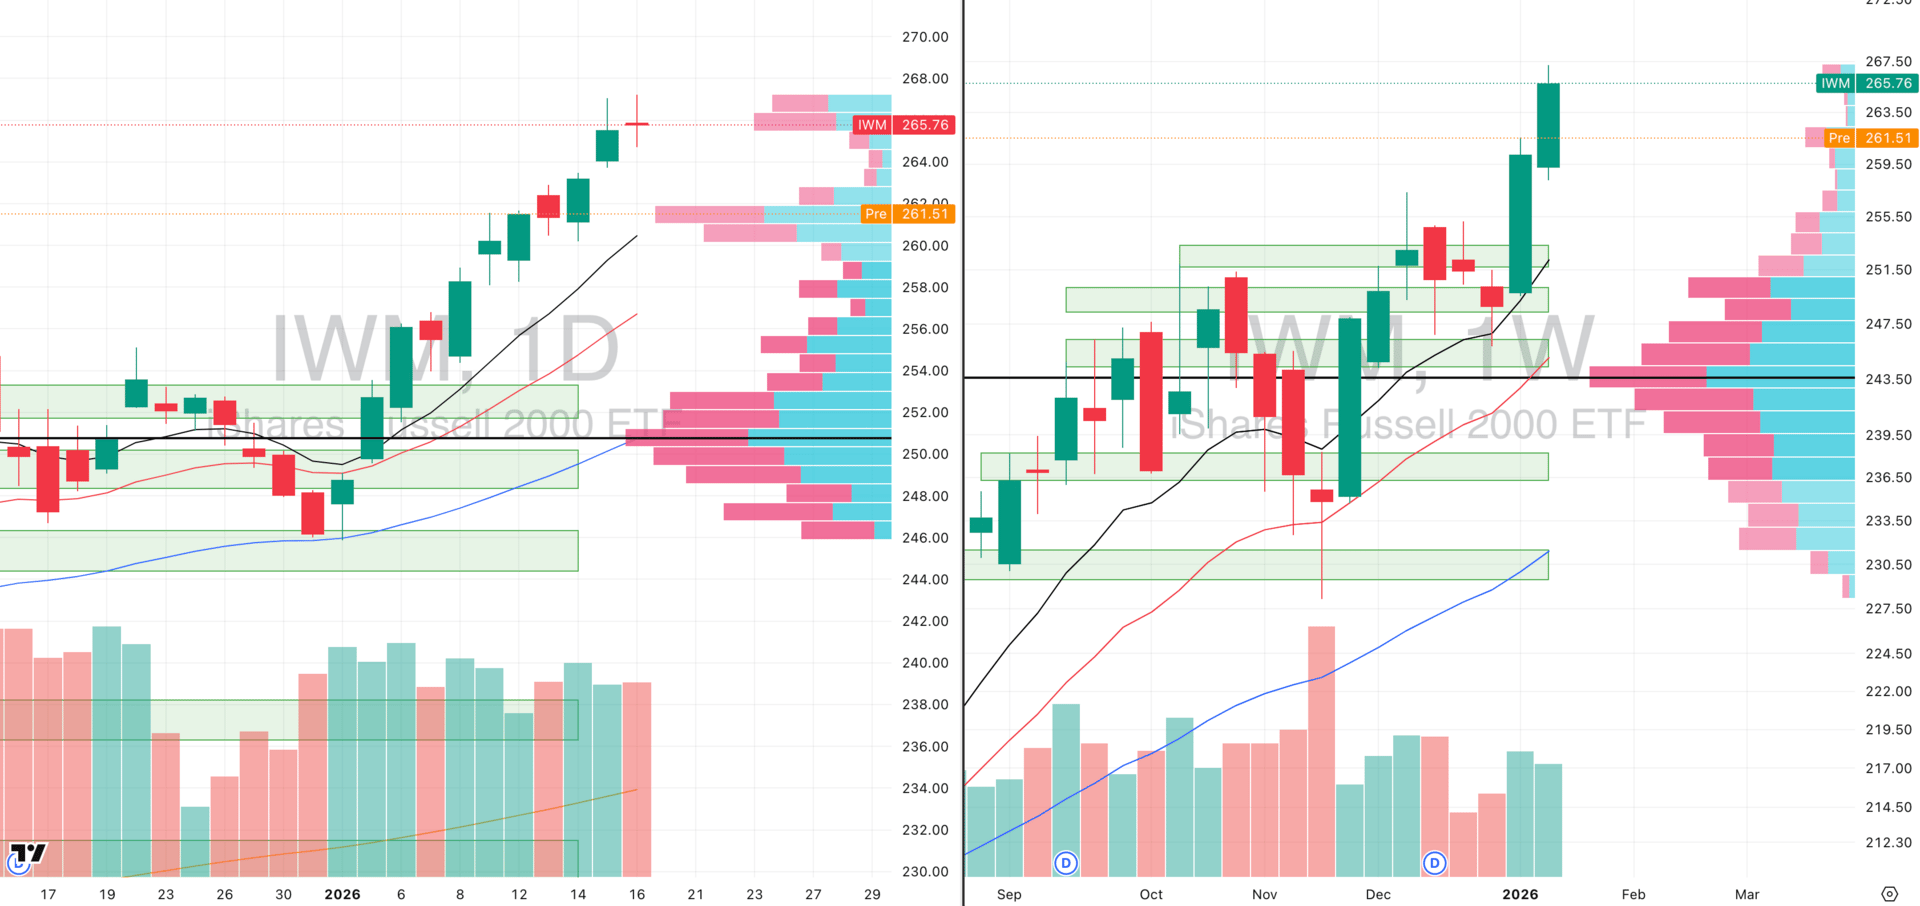
IWM VRVP Daily & Weekly Chart
67.37%: over 20 EMA | 69.94%: over 50 EMA | 67.88%: over 200 EMA
Small caps are exhibiting the same technical structure as mid-caps, with today’s gap down landing directly into fair value near 260, which aligns with the rising 10-day EMA.
The volume profile shows a meaningful demand shelf at this level, with more shares transacted on the bid than the ask, suggesting this area can act as short-term support.
Given the strong intermediary trend and the breakout from 249 on January 5th, it is unlikely this move is invalidated in a single session.
That said, the move has been extremely extended, with roughly a 9% rally in about 10 sessions off the 50-day EMA, so near-term weakness and digestion are expected.
The highest-quality outcome would be a gap fill to the upside, which would signal continued relative strength and confirm demand is still in control.
If looking for pullback trades or gap-fill setups, small caps and mid-caps remain the preferred areas over large-cap technology.
FOCUSED STOCK
KGC: Miners Still The Strongest Trend Trades
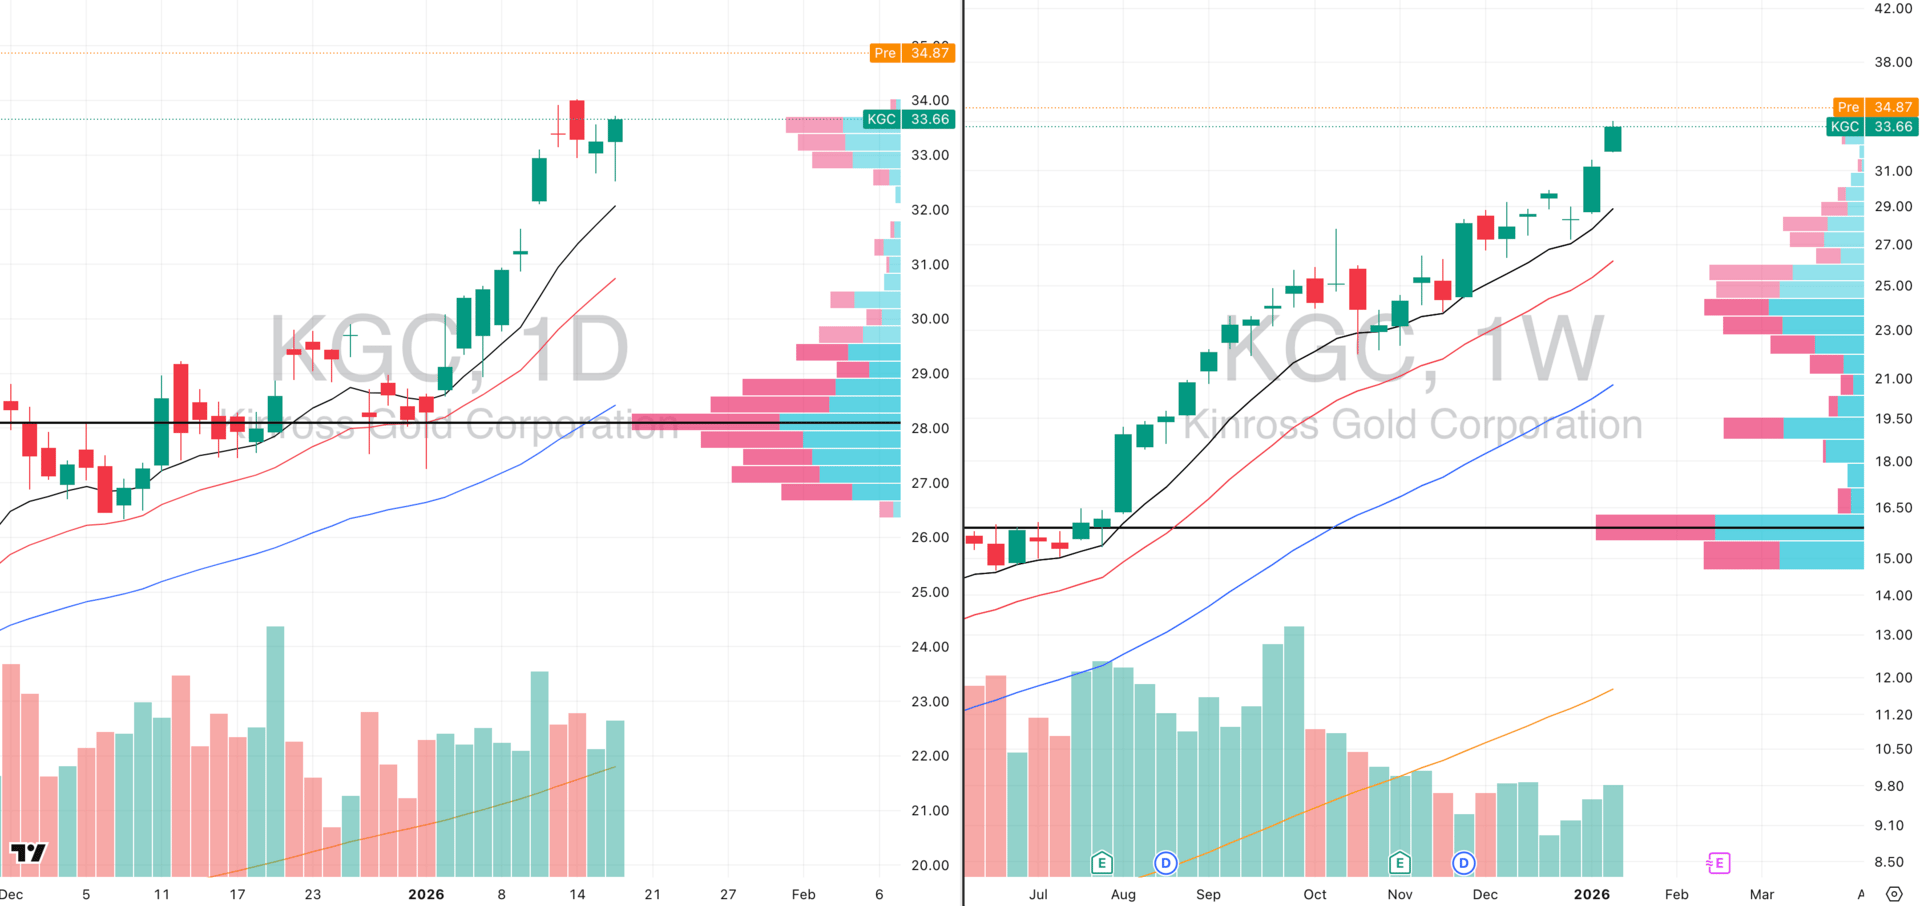
KGC VRVP Daily & Weekly Chart
ADR%: 3.31% | Off 52-week high: -1.1% | Above 52-week low: +229.9%
KGC continues to exhibit exceptional relative strength, sitting near a 99 RS rating versus the SPX, within the strongest segment in the market: precious metals.
The stock has maintained a clean intermediary uptrend since early April and has not broken below its 20-week EMA since reclaiming it late last year.
Importantly, KGC is now materially extended, trading at a large ATR multiple above its moving averages, which makes chasing gap-up strength a poor risk-reward proposition.
Commodity-linked equities are especially vulnerable to gap risk, as the underlying assets trade 24 hours while the equity does not.
The optimal entries in names like KGC consistently occur on pullbacks into longer-term moving averages, not on momentum extensions.
The early January pullback into the 10-week EMA is a textbook example of where risk was defined and upside was asymmetric.

Did you find value in today's publication?This helps us better design our content for our readers |
Reply