- Swingly
- Posts
- You Must To Be Defensive Right Now
You Must To Be Defensive Right Now
In partnership with


MARKET ANALYSIS
Here’s All You Need To Know

U.S. index futures are modestly lower this morning as markets work through the final session of the year, but the pullback itself is better understood as part of an increasingly erratic tape rather than the start of a broader risk-off move. Price action over the past several sessions has been choppy, overlapping, and rotational across indices and sectors.
While the broader trend remains constructive, the lack of clean upside continuation following recent breakouts is important to acknowledge. Several leadership areas, particularly within the AI and mega-cap space, have stalled after strong advances, even as downside pressure remains controlled.
This type of market behavior is characteristic of a compression phase where price continues to move, but conviction does not. Moves are occurring, but they are short-lived, frequently reversed, and often fail to follow through beyond one or two sessions.
As a result, traders should be very aware that timeframe risk has increased materially. Holding long or short exposure for extended periods has become far more difficult, and the market is currently punishing traders who attempt to force swing-length positions without confirmation.
In this environment, effective positioning requires dropping down in timeframe. Shorter-term trades, tighter risk parameters, and quicker profit-taking are far more appropriate than pressing size or holding exposure in anticipation of multi-day continuation.
Importantly, this erratic behavior is not being driven by aggressive selling. Volume on recent pullbacks has remained contained, and most major indices are still holding above their key daily and weekly support levels, which suggests this is consolidation rather than distribution.
From a macro standpoint, markets are still digesting a very strong two-week advance that followed the mid-December retest of rising weekly moving averages. The current churn reflects that digestion process, not a breakdown in trend.
Until we see either a decisive expansion in range with volume, or a clean breakdown through well-defined support, the highest-probability approach remains doing nothing unless already positioned, we know this isn’t the best thing to hear for traders who want activity, but it’s always better to be out and want in, than in and want out.
Nasdaq
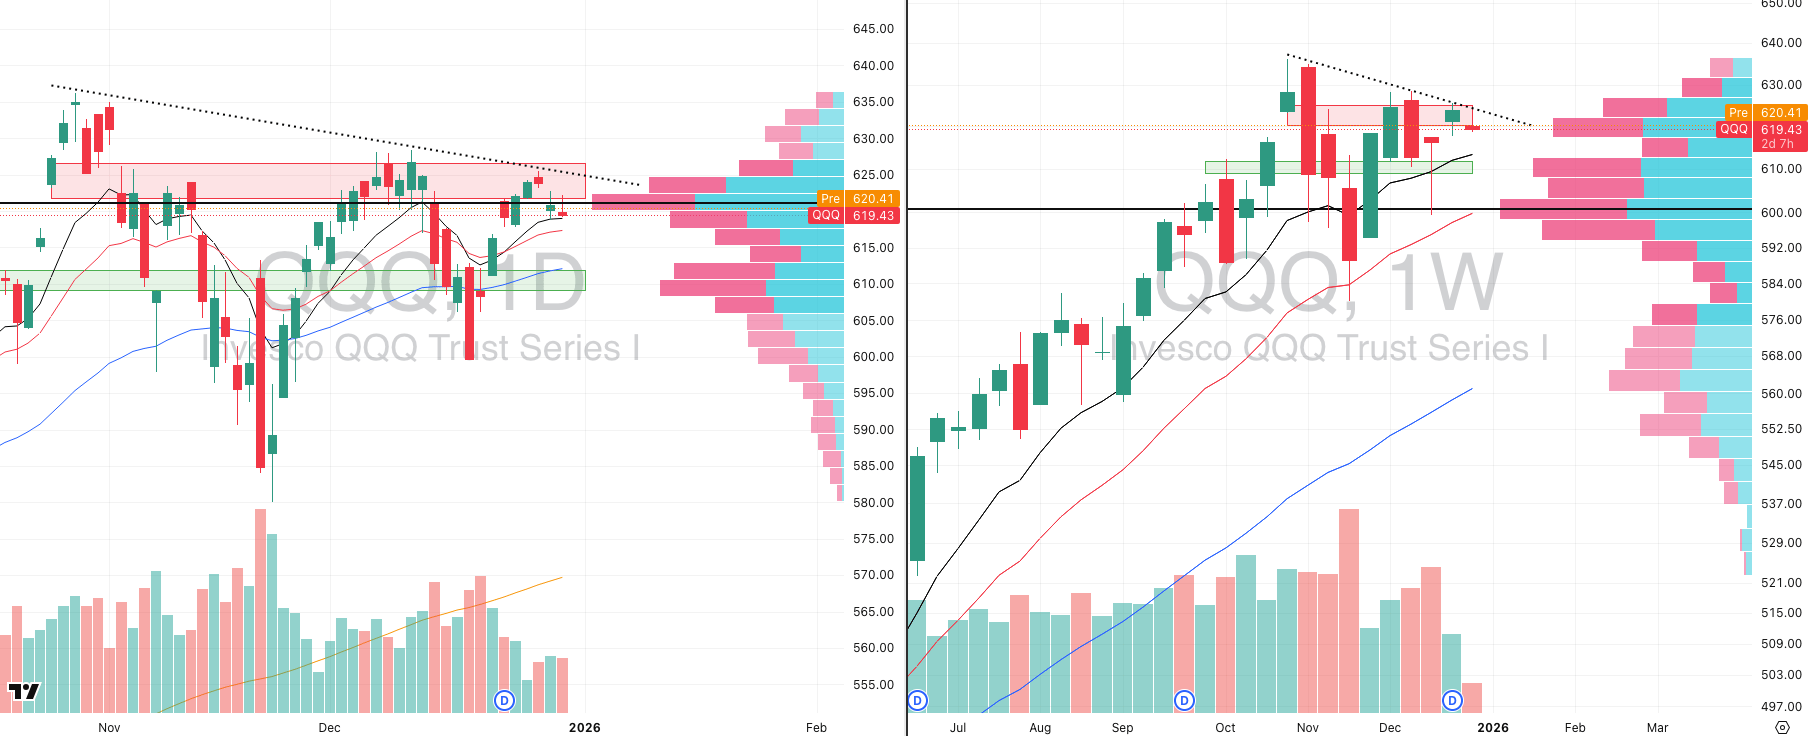
QQQ VRVP Daily & Weekly Chart
49.50%: over 20 EMA | 56.43%: over 50 EMA | 60.39%: over 200 EMA
The QQQ has now clearly rejected supply twice. The first rejection occurred on Friday, December 26, at the descending resistance near 625. That was followed by another weak rejection yesterday at the lower end of the same supply zone around 622, reinforcing that sellers are still active at these levels.
What adds weight to this rejection is the behavior of volume. Relative volume has been rising over the last two sessions while price has failed to push higher, which is not what you want to see during a healthy breakout attempt. This tells us participation is increasing, but it is not translating into upside progress.
On the weekly chart, the QQQ is still rejecting the same declining trendline that has capped price since October 27. Despite the broader trend remaining intact, price is currently sitting roughly 1% above the 10-week moving average, which aligns closely with the daily 50-day moving average and a denser area on the visible range volume profile.
That zone is important because it represents the next logical area where demand should step in if the market remains constructive. A controlled pullback into that region would not be problematic, but the repeated inability to push through resistance does suggest the Nasdaq is still in a short-term fragile state.
Leadership within the Nasdaq remains narrow. A handful of mega-cap AI names, Nvidia being the most obvious example, continue to show relative strength and are holding structure well. Outside of those leaders, however, broad-based participation remains limited.
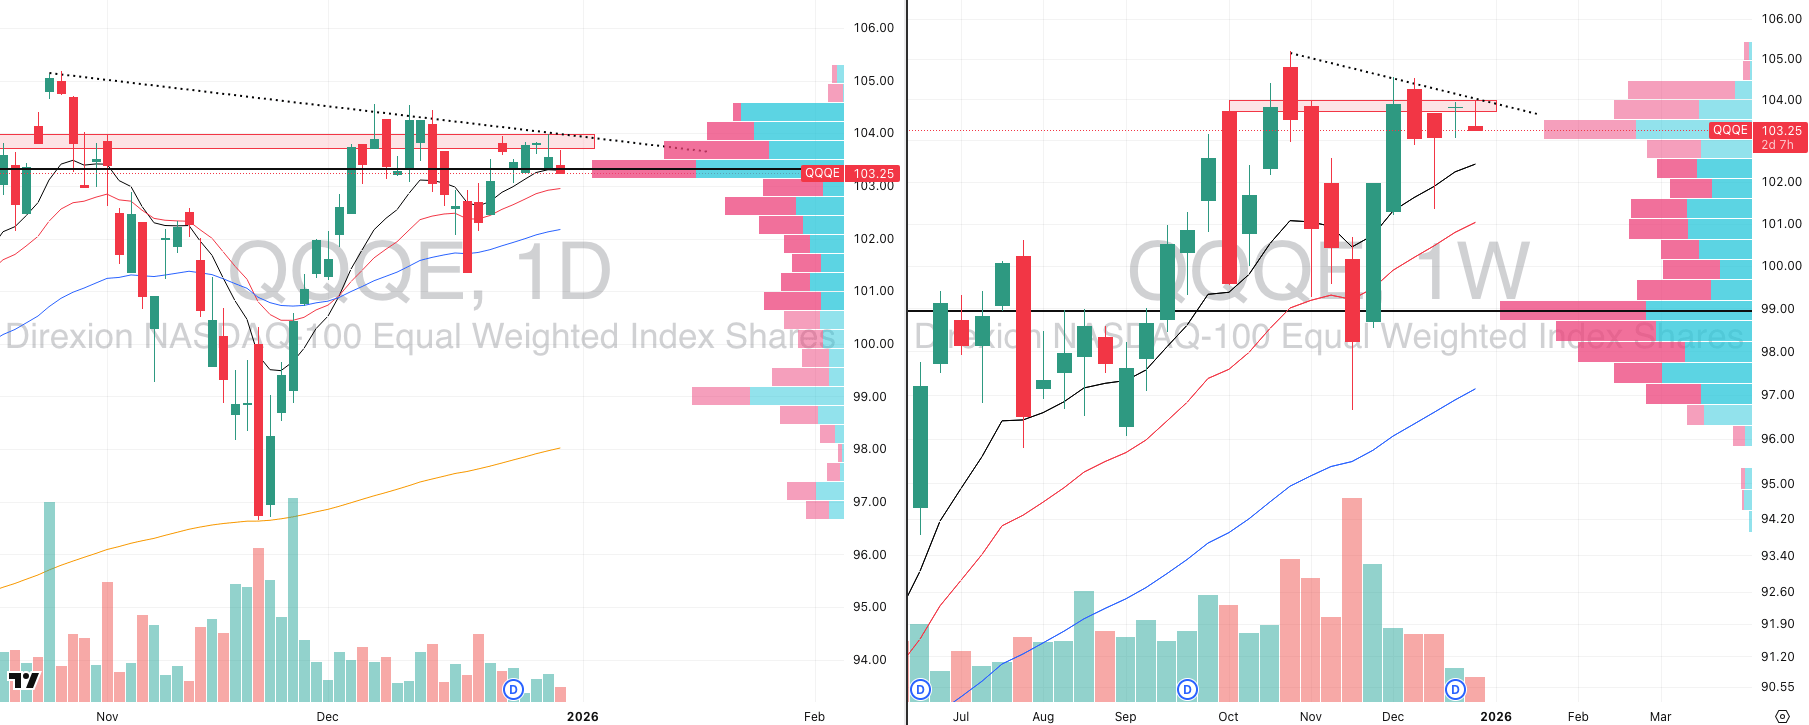
QQQE VRVP Daily & Weekly Chart
The QQQE is telling a very similar story, which adds confidence to the broader read. Price has also rejected its own descending resistance near 104, confirming that this is not isolated to cap-weighted strength alone.
Yesterday’s candle formed a clear rejection pattern, and the QQQE is now trading below its 10-day moving average while still remaining above the 10-week moving average. This positioning increases the probability of a short-term pullback toward the 102.1–102.3 area, which would represent roughly a 0.7% to 1% downside move.
That level is important not because it implies weakness, but because it lines up with a more meaningful support zone where price can reset without damaging the broader structure.
Viewing the QQQ and QQQE together is critical here. Both indices are rejecting resistance simultaneously, both are elevated above intermediate-term support, and both are failing to generate upside follow-through. This confluence reinforces the idea that the Nasdaq is consolidating rather than preparing for an immediate expansion.
S&P 400 Midcap

MDY VRVP Daily & Weekly Chart
47.50%: over 20 EMA | 64.50%: over 50 EMA | 58.50%: over 200 EMA
The mid-caps broke back below the 10-day moving average yesterday, and importantly, they did so on a clear spike in relative volume. That volume behavior matters more than the price break itself. Over the last three sessions, volume has been rising while price has been declining, which is not the signature of healthy consolidation.
At this point, a retest of the prior breakout area around 607.8 looks increasingly likely. This is the same level we broke above on December 10, but that breakout never produced clean follow-through. Instead, price stalled almost immediately, and momentum has now started to roll back over.
The lack of follow-through from that December breakout is becoming more problematic as supply continues to show up. The 20-day moving average has held consistently since the late-November breakout, but with volume expanding on the downside, the probability of that level holding is diminishing.
If the 20-day EMA fails, the next logical move is a pullback toward the point of control near 604. From there, a deeper push toward the 50-day moving average around 600 becomes a realistic scenario, representing roughly a 1.5% downside move from current levels.
What is driving our caution here is not just price, but the clear shift in momentum and participation. We had a breakout attempt in the mid-caps, but without sustained demand behind it, that breakout is now at risk of failing.
Russell 2000

IWM VRVP Daily & Weekly Chart
38.56%: over 20 EMA | 58.21%: over 50 EMA | 61.32%: over 200 EMA
The small caps are showing the same behavior as the mid-caps, but in a more aggressive fashion. The IWM has already broken below its 20-day moving average, and this is the first time we have seen that happen with rising relative volume since the rally began on November 24.
That breakdown significantly raises the odds of a deeper pullback. The next area of interest sits around the 10-week moving average, which also aligns closely with the 50-day moving average near 245.
If price moves into that zone, it will be a critical test of whether this entire late-November recovery remains intact or whether it needs more time to reset.
Given the current setup, this is not an area where exposure is being rewarded. Momentum is turning, volume is expanding on weakness, and leadership is absent. From where we stand, it makes far more sense to stay patient and let this resolve rather than forcing trades into a deteriorating structure.
Colorado’s Most-Awarded Brewery Did Something Totally Unique

Some companies make lofty promises to investors and never deliver. Others use those dollars to unlock new levels of scale.
That’s Westbound & Down’s story. Already Colorado’s most-awarded craft brewery, they opened their doors to investors for the first time to help open a flagship Denver-metro-area location.
With 2,800% distribution growth since 2019 and a retail partnership with Whole Foods, it’s no shock investors maxed out that campaign in less than 60 days.
But it’s what comes next that’s even more exciting. Fresh off Brewery of the Year honors at the 2025 Great American Beer Festival, W&D is scaling toward 4X distribution growth by 2028.
This is a paid advertisement for Westbound & Down’s Regulation CF Offering. Please read the offering circular at https://invest.westboundanddown.com/
FOCUSED STOCK
NVDA: The AI King Needs To Be Watched
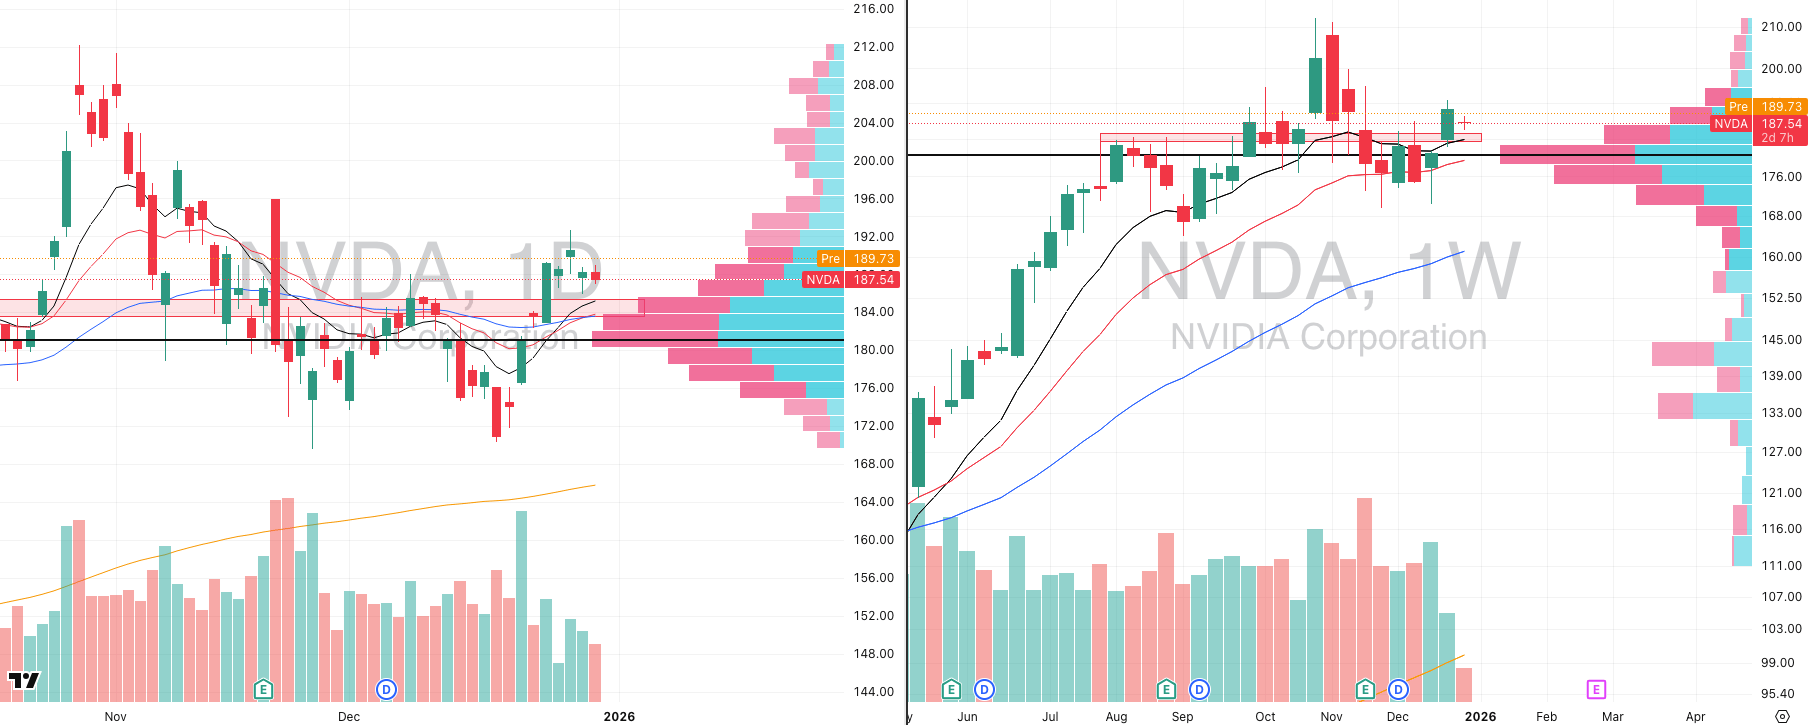
NVDA VRVP Daily & Weekly Chart
ADR%: 2.23% | Off 52-week high: -10.2% | Above 52-week low: +119.7%
We touched on this briefly in the NASDAQ section, but NVIDIA remains the clear centerpiece of the AI trade and one of the most important stocks in the entire market right now.
NVIDIA broke out on December 23 and, crucially, has not failed that move. Since the breakout, price has moved sideways in a tight contraction while relative volume has declined, which is exactly what you want to see after an impulsive move higher.
Over the past few sessions, NVIDIA also successfully retested its prior breakout level around 186, which lines up with the rising 10-week moving average. Price pushed off that level on December 29, consolidated above it on the 30th, and now looks positioned for potential follow-through. From a structure perspective, this is expected post breakout behavior.
Given the current environment, where broad index exposure is choppy and erratic, NVIDIA stands out as one of the few names offering clean structure, leadership, and relative strength. From where we are positioned, this is the number one stock to be tracking right now.
FOCUSED GROUP
BOAT: Global Shipping Multi Month Breakout
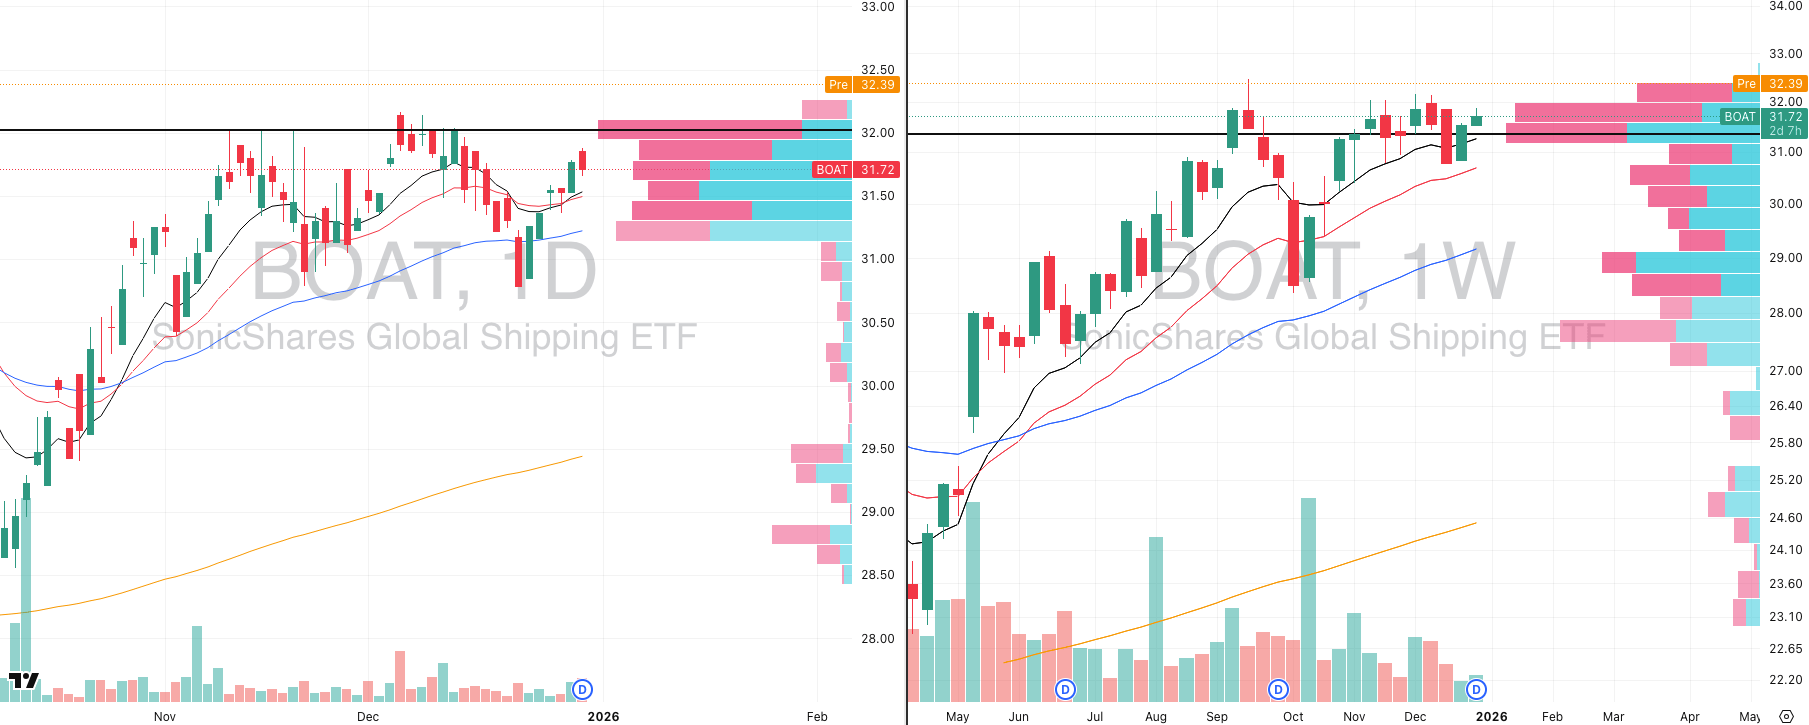
BOAT VRVP Daily & Weekly Chart
The focus group we are highlighting is Global Shipping. This is not a group that gets much attention, but that is often where some of the most interesting opportunities emerge.
What stands out here is the length of the contraction. Several shipping names have spent months building tight bases, and we are now starting to see signs of expansion and follow-through. When multi-month contractions resolve higher, they tend to produce sustained trends rather than short-lived moves.
To make this actionable, we have attached the top 10 holdings inside the BOAT ETF below. BOAT offers diversified exposure to the global shipping complex and provides access to names that most traders are simply not watching.
If BOAT continues to push higher, this group offers two key advantages. First, it provides exposure to a part of the market that is not crowded. Second, it can act as a partial defensive allocation if broader equities begin to roll over, given the group’s distinct drivers and relative independence from high-multiple tech.
This is not a group to chase blindly, but it is absolutely one to have on your radar as these long consolidations begin to resolve.

Top 10 Holding in BOAT

Did you find value in today's publication?This helps us better design our content for our readers |
Reply