- Swingly
- Posts
- Yesterday Was A Bear Trap?
Yesterday Was A Bear Trap?
OVERVIEW
Strength Absorbed the Shakeout
🟢 Risk-On: Buyers stepped in across QQQ, MDY, and IWM, all three reversed intraday weakness on high relative volume. Tech remains the leadership engine. Midcaps and small caps held key demand zones.
📊 Broad Market Structure: The pullback played out as a textbook shakeout, the SPY undercut the 10EMA then closed green. RSP rebounded sharply off low-volume pockets. Breadth didn’t crack. Volume surged into weakness.
⚠️ Powell Panic Rejected: Markets ignored firing rumors. The fast reversal shows demand is still in control.
🧠 Shallow Pullbacks, Fast Resolutions: This is exactly what strong trends look like. When dips last hours, not days, and get bought on volume, that’s real character. Focus on follow-through today. If leaders push, the playbook is simple: get long, manage size, ride the trend.

MARKET ANALYSIS
Earnings Take the Wheel
Markets are entering Thursday on relatively stable footing, with futures flat as investors digest earnings and political noise.
The Powell firing rumors which briefly jolted markets yesterday were quickly walked back by the White House. The strong intraday reversal that followed tells us all we need to know: the market isn’t pricing in long-term risk from the Fed drama. Price is speaking louder than politics.
Instead, earnings are front and center, and so far the results are impressive:
Over 87% of S&P 500 companies reporting so far have beaten expectations.
This is providing a key psychological buffer after Tuesday’s CPI surprise.
The read-through is simple: as long as earnings deliver, dip buyers remain in control, and Wednesday’s recovery across major indices confirmed that. Traders should shift focus from macro fear to stock-specific leadership and follow-through into next week.
Expect volatility around earnings beats and misses, but remember, the trend remains intact unless key structural levels break.
Nasdaq
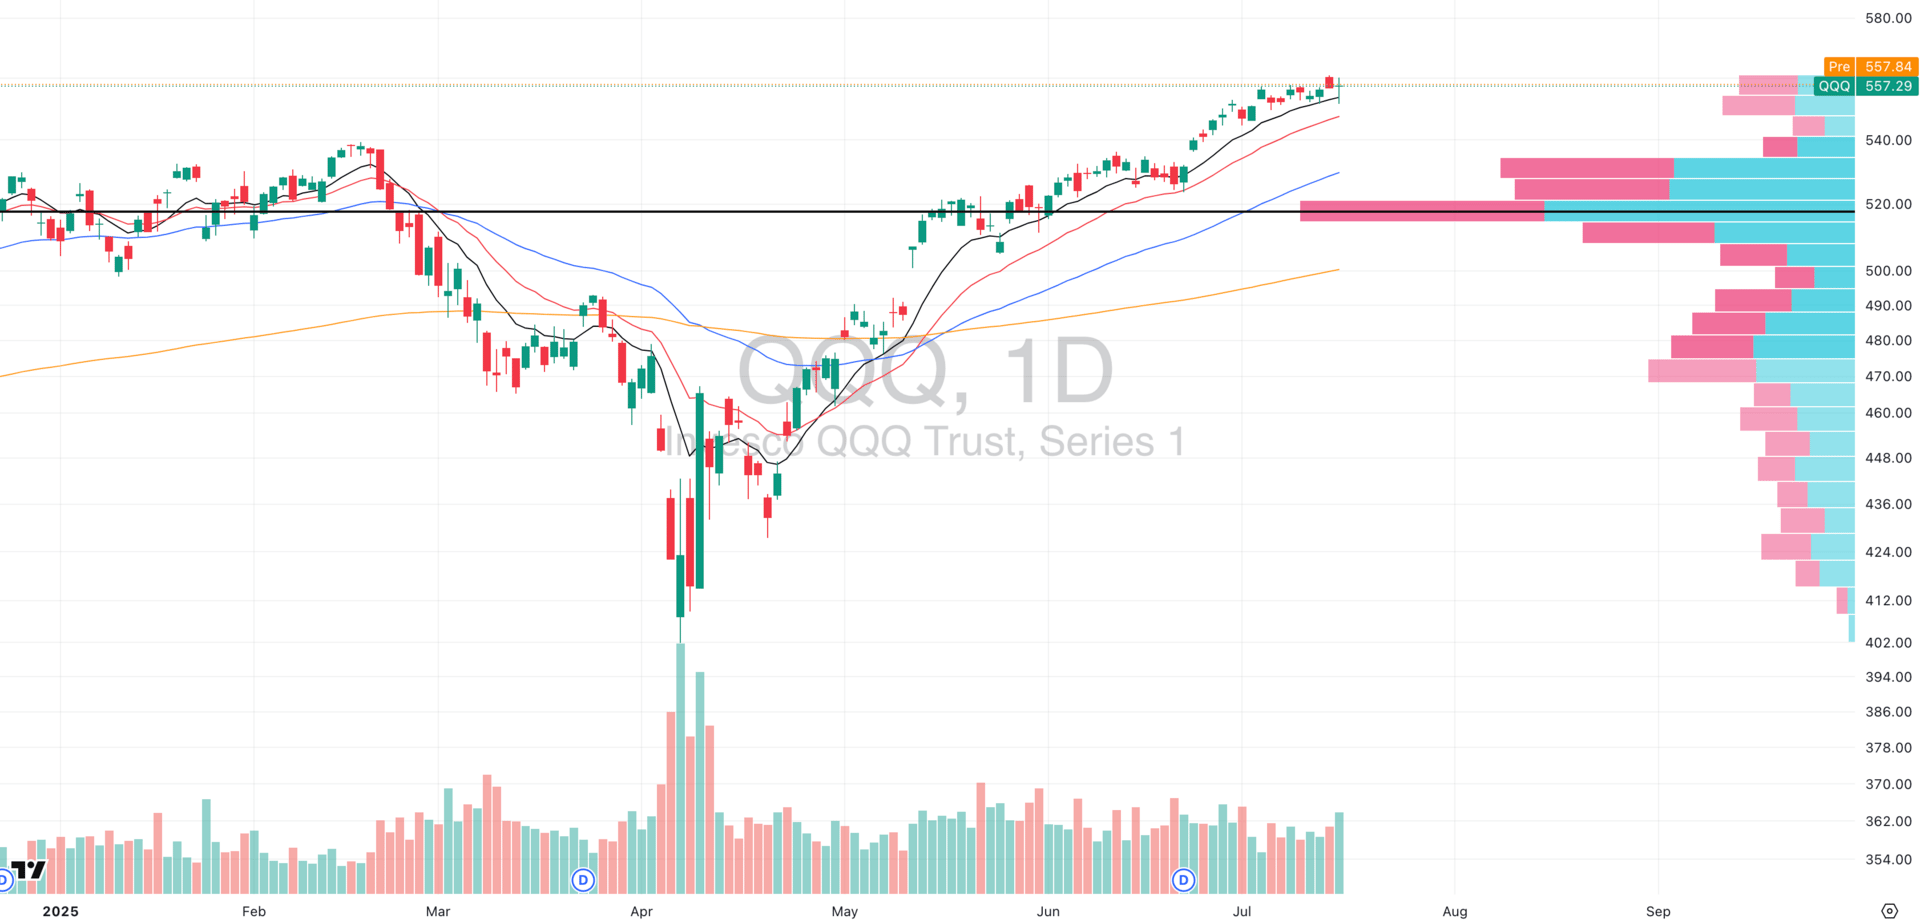
QQQ VRVP Daily Chart
Wednesday’s session opened with ugly action with a sharp pullback right into the rising 10-day EMA. The QQQ bounced sharply off the 10-EMA on the strongest relative volume of the month.
We have since closed the session with a clean bullish hammer candle, confirming aggressive dip-buying behavior.
📊 Why This Matters:
Volume confirms intent. This wasn’t a passive bounce and it appears institutions were active.
The 10-EMA continues to act as the trend’s “heartbeat.” It’s where strong names are defended.
The fact that this reversal occurred just as Powell firing rumors were denied reinforces the tight connection between macro uncertainty and sharp intraday reversals.
If Thursday brings follow-through above yesterday’s high, that confirms the hammer, and opens the door for another trend leg up.
Make sure to keep an eye on QQQE (equal-weighted QQQ) for signs of broader participation beyond just the megacaps (hint, the QQQE looks the same as QQQ which is good).
➡️ Bottom Line: Leadership held. The trend held. The volume surged. Momentum traders now want to see confirmation through follow-through.
S&P 400 Midcap
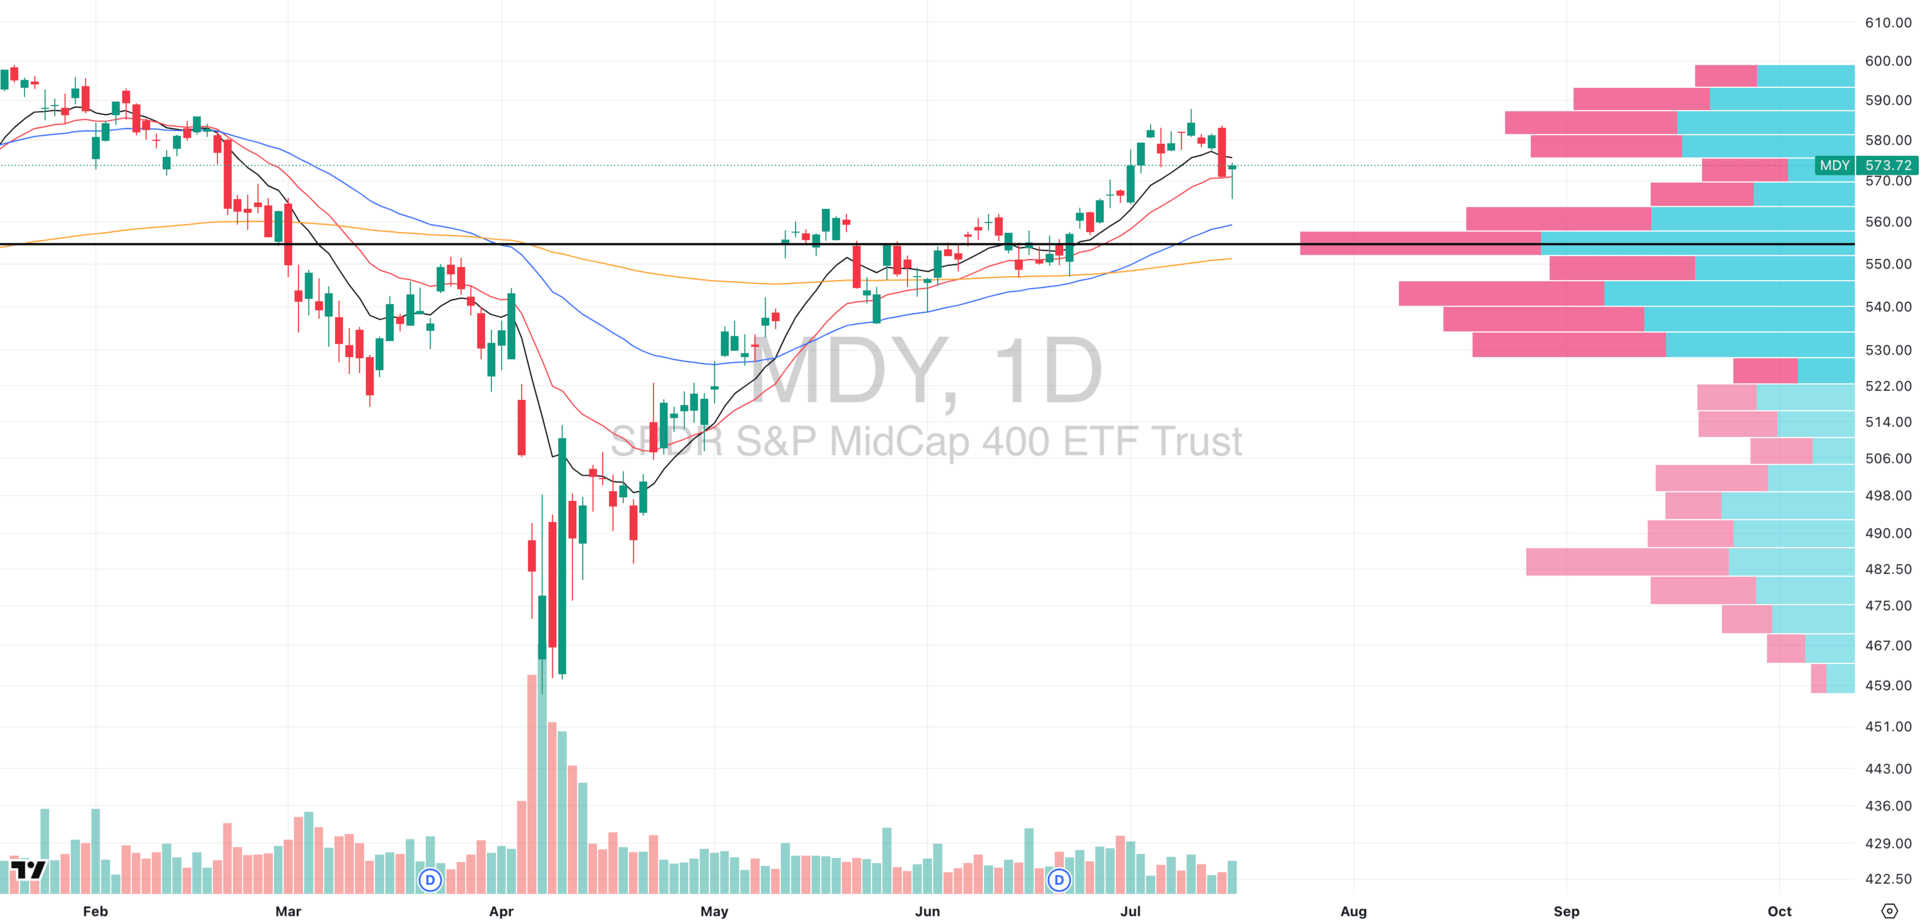
MDY VRVP Daily Chart
Wednesday brought a much deeper pullback in the midcaps relative to QQQ, with MDY sinking below its 20-day EMA, a rare break in recent trend structure.
But here’s what matters:
Price landed exactly at the high-volume demand shelf near $565-$568, which we flagged in yesterday’s report.
This zone aligns with the prior VCP breakout range from May–June.
MDY closed the session with a bullish hammer candle on elevated relative volume, a clear sign of responsive demand.
📌 Now What?
MDY still has significant overhead supply near $580, and that’s the short-term momentum trigger.
We want to see a recovery back above the 10-day EMA, ideally with strong volume to confirm reacceleration.
🔍 Remember!
It’s not about MDY the index , it’s about the average stock inside it.
Use your daily market scans to find midcap names that held trend or bounced off support. That’s where the real opportunity is.
Russell 2000
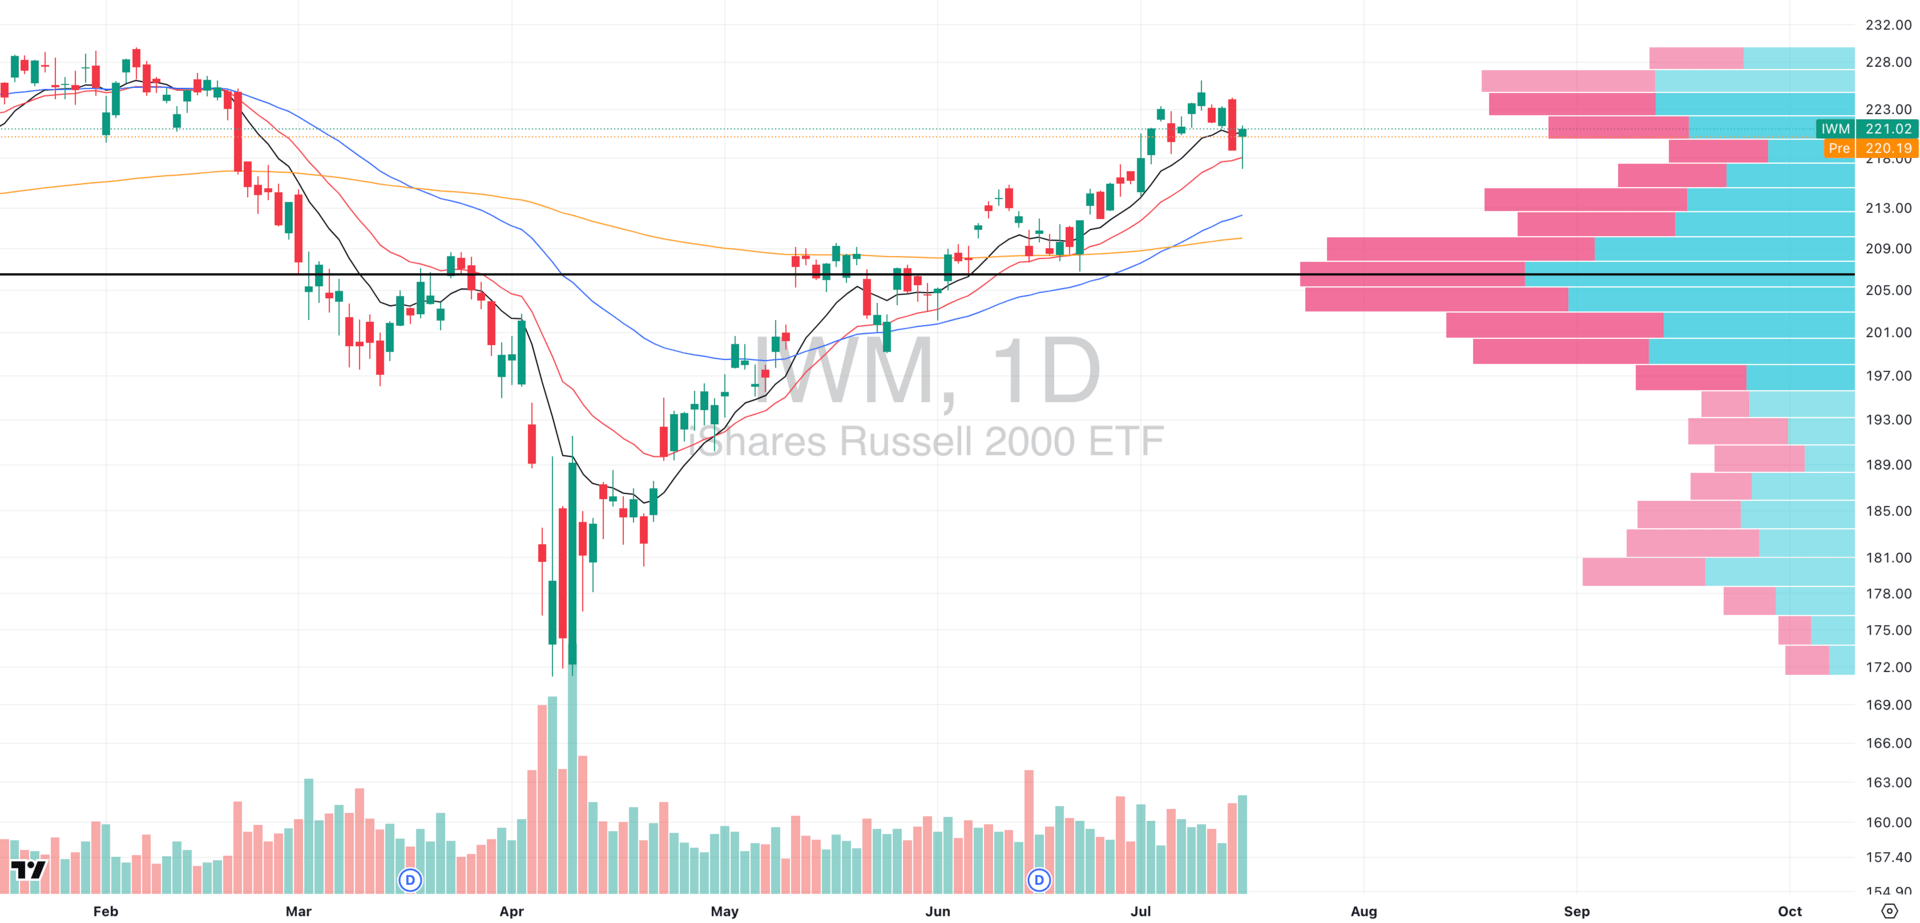
IWM VRVP Daily Chart
The small caps mirrored midcaps almost perfectly: an intraday breakdown, followed by a high relative volume bounce, all centered around the rising 20-day EMA, which acted as a key demand zone.
Yesterday’s session formed a clean reversal candle on volume.
This makes the 20-EMA a structurally important level now confirmed by price.
📌 What to Watch:
For momentum to return, we need to see IWM push back above $222, and reclaim the rising 10-EMA.
Ideally, a range forms above these EMAs. That would indicate strength is consolidating, not failing.
This was a healthy, shallow pullback, and nothing more. These resets are normal and needed in strong trends. We’re watching to see if follow-through shows up today.
ADVERTISEMENT - TradeZella
This Tool Will Transform Your Trading🚀

TradeZella is the all-in-one trading journal and analytics platform built to help you become consistently profitable — by using data, not gut instinct.
✅ Automated Trade Tracking — every trade logged for you, no spreadsheets
✅ Precision Backtesting — test your strategies against real market data
✅ Pattern Recognition — uncover strengths, weaknesses, and recurring setups
✅ Advanced Analytics — get clear metrics like win rate, risk/reward, and P&L
✅ Custom Journaling Tools — organize notes, tag trades, and reflect with purpose
✅ All-in-One Dashboard — no more switching between tools and subscriptions
Whether you're refining your edge or just starting to track seriously, TradeZella gives you the clarity and structure you need to grow.
It’s less than $1/day — and you can get 10% off with code with code ‘SWING’
FOCUSED STOCK
APP: Ready To Go?
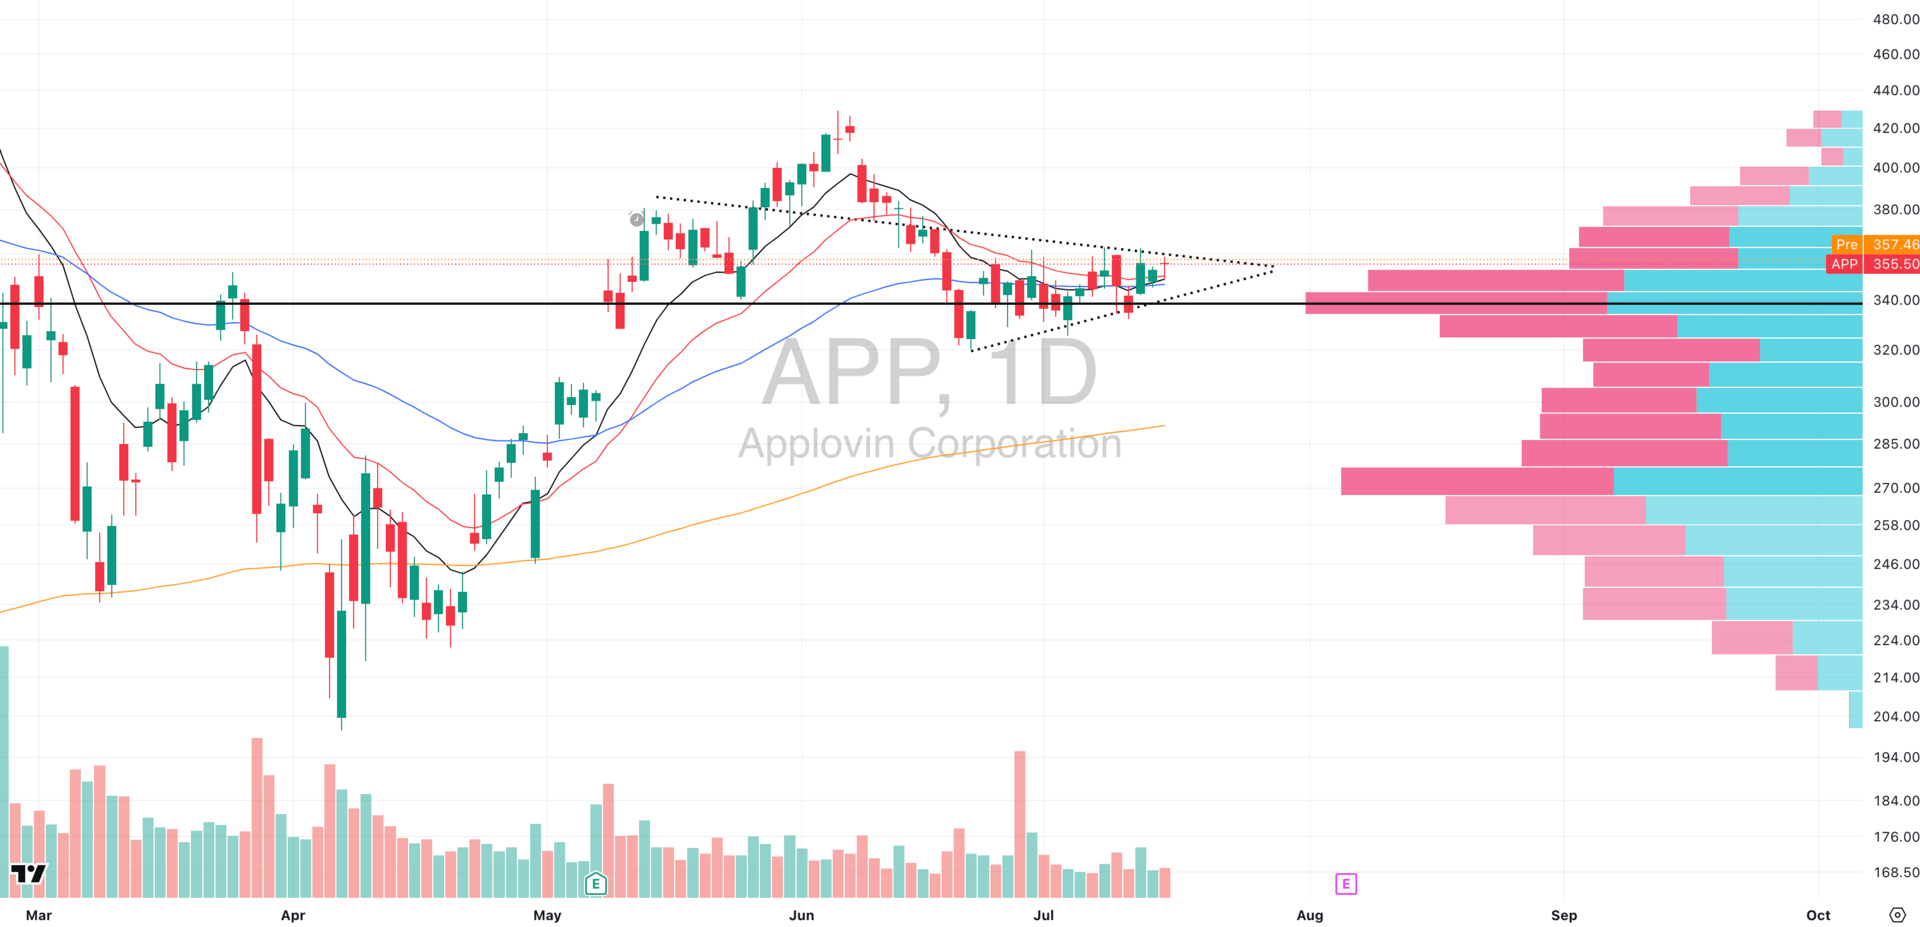
APP VRVP Daily Chart
APP has been on our radar for weeks, and it’s finally shaping up.
The stock bounced cleanly off its POC support at $340, and has since tightened into a compressed coil between that level and a low-volume shelf around $358.
The VRVP shows limited overhead supply, which means if momentum steps in, this could resolve fast.
Volume has been muted during consolidation, a key sign of absorption and not distribution.
💡 Why We Like It:
Tech continues to lead the market, and APP sits in a strong group.
The structure is clean: tight price action + low volume = setup building.
A decisive move through $358 with volume could trigger expansion.
FOCUSED GROUP
QTUM: Quantum Heating Up Again
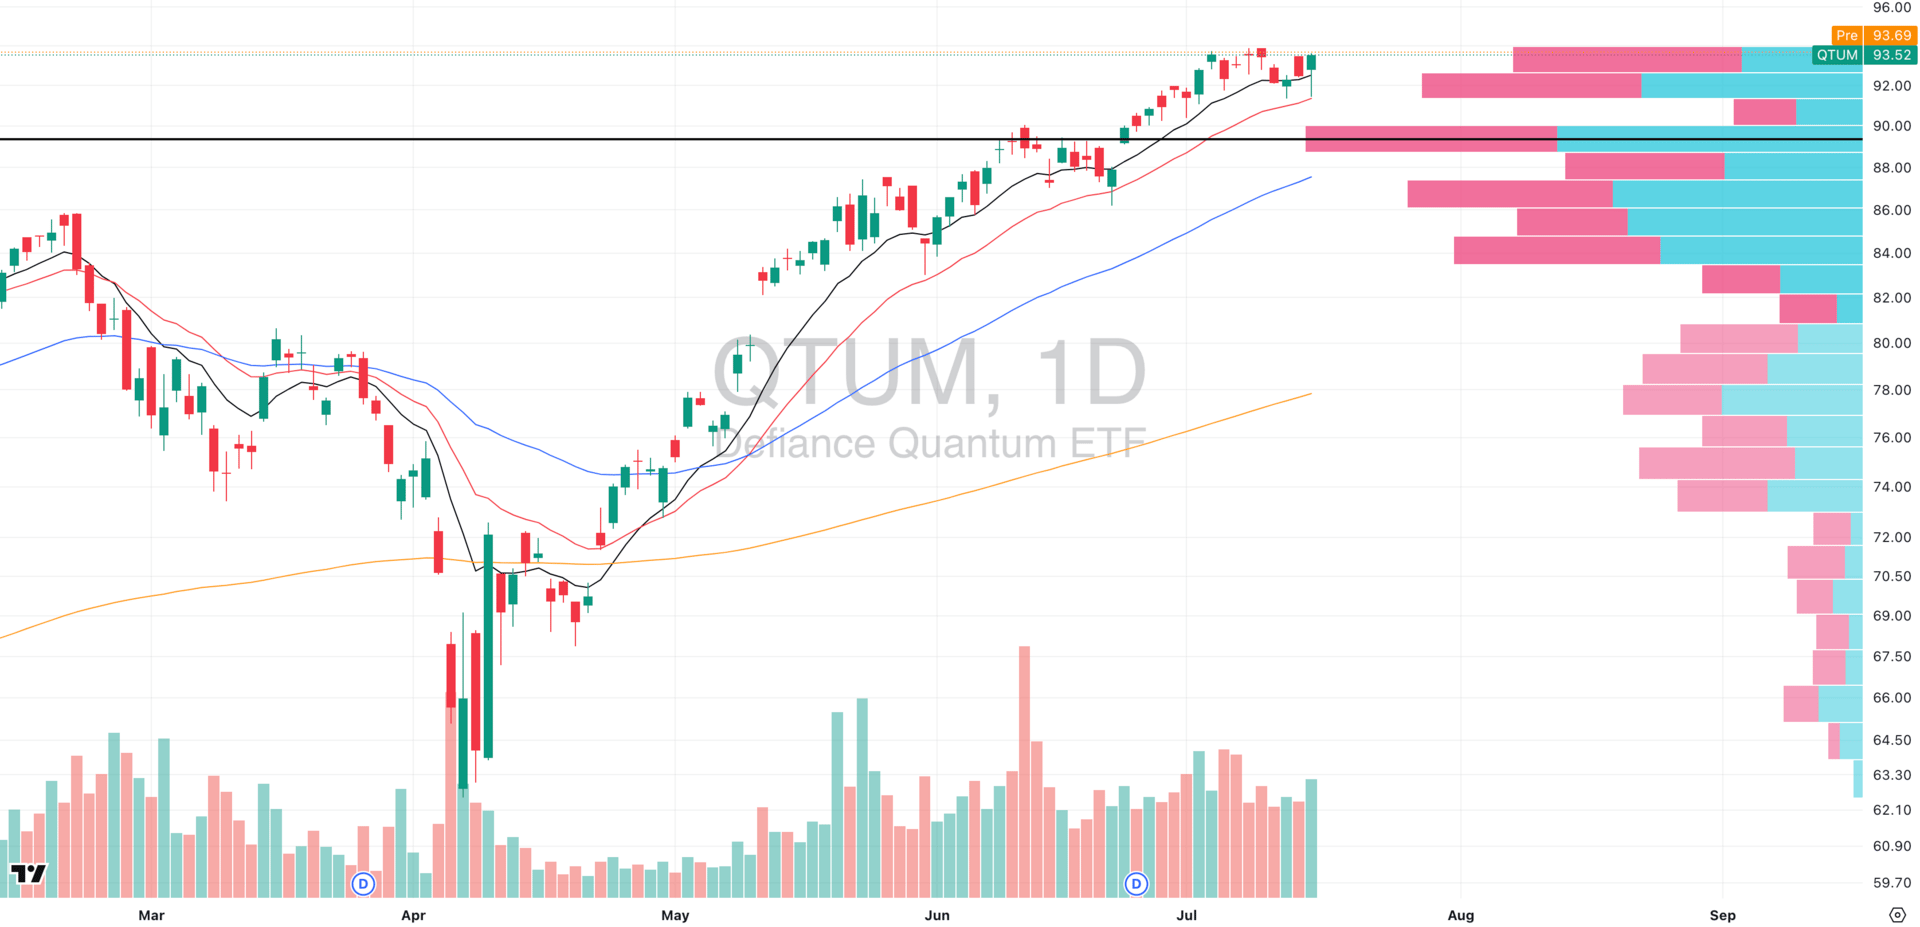
QTUM VRVP Daily Chart
We’ve been saying it for weeks: QTUM is quietly one of the strongest sectors in the market, and it’s finally starting to show.
Yesterday’s session saw RGTI (our Focused Stock from the last report) rip higher, a textbook breakout following our alert.
QTUM as a whole bounced hard off its rising 20-EMA on strong relative volume which is exactly what you want to see in a healthy trend.
It’s now pressing against the top of a tight 2-week base, showing clear leadership vs. other tech groups like CIBR or SKYY.
📡 Why It Matters:
The AI trade is the defining megatrend of this cycle, and quantum tech is increasingly being viewed as a next-generation derivative of that theme, with direct ties to compute power, data infrastructure, and advanced chipsets.
QTUM’s resilience during broad pullbacks is a tell. It held firm while the rest of tech got hit.
If equities continue higher, expect multiple names in this group to lead especially as high growth segments are very strong.

Q&A
Got a trading question? Hit reply and ask!
Q: “How much do you risk per trade, and how much is your position sizing?”
At Swingly, we personally operate with a maximum of 0.25% risk-to-equity per trade, and a position size cap of 30% of account equity per individual name.
To emphasise, risking a fixed % of equity allows for compounding on the way up and auto-deleveraging on the way down which dollar risking does not.
It’s a mathematically anti-fragile structure, meaning it becomes stronger under volatility, not weaker.
✅ Why Only 0.25% Risk?
Because risk = how much you lose when wrong, not how big your trade is.
Let’s say your account is $100K and your stop-loss is 5% away.
To risk only 0.25%, you size like this:
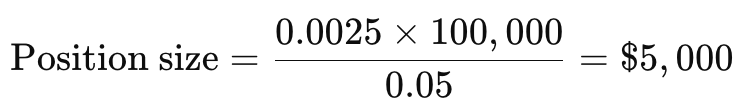
That means:
20 straight full-stop losses = only 5% portfolio drawdown
No emotional panic, no revenge trades, no derailing your edge.
🧪 The Math of Pain: Why It’s Designed This Way
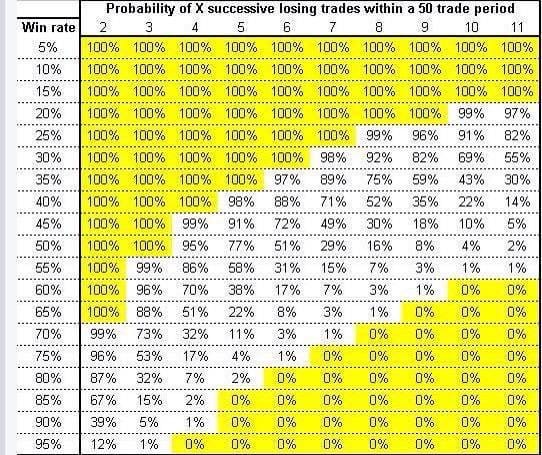
With our generally sub-50% win rate and a system built on low win rate, high R/R trades, the probability of 5+ consecutive losses isn’t just possible, it’s statistically inevitable.
Using binomial distribution models:
If your win rate is 45%, the chance of 5 consecutive losses in any 50-trade sequence is over 91%.
Our structure is about resilience first, compounding second.
Risking fixed % of equity ensures that when we’re in drawdown, we’re shrinking exposure automatically, no ego needed.
As we win, position sizes naturally grow which means we leverage our streaks, not our emotions.
Our 30% position size cap protects against tail-risk (e.g., overnight gaps, black swan events), ensuring a single failed trade never jeopardizes portfolio health.
This is what Taleb calls antifragility:
A system that benefits from disorder, and not breaks because of it.
Want the full breakdown, trade reviews, and complete daily setups in real time?
That’s all inside Swingly Pro → see what’s included
Reply