- Swingly
- Posts
- Yesterday's Shakeout: What Actually Happened
Yesterday's Shakeout: What Actually Happened
In partnership with


MARKET ANALYSIS
Here’s All You Need To Know
The market is rallying on de-escalation headlines after Trump walked back the Greenland-related tariffs and floated a “framework” deal with NATO. This is now a relief rally after geopolitical risk was partially priced in.
Futures are higher across the board, led by tech, while small caps continue to outperform after printing record highs. Positioning was light after the sell-off, so the reflexive bounce is not surprising.
That said, this does not resolve the macro regime. Stocks are still down on the week, and Tuesday’s sell-off was the largest in three months, meaning structural damage remains.
Trade tensions with Europe are unresolved also and sovereignty disputes and retaliation mechanisms (including EU anti-coercion tools) remain active tail risks. Policy volatility is now a persistent macro factor, not a one-off event.
PCE inflation is the next key catalyst. Any upside surprise will reprice rate cuts and pressure growth and duration-sensitive assets.
The AI capex narrative remains dominant, but it is increasingly colliding with fiscal concerns, energy constraints, and policy risk. The recent surge in gold and safe-haven demand shows macro investors are still hedging U.S. policy risk, not fully embracing risk-on.
Treat this as risk-on for low duration tactical bounce plays but structurally risk-off as we still have little evidence of a trend really being formed here for longer term swing trading. Focus on pullbacks, not highs, and keep duration tight.
Nasdaq
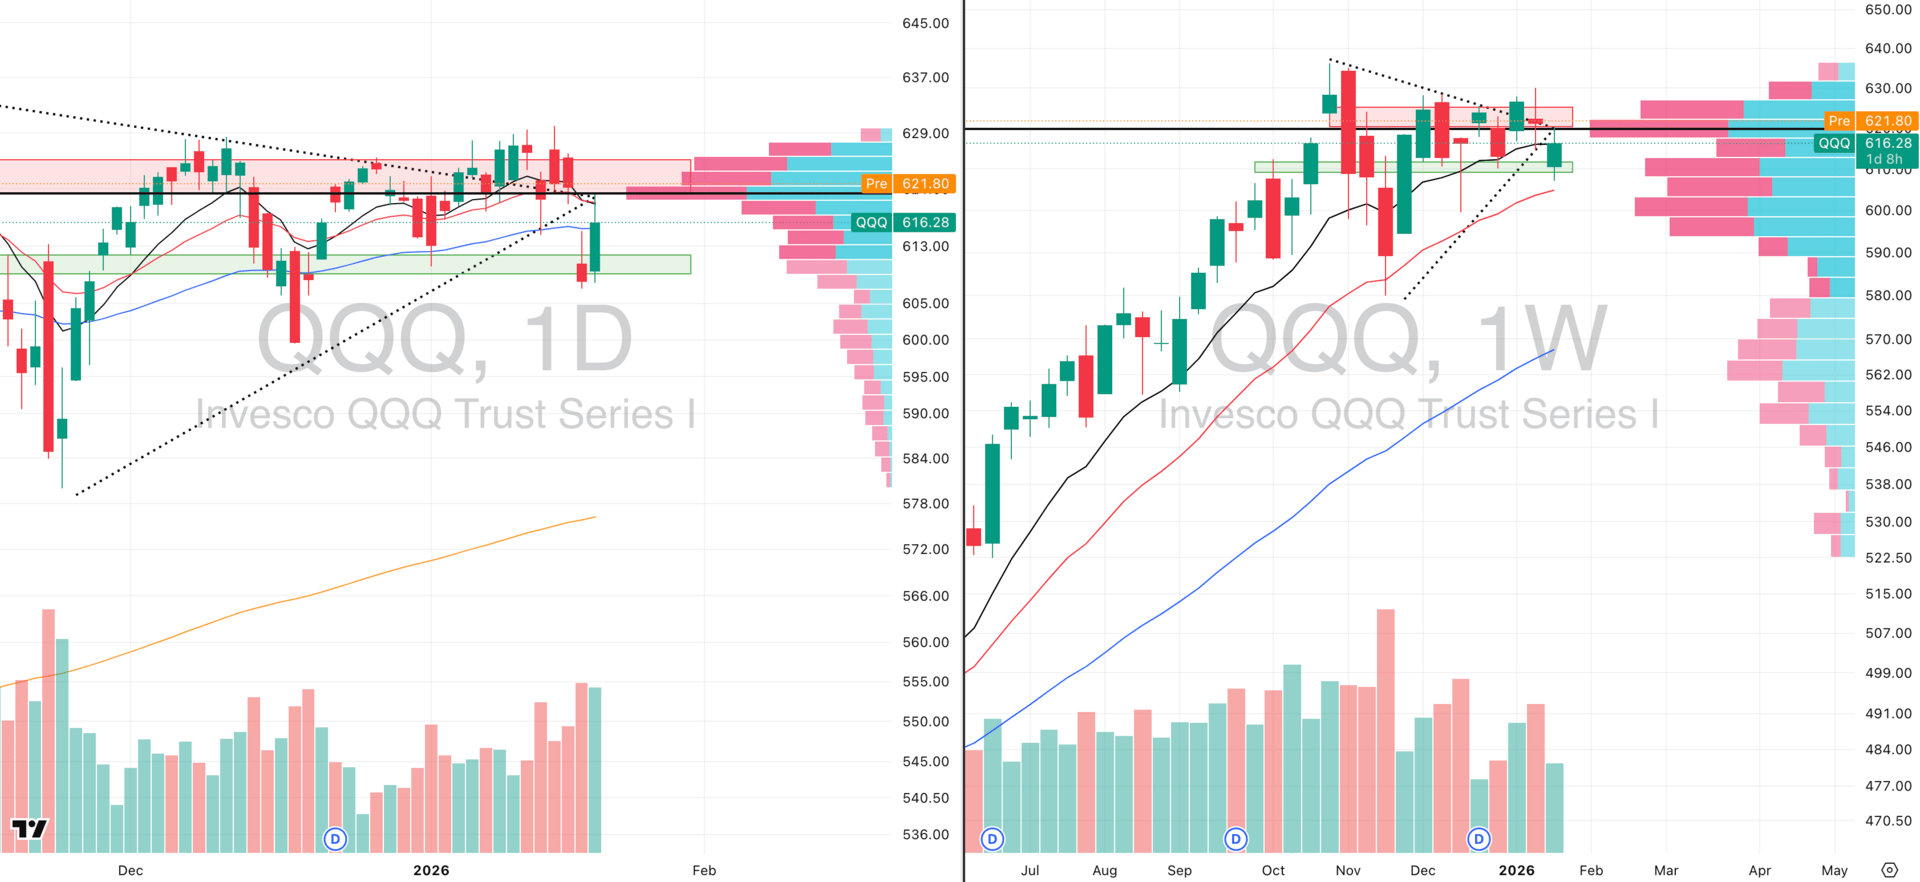
QQQ VRVP Daily & Weekly Chart
48.03%: over 20 EMA | 50.98%: over 50 EMA | 57.84%: over 200 EMA
The NASDAQ put in a constructive session yesterday, with 143% relative volume driving a bullish engulfing candle. Importantly, price did not undercut Tuesday’s lows, and buyers stepped in for a ~2% intraday range, roughly 2× ADR.
We did reject the 10- and 20-day EMAs and the volume POC around 620, but premarket is back above that zone. More importantly, the 607 demand shelf held, aligning with the 20-week EMA (~605).
This is a key structural defense. A break below the 20-week would have materially increased the odds of a Stage 4 markdown. That scenario was avoided for now.
The combination of high volume and VIX compression suggests real dip-buying rather than a low-volume bull trap which we were worried for, though follow-through still matters.
S&P 400 Midcap
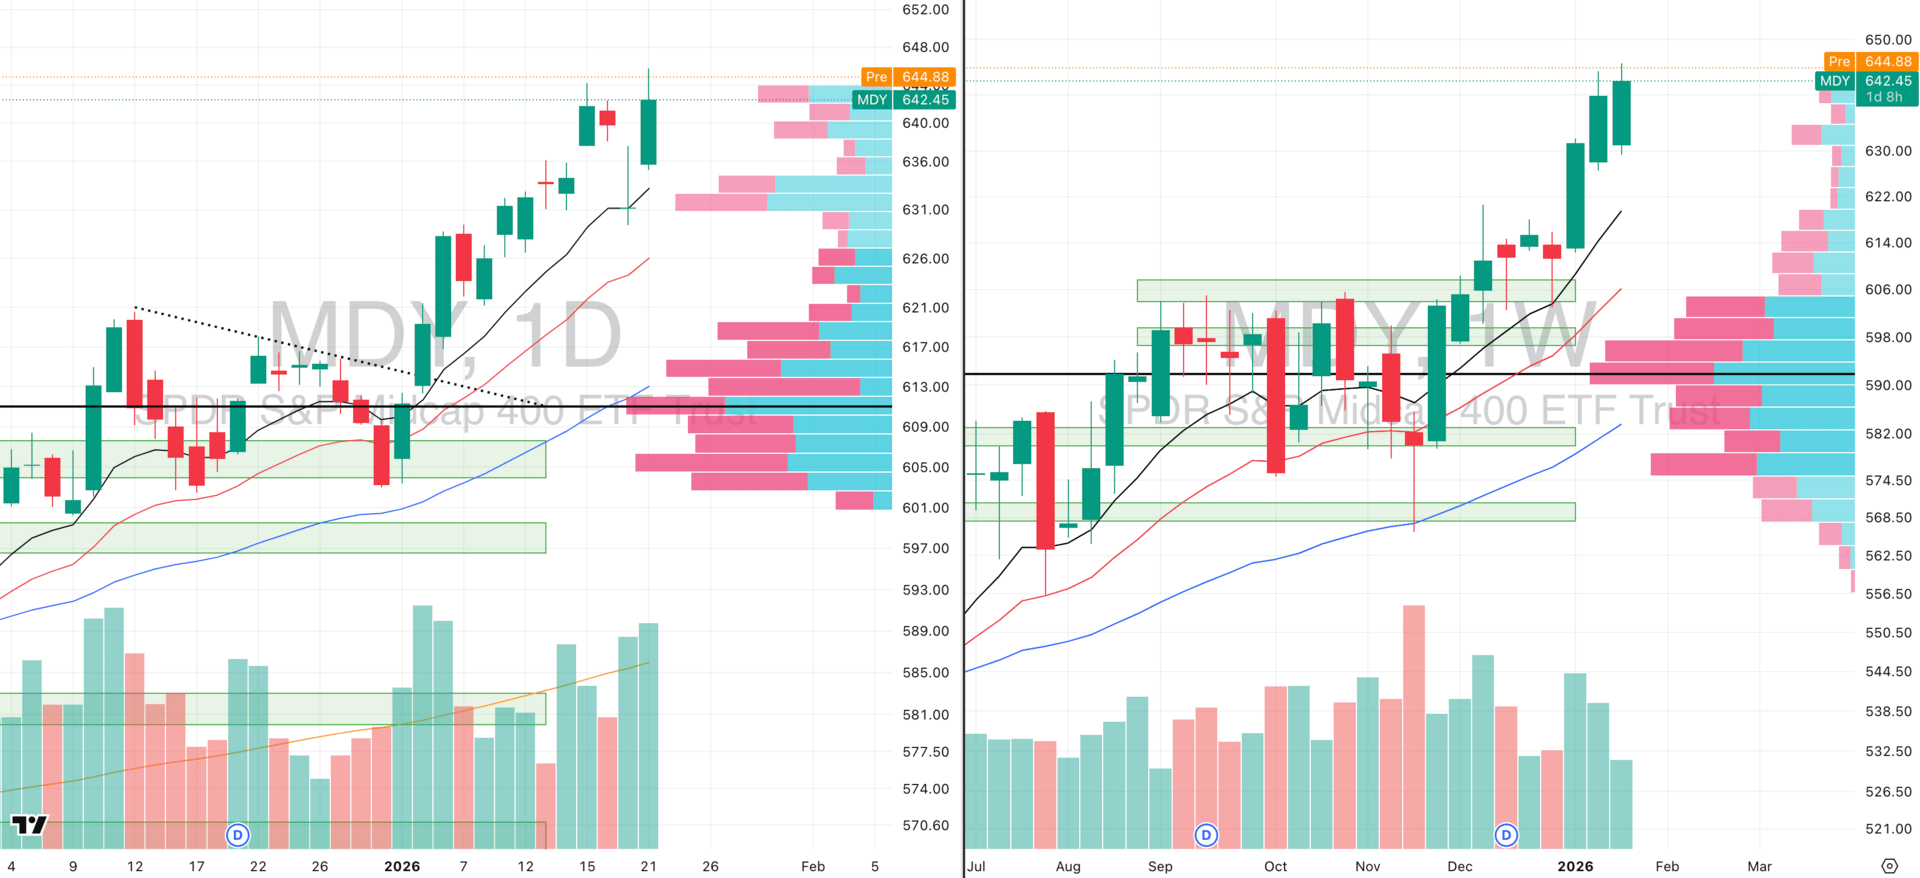
MDY VRVP Daily & Weekly Chart
72.68%: over 20 EMA | 75.68%: over 50 EMA | 69.92%: over 200 EMA
Mid-caps continue to lead. Price printed fresh highs yesterday with 139% relative volume, reinforcing the ongoing Stage 2 trend.
Weekly structure remains clean: higher lows, persistent demand on pullbacks, and strong volume support between ~636–641, where buy volume materially exceeded sell volume.
This remains the cleanest risk-on segment structurally, though increasingly extended in the short term.
Russell 2000
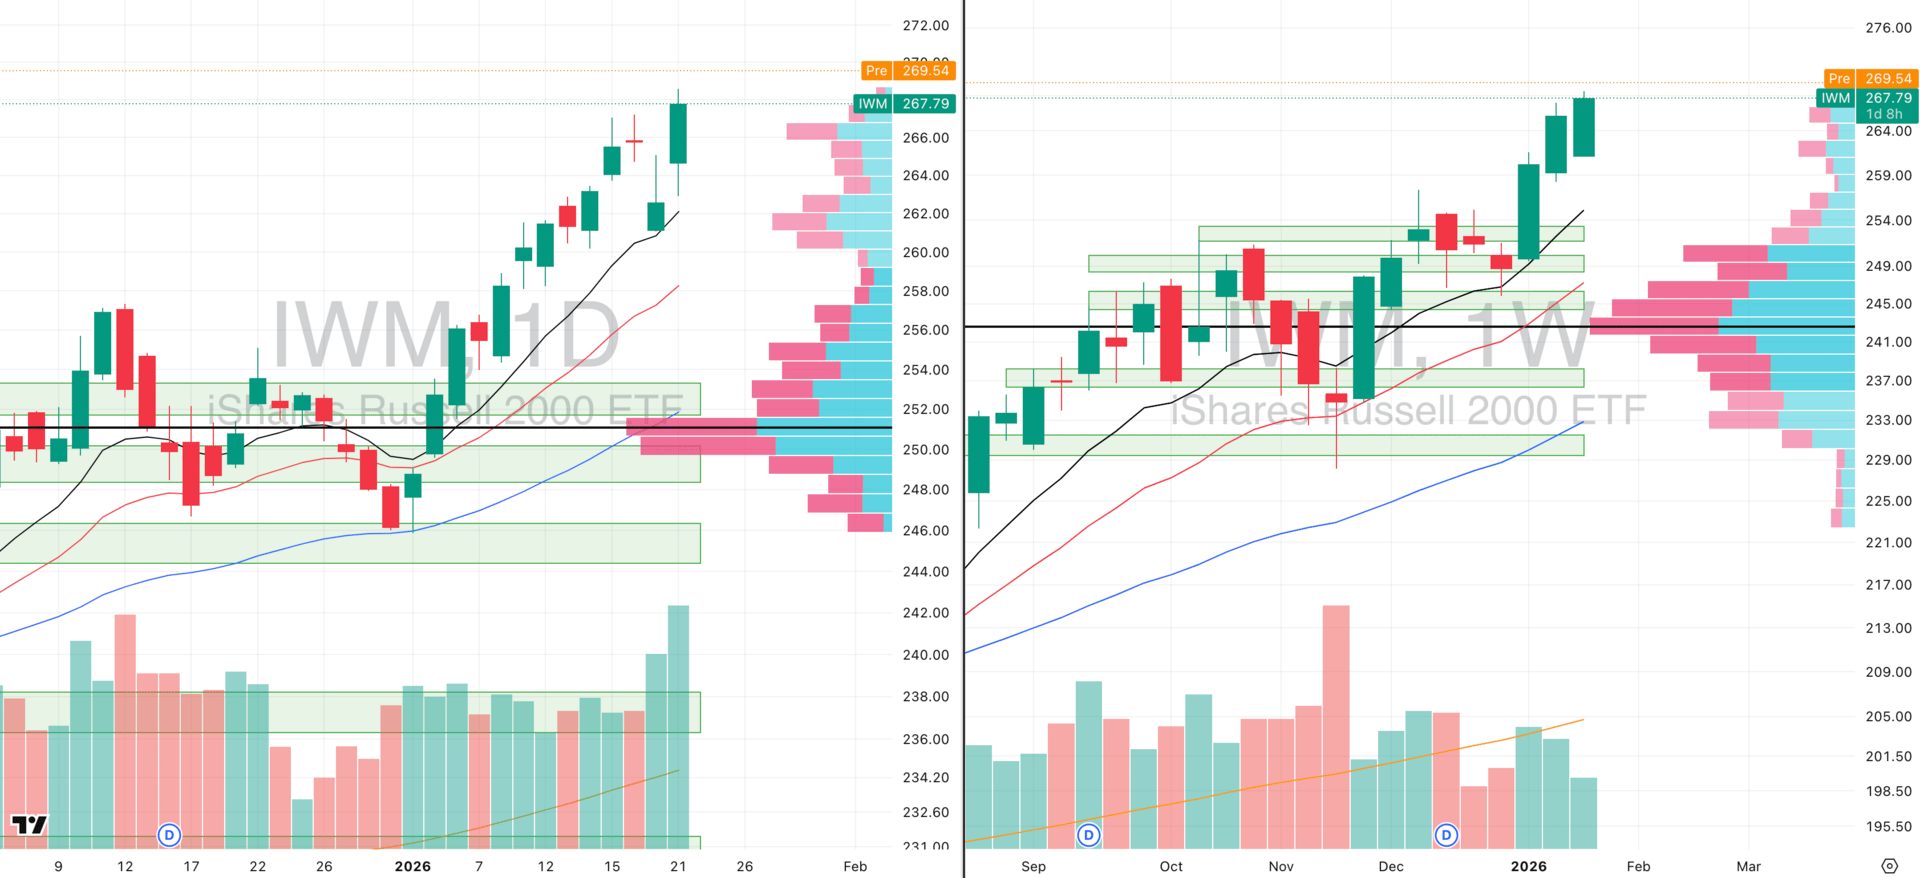
IWM VRVP Daily & Weekly Chart
70.79%: over 20 EMA | 71.98%: over 50 EMA | 69.24%: over 200 EMA
Small caps are now the highest relative strength segment (RS ~86 vs SPX).
Yesterday saw 146% relative volume, the largest since the November capitulation event, with an ADR expansion >2.2%. This is a genuine expansion move, not just mechanical beta.
We are gapping up again and although that gap can fade, pullbacks into short-term moving averages remain the highest-quality equity entries in the current regime.
Learn Real Estate Investing from Wharton's Best Minds

In just 8 weeks, learn institutional-grade real estate analysis and modeling from Wharton faculty and seasoned investors.
You’ll gain:
Insider insights on how top firms like Blackstone and KKR evaluate deals
Exclusive invites to recruiting and networking events
Direct access to Wharton faculty and a certificate that signals credibility
Join a thriving community of 5,000+ graduates for ongoing career development, networking, and deal flow.
Use code SAVE300 at checkout to save $300 on tuition.
Program starts February 9.
FOCUSED STOCK
CIFR: Watch Closely For A Crypto Breakout
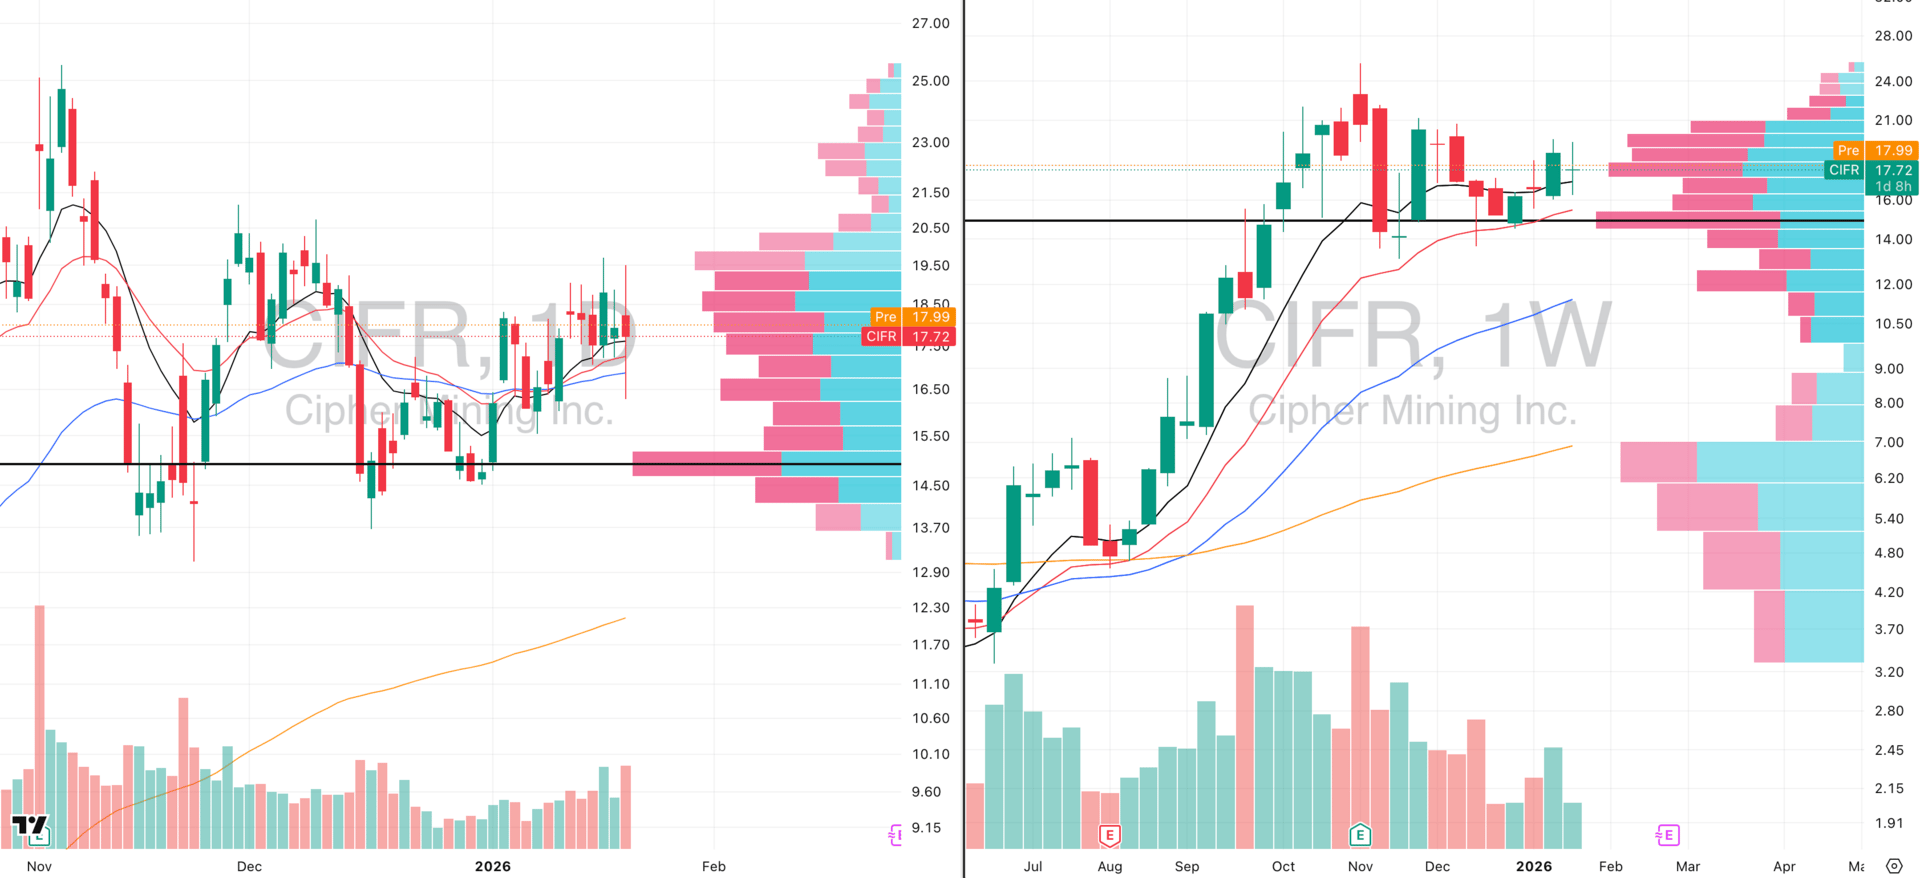
CIFR VRVP Daily & Weekly Chart
ADR%: 9.28% | Off 52-week high: -30.6% | Above 52-week low: +852.7%
CIFR is still in a multi-month contraction since October and held the 10-week EMA during yesterday’s shakeout.
Crypto majors are tightening structurally. If BTC/ETH break higher, CIFR is one of the highest beta vehicles to that move.
Prefer entries on pullbacks into the 10- or 20-week EMA rather than chasing strength is still the best entry style which is obvious from the wide ranges and intraday noise seen across the US equities market for the last few weeks.

Did you find value in today's publication?This helps us better design our content for our readers |
Reply