- Swingly
- Posts
- Yesterday’s Bounce Changed Something
Yesterday’s Bounce Changed Something

MARKET ANALYSIS
What You Need To Know

Markets are still trading headlines rather than clear macro direction. Yesterday’s sharp rebound came after President Trump suggested the conflict with Iran could be “very complete” and might end “very soon.”
That shift in tone immediately helped calm some of the worst fears around the oil supply shock and allowed risk assets to recover from deeply oversold levels.
Oil remains the key macro variable right now, but the panic has eased slightly. After briefly surging above $100 and even spiking toward $119 at one point, crude reversed sharply and fell back toward the low $90s as traders began pricing a higher probability that the disruption may not last as long as initially feared.
Even so, the situation around the Strait of Hormuz remains fragile, with Iranian officials warning that oil tankers passing through the region “must be very careful.”
The market is effectively trying to price two completely different outcomes. If the conflict de-escalates quickly, the oil spike will likely prove temporary and risk assets could stabilize.
If it drags on, however, the conversation quickly shifts back toward stagflation with generally higher energy costs colliding with slowing growth and already weak labour data. That is why recession probabilities in prediction markets have started creeping higher again.
For now, the rebound should be viewed as relief rather than resolution. U.S. futures turned lower again overnight despite Monday’s recovery, which shows conviction is still extremely fragile. Yesterday’s move was real, but it was also helped by a market that had become technically oversold and was primed for a bounce the moment the geopolitical narrative softened even slightly.
The reversal in oil is also an important signal for equities. If crude had continued pushing higher above $100, markets would likely have remained trapped in a much harsher stagflation narrative.
The fact that oil pulled back instead is one of the main reasons growth stocks and the Nasdaq were able to rebound as aggressively as they did. That does not mean the risk has disappeared, but it does mean the market is willing to believe, for now, that the energy shock might not become structural.
Globally, the tone remains mixed rather than outright risk-on. European and Asian markets traded higher on the same de-escalation narrative, but U.S. futures reversing lower again highlights just how sensitive sentiment remains. At the moment, every new headline still has the potential to shift the market’s interpretation of the situation.
The market is no longer pricing the worst-case oil scenario with the same intensity it was earlier this week, which creates room for an oversold bounce and particularly in growth.
This does also mean its open to even disappointment if the situation escalates further, but this remains a very event-driven tape, and until oil, volatility, and geopolitics begin to stabilize together, sharp two-way moves are far more likely than a clean trend.
Nasdaq

QQQ VRVP Daily & Weekly Chart
47.52%: over 20 EMA | 45.54%: over 50 EMA | 47.52%: over 200 EMA
The Nasdaq delivered a very strong recovery session, bouncing precisely from the lower boundary of the demand zone we have highlighted around $592, which is the area price has been chopping around since the first week of February.
Yesterday’s move was significant not only because of the location of the bounce, but also because of the strength behind it. The session printed a 3% range, which is roughly 1.8× the QQQ’s average daily range, while relative volume expanded to 152% of the 20-day average.
More importantly, the move fully engulfed the recent consolidation range and allowed the Nasdaq to reclaim several important technical levels. Price recovered the 10-day and 20-day EMAs, and most importantly reclaimed the 20-week EMA around $606, which was the key level we needed to see regained if the market was going to stabilize.
The one area where supply did step in was the declining 10-week moving average near $610, which acted as resistance during the session. That rejection is not surprising given the amount of trapped supply sitting overhead after the recent sell-off.
Despite that, it is important to view this move within the broader context. The Nasdaq has been the most beaten-down segment of the market over the past few months, particularly within the growth complex.
That also means it has the most to gain during any relief rally, which is why we continue to believe the Nasdaq offers the highest probability of a meaningful bounce if markets stabilize.
The breadth data reinforces this view. The Nasdaq currently has the highest percentage of stocks trading above their 20-, 50-, and 200-day moving averages, which clearly signals relative strength compared to the rest of the market.
We are definitely not out of the woods yet, but yesterday’s move was a very constructive step in the right direction.
S&P 400 Midcap
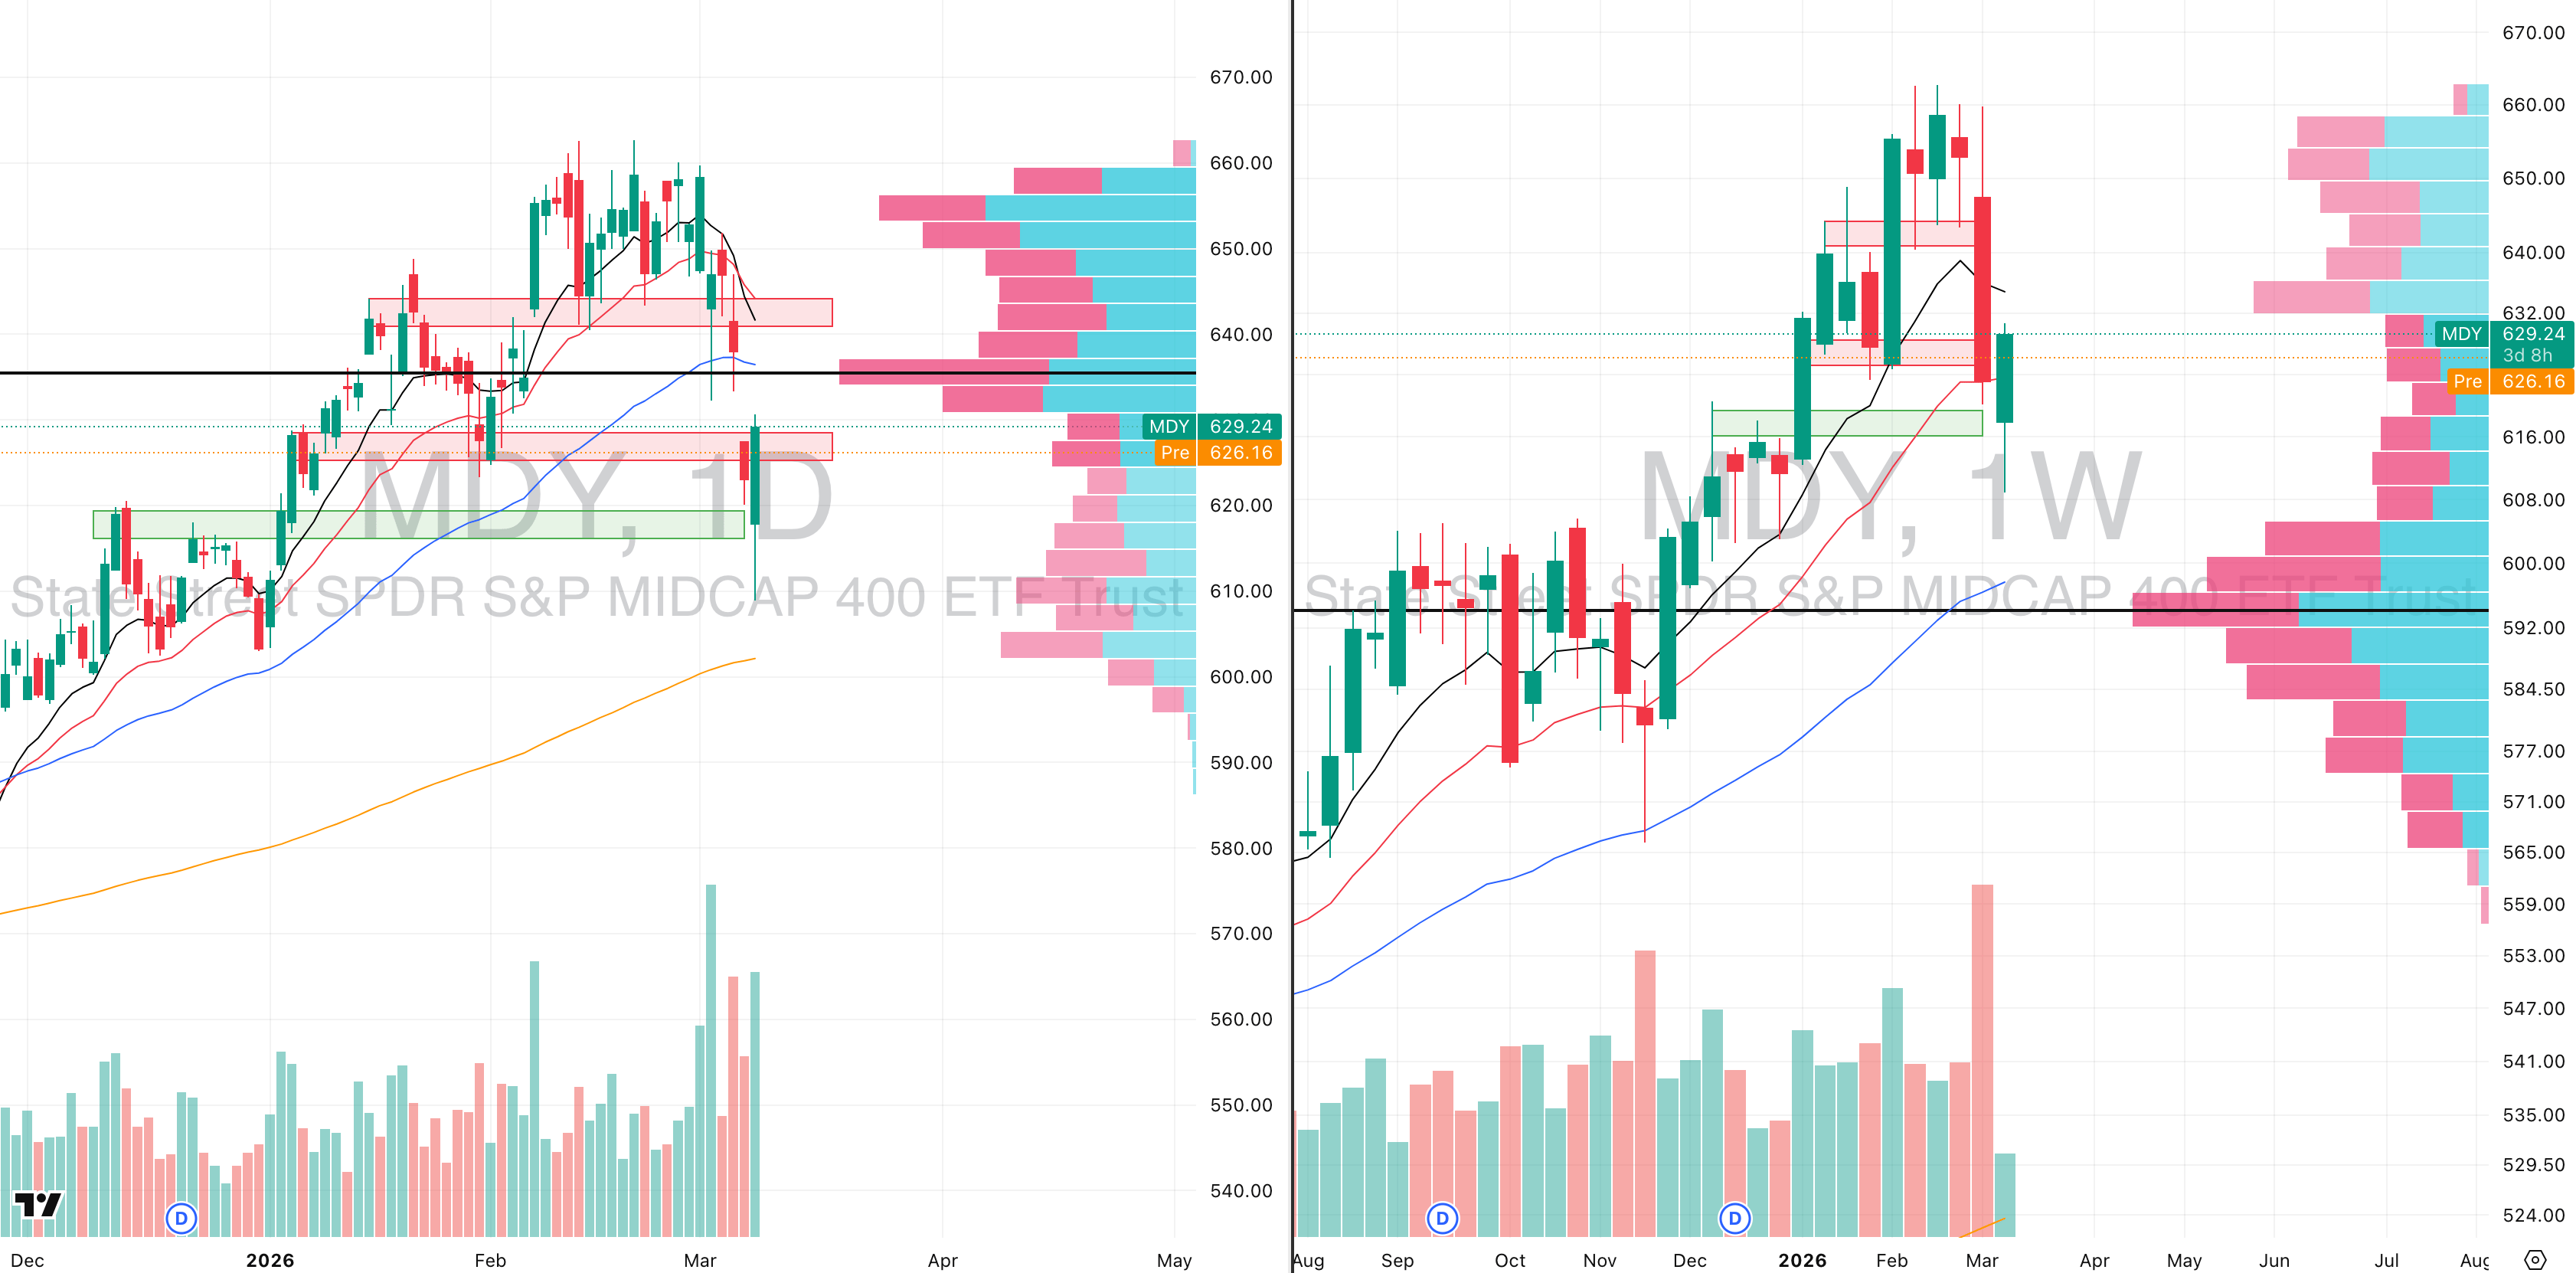
MDY VRVP Daily & Weekly Chart
26.75%: over 20 EMA | 33.25%: over 50 EMA | 54.25%: over 200 EMA
The midcaps also saw a very powerful rebound, with the MDY trading on roughly 200% relative volume, which is particularly notable given the already elevated trading activity over the past several weeks.
The intraday range reached 3.5%, which is approximately 2× the ETF’s 20-day average daily range, highlighting just how aggressive the bounce was.
Importantly, the move occurred directly off the rising 10-month moving average near $607, which is a key long-term support level that tends to hold during healthy market pullbacks.
This morning we are seeing a small retracement in premarket, which is not concerning. In fact, the priority now is not immediate upside follow-through.
What we ideally want to see is an inside session and some contraction in price, allowing the market to begin forming a base. Sustainable recoveries almost always begin with volatility compression and acceptance at support, rather than immediate continuation higher.
This is especially important for the midcaps because breadth within this segment has been hit the hardest, meaning the group needs time to stabilize before it can participate in a larger rally.
Russell 2000

IWM VRVP Daily & Weekly Chart
31.49%: over 20 EMA | 35.71%: over 50 EMA | 53.80%: over 200 EMA
Small caps followed a very similar pattern, retracing down toward $245, which coincides with the rising 10-month moving average, just as we saw in the midcaps.
Yesterday’s intraday range reached 4.13%, which is also roughly 2× the 20-day average daily range, reflecting the same type of volatility spike that occurred across the broader market.
The analysis here is largely identical to the midcaps. After such a sharp move, the focus now should be on seeing contraction and an inside session develop.
That type of price action would indicate the market is absorbing supply and stabilizing, which is a necessary step before any sustained recovery can begin.
FOCUSED STOCK
PSLV: A Big Move in Silver is Brewing

PSLV VRVP Daily & Weekly Chart
ADR%: 4.62% | Off 52-week high: -26.2% | Above 52-week low: +182.1%
Our focused stock today is PSLV, the Sprott Physical Silver Trust, which currently trades around $28.13 and is showing very strong relative strength versus the broader market, with a relative strength rating of 98 against the S&P 500.
PSLV is particularly interesting because it is currently forming a very tight contraction pattern directly on top of both the rising 50-day moving average and the rising 10-week moving average. These two levels are acting as structural support while volatility in the trust continues to compress.
This type of contraction often precedes expansion, especially when it occurs within a broader uptrend. In this case, the setup aligns closely with what we are seeing in the precious metals complex more broadly.
Both gold and silver appear to be stabilizing after their recent pullbacks, and the structure in the metals themselves suggests they may be preparing for another push higher. Silver in particular tends to lead or front-run gold during periods of renewed momentum, which is why vehicles like PSLV become particularly interesting during these consolidation phases.
Another important factor with gold and silver exposures is how difficult they are to buy on breakout highs. Because precious metals trade overnight and across global markets, breakouts often occur outside regular trading hours. By the time U.S. markets open, prices frequently gap higher or lower, which creates much more erratic price action and makes entries far more difficult.
For that reason, the best opportunities to build exposure in precious metals often occur during pullbacks and consolidation phases, exactly like the one we are currently seeing.
With silver holding support, volatility contracting, and relative strength remaining extremely high, PSLV is one of the cleaner vehicles to watch if the precious metals complex begins its next expansion higher.

Did you find value in today's publication?This helps us better design our content for our readers |
Reply