- Swingly
- Posts
- Why You Should Not Trade Today
Why You Should Not Trade Today
In partnership with


MARKET ANALYSIS
What You Need To Know

Fed cut is expected; forward guidance is the real catalyst. Roughly ~90% odds are priced for a December cut. The market’s focus is shifting to whether the Fed signals continued easing into 2026 or frames this as a one-off, insurance-style cut. That distinction will matter far more for trend continuation than the cut itself.
Bond market remains the constraint. Despite easing expectations, 10Y yields remain elevated relative to where prior rate-cut cycles typically saw them. That keeps pressure on duration-sensitive assets and explains why rallies have been selective rather than broad and explosive.
Nvidia / semis remain the tactical swing factor. Trump approving limited Nvidia H200 chip sales to China is supportive at the margin, but more important is what we’ve already observed: semiconductors continue to dictate short-term risk appetite. When semis bid, indices stabilize. When they stall, the tape loses oxygen (leading semi;s to track: MU, AVGO, NVDA & TSM)
Policy uncertainty is rising into 2026. Public pressure around Fed leadership and rate policy is increasing. That does not impact today’s trade, but it does raise medium-term volatility risk as credibility, independence, and inflation control narratives collide. Markets are not pricing that yet.
Economic data visibility is still impaired. Delayed labor data (JOLTS, jobs prints) means the Fed and markets are operating with imperfect information. That favors caution, range trading, and selective exposure over aggressive trend-chasing ahead of confirmation.
Energy and commodities are diverging. Oil and nat gas weakness reflects oversupply and demand uncertainty, while precious metals remain structurally supported by rate expectations and positioning.
Nasdaq

QQQ VRVP Daily & Weekly Chart
63.36%: over 20 EMA | 49.50%: over 50 EMA | 57.42%: over 200 EMA
Price rejected the 629 supply zone, which also marked Friday’s high — fully expected given how extended price was into that level.
The pullback stalled cleanly into 621–623, a zone that flipped from supply to demand on Dec 2 and remains structurally intact.
This area matters because the VRVP shows dominant green volume (≈11.6%) vs red (≈7.7%), confirming absorption, not liquidation.
Buyers defending this zone are not underwater, which materially reduces the probability of a deeper breakdown.
Price remains well above the rising 10-day EMA, with only ~0.9% downside to that level if tested.
Relative volume was muted (~74% of 20-day avg), which is normal and constructive heading into FOMC.
Lack of volume here is information: market is withholding commitment, not distributing risk.
A shallow drift toward the 10-day EMA is acceptable and healthy.
Any volatility ahead of FOMC should be evaluated on the close, not intraday.
Elevated volume without downside follow-through would likely signal liquidity sweep, not trend failure.
S&P 400 Midcap

MDY VRVP Daily & Weekly Chart
64.83%: over 20 EMA | 52.61%: over 50 EMA | 57.10%: over 200 EMA
MDY backed off recent highs following Friday’s gravestone-style rejection — again, expected at this location.
Price briefly slipped through the 604–608 supply band, but importantly held prior session lows, preserving structure.
MDY remains tightly above the rising 10-day EMA, which is the line that matters tactically into FOMC.
This zone is a developing acceptance range, not failed resistance.
Relative volume (~93%) confirms active two-sided trade, not one-way selling.
Sellers appeared at highs, but failed to force range expansion lower.
Consolidation between 600–608 is noise as long as buyers continue absorbing dips.
Resolution is more likely after FOMC, not before.
Compression at highs after strong upside is structurally bullish, not a warning.
Russell 2000

IWM VRVP Daily & Weekly Chart
69.32%: over 20 EMA | 57.17%: over 50 EMA | 61.03%: over 200 EMA
IWM traded into all-time-high territory (252.77) and stalled just beneath — a materially bullish development.
The candle was tight, with no expansion lower, indicating seller exhaustion rather than aggressive rejection.
Demand at 250 held cleanly, reinforcing this as the short-term control level.
Relative volume was light (~71%), which matters: this was not a heavy supply response.
Above 252: ~2.0M green volume vs ~980k red — buyers absorbed supply rather than being forced out.
Failure to hold 250 opens a path toward the rising 10-day EMA (~–1.5%), where volume density increases.
As long as 250 holds, contraction near highs favors continuation, not reversal.
This is materially different from high-volume failure candles that take out prior lows — that is not happening here.
7 Ways to Take Control of Your Legacy

Planning your estate might not sound like the most exciting thing on your to-do list, but trust us, it’s worth it. And with The Investor’s Guide to Estate Planning, preparing isn’t as daunting as it may seem.
Inside, you’ll find {straightforward advice} on tackling key documents to clearly spell out your wishes.
Plus, there’s help for having those all-important family conversations about your financial legacy to make sure everyone’s on the same page (and avoid negative future surprises).
Why leave things to chance when you can take control? Explore ways to start, review or refine your estate plan today with The Investor’s Guide to Estate Planning.
FOCUSED STOCK
MSFT: Double Bottom, Or Bear Flag?

MSFT VRVP Daily & Weekly Chart
ADR%: 2.00% | Off 52-week high: -11.3% | Above 52-week low: +43.2%
MSFT remains one of the most systemically important stocks in the market (~$3.6T market cap).
When Microsoft resolves, it tends to resolve with broader risk appetite, not against it.
This makes it a critical tell for big-tech and growth continuation post-FOMC.
MSFT is carving out a clear double bottom on the daily:
First low: Nov 21–25
Second low: Dec 3–4
Both lows formed directly off the 200-day EMA (~479) — a level that also aligns with the rising 50-week EMA.
This is the first meaningful test of that long-term confluence since the April capitulation.
Key levels
Upside validation comes on a decisive push above 494.4.
Above that level, the double bottom resolves and momentum opens back up.
Below the 200-day / 50-week confluence, the structure fails.
Weekly context (important nuance)
On the intermediate timeframe, this can still be interpreted as a bear flag.
That does not invalidate the daily double bottom.
The distinction is simple:
Hold above the 50-week → reversal thesis stays alive
Lose the 50-week → bear flag resolves lower
Why we’re watching it closely
Microsoft was a prior leader that already fulfilled its downside target from the July–October double top.
What it does now matters more than what it already did.
If MSFT tightens and pushes higher on volume post-FOMC, that’s strong evidence institutions are still allocating into mega-cap growth.
If it fails here, weakness is unlikely to remain isolated.
FOCUSED GROUP
BLOK: Crypto Stocks Heating Up
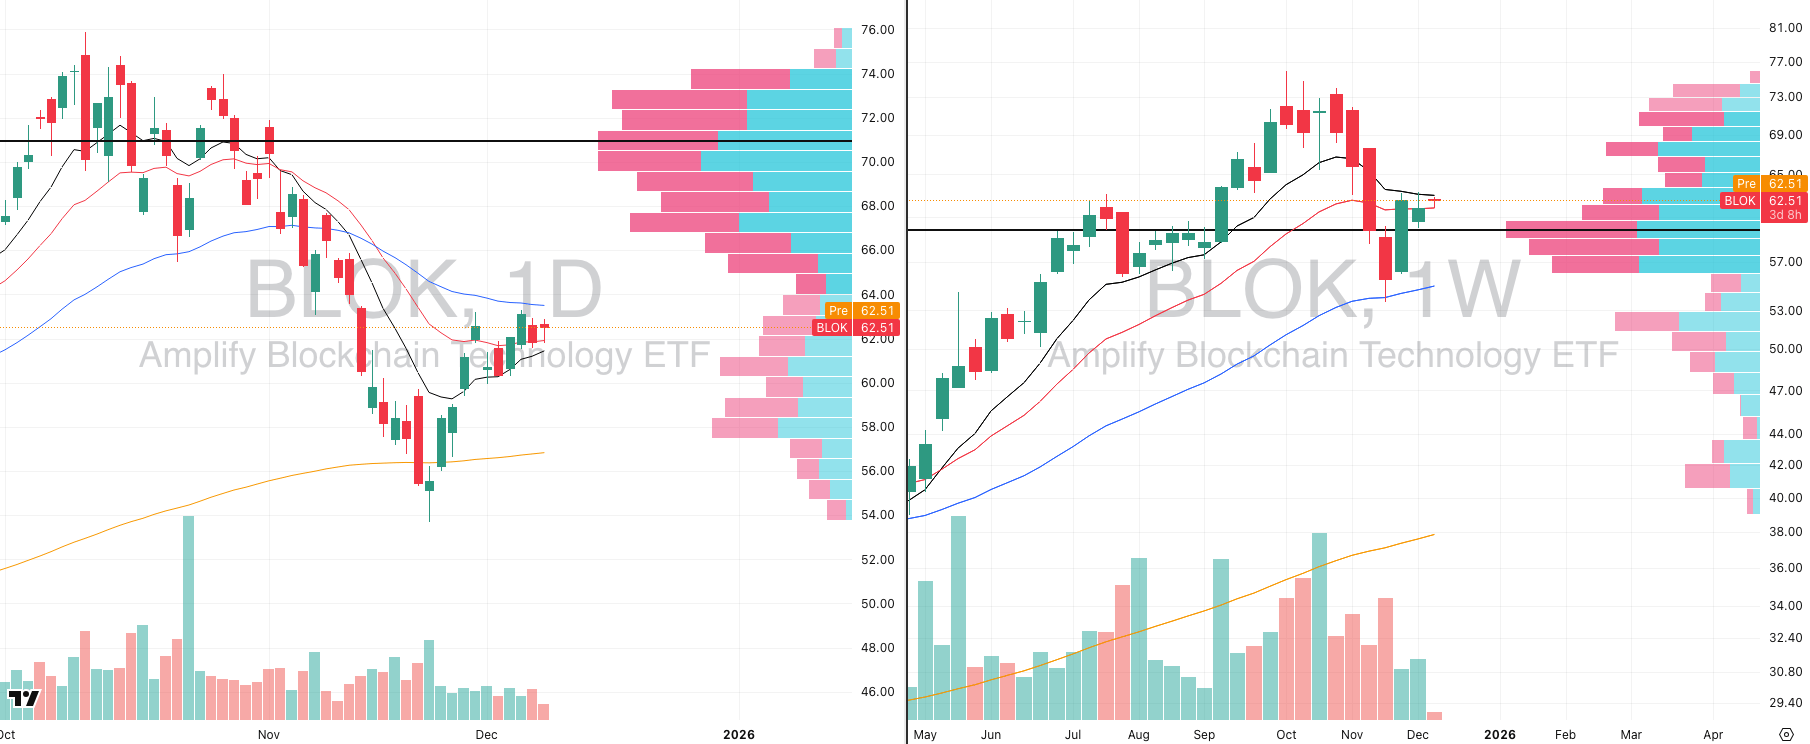
BLOK VRVP Daily & Weekly Chart
Crypto-linked equities remain one of the most reflexive risk-on expressions in the market.
When they move, they do so with intent whether it’s up or down and BLOK gives clean exposure to that behavior without needing to trade spot crypto.
We saw a strong rally from Nov 21 into early December.
Pullback stalled at:
The now-rising 20-week EMA (~61.6)
After rejecting the flattened 10-week EMA (~63.3)
What’s developing
Price is forming a volatility contraction:
Higher lows since Nov 26
Flat to slightly descending highs
Declining volume through the range
This is classic compression ahead of expansion.
Asymmetry (this is the key)
Downside failure:
Loss of ~61.5 opens a clean move toward ~56.7
~-8% downside, technically obvious
Upside resolution:
Break back above the short-term averages (~63.6)
Opens a push toward the POC near 69
~+9% upside
Why this setup is clean
Defined risk on both sides
No need to predict direction
Let price choose, then respond
How it fits the bigger picture
If BLOK resolves higher alongside MSFT stabilizing and tech holding firm, that reinforces risk-on continuation.
If BLOK breaks down while large-cap tech stalls, that’s an early warning that speculative risk is being pulled.
Compression + declining volume = opportunity approaching.
We stay flexible, react to confirmation, and avoid forcing bias.

Did you find value in today's publication?This helps us better design our content for our readers |
Reply