- Swingly
- Posts
- Why We Expect A Rally Next Week
Why We Expect A Rally Next Week
In partnership with
OVERVIEW
What You Need To Know
Macro
CME outage froze futures overnight, creating thin + distorted macro liquidity ahead of an early close.
Markets still pricing 80%+ odds of a December rate cut, keeping a bid under risk assets.
November remains negative for all major indices, with megacap tech the main drag; small/mid caps leading on breadth.
GOOG + NVDA stabilising, with rotation into non-megacap tech still the dominant theme.
Nasdaq (QQQ)
Four-day bounce off 20-week EMA, but volume collapsing (only ~70% RVOL).
Relief rally is clean technically but not broadly sponsored, leaving bull-trap risk elevated.
Nasdaq breadth still lags small/mid caps — leadership not coming from megacap tech.
S&P 400 Midcap (MDY)
Continues to outperform Nasdaq with healthier, broader participation.
Weekly Morning Star reversal printed at rising 20-week EMA — a high-probability trend reversal structure.
Needs to clear 600–607 supply shelf to confirm continuation.
Russell 2000 (IWM)
Clean weekly Morning Star directly on 20-week EMA — strongest reversal of the indices.
Pushing toward 250 supply; after four up days, a pullback to 243.70 POC would be normal and constructive.
Retest → hold → rotate higher would set up a multi-week upside leg.
Focused Stock: IONQ
Stabilising on rising 50-week EMA + reclaimed weekly POC — strong long-term demand zone.
Printed a clean Morning Star on the daily + high-volume reclaim of EMAs.
Coiling beneath 49.40–49.50; breakout opens room toward 55–63.
Focused Group: XME
One of the cleanest weekly Morning Stars in the market after a low-volume corrective pullback.
Reclaimed all short-term EMAs in one session — classic strong-group behaviour.
Precious metals + miners showing broad momentum, confirming a sector-wide rotation.

MARKET ANALYSIS
Expect Some Volatility Today
CME froze futures trading overnight after a cooling failure at its data center. Equities, Treasuries, crude, FX futures all halted. Spot equities are fine, but macro liquidity is thinner and a bit distorted.
Fed expectations remain the anchor as markets still pricing 80%+ odds of a December rate cut. Soft delayed data + dovish Fed speak keeping the bid under risk assets.
Despite this week’s rebound, November is still a losing month for all three major indices and megacap tech did the damage, while small/mid caps continue to show clear relative strength.
GOOG and NVDA stabilizing, with rotation into non-megacap tech still the standout trend of the month- GOOG is now the AI leader and the strongest name of the theme (thanks to Gemini).
Oil heading toward a fourth monthly drop ahead of the OPEC+ meeting, though today’s price action was disrupted by the CME outage.
No data, no major earnings, and a 1:00 PM ET early close so expect low liquidity today and likely some more erratic action.
Nasdaq
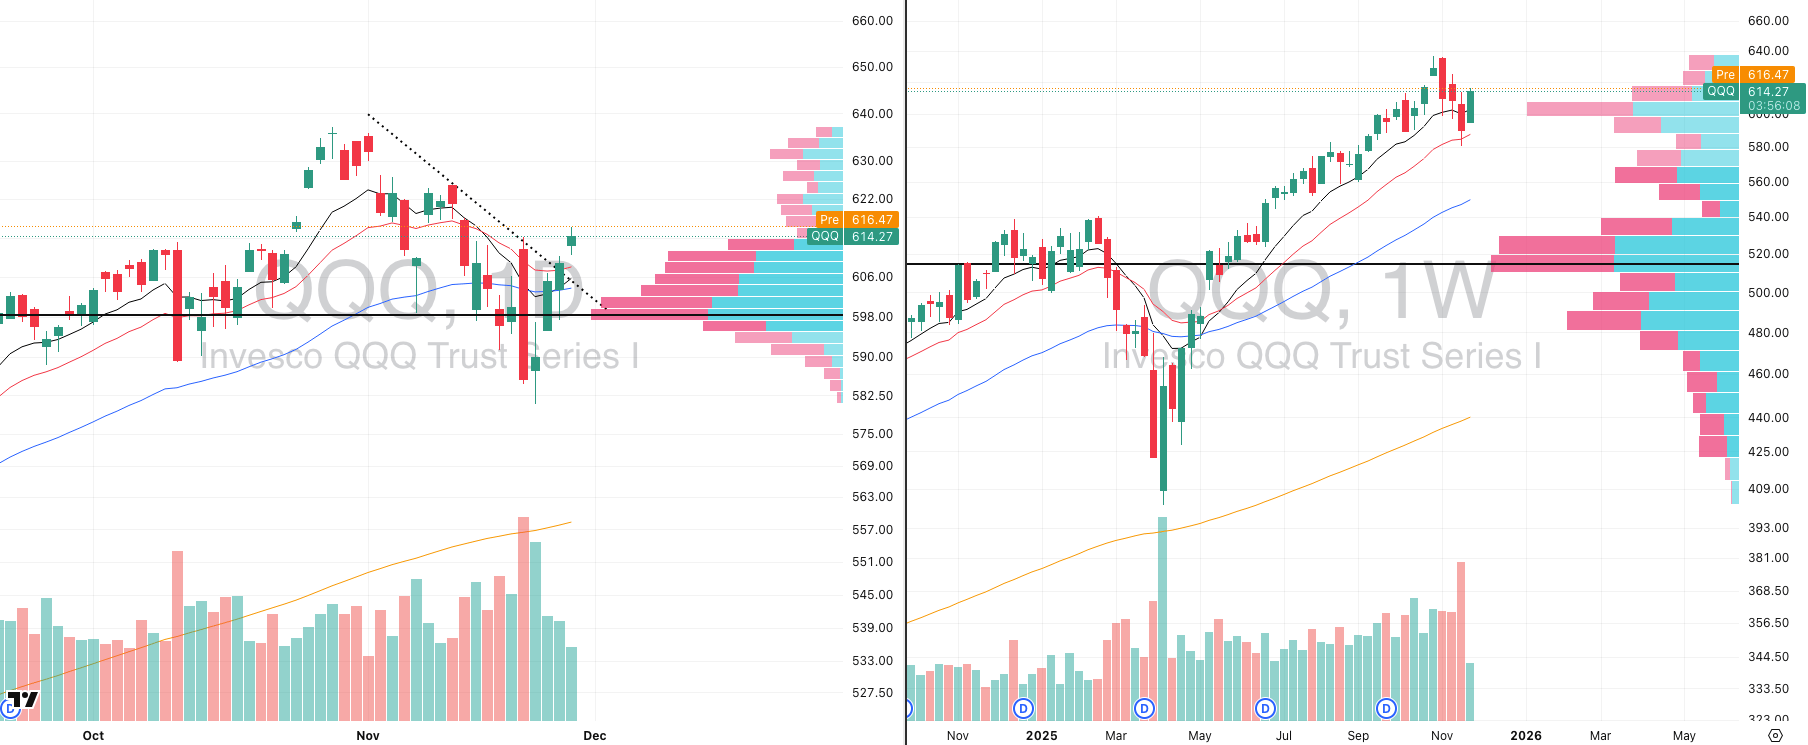
QQQ VRVP Daily & Weekly Chart
53.46%: over 20 EMA | 44.55%: over 50 EMA | 51.48%: over 200 EMA
QQQ has now now logged four consecutive up days off the 20-week EMA bounce at 585 on Friday the 21st and now pushed into a period of very low volume on the VRVP which can accomodate for some sharp price swings.
Volume has deteriorated sharply throughout the rebound.
Wednesday printed just ~70% of 20-day average volume, which is not what you want to see on a relief rally off a key weekly support.
The rally is technically clean, but not broadly sponsored and that does leave any asset vulnerable to a bull trap.
From a character standpoint, this keeps QQQ the weakest of the major U.S. index groups which a a point reinforced by the breadth data (see above),
Short-term breadth is improving (stocks reclaiming short EMAs), but Nasdaq breadth continues to lag both the S&P 400 and Russell 2000, confirming that leadership is not coming from megacap tech.
S&P 400 Midcap
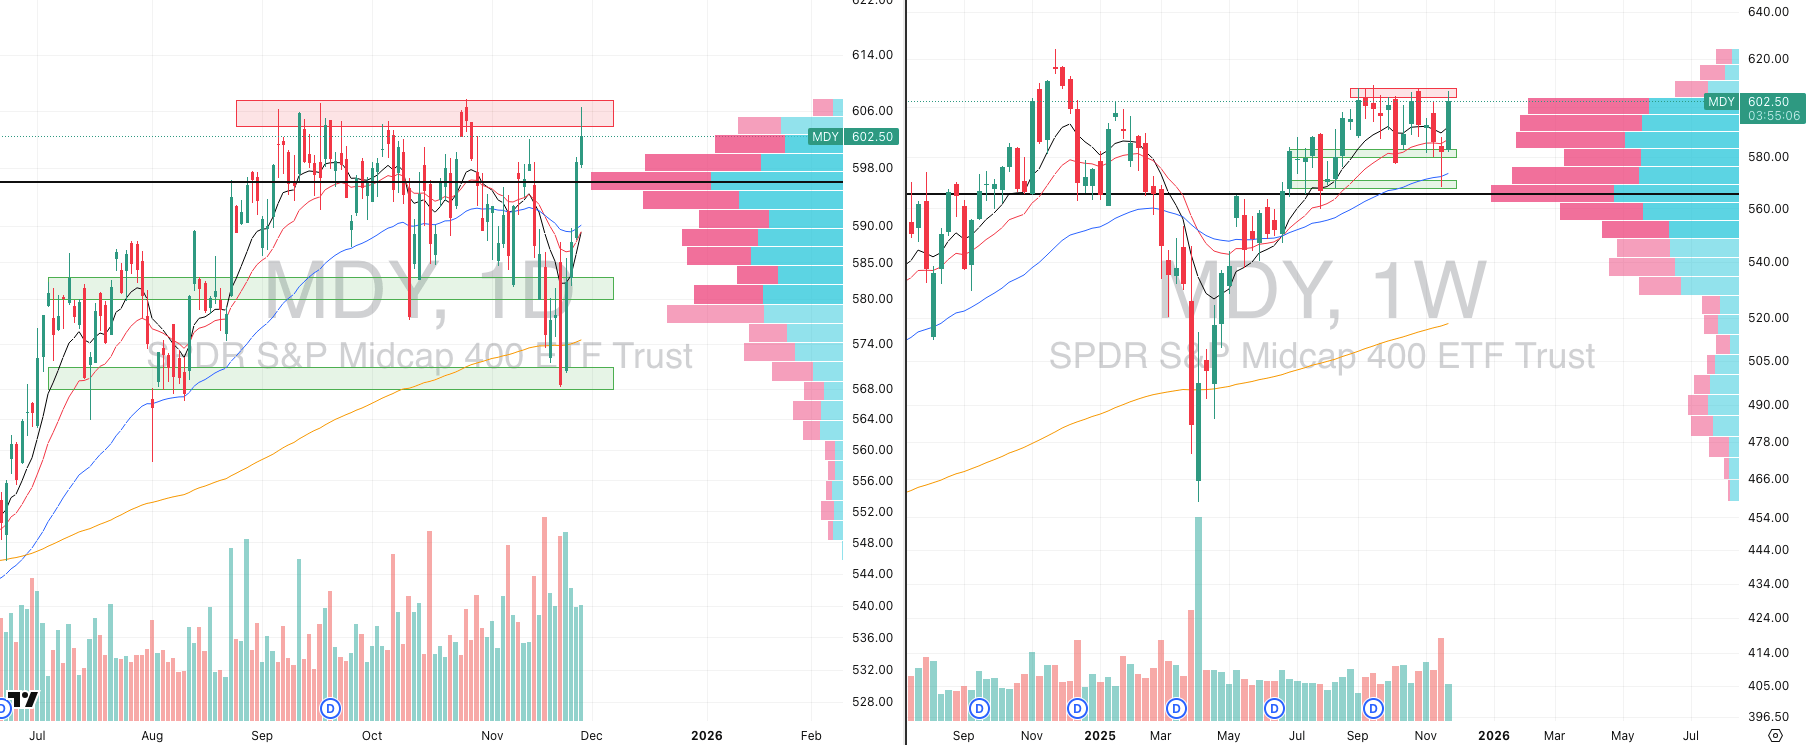
MDY VRVP Daily & Weekly Chart
74.50%: over 20 EMA | 54.00%: over 50 EMA | 57.00%: over 200 EMA
MDY continues to outperform the Nasdaq on breadth, which remains one of the most important dynamics in this market. Participation is wider, healthier, and far more consistent here than in megacap tech.
Relative volume has been slightly stronger than QQQ, though it has begun to fade as price pushed higher over the last four sessions. Wednesday’s late-day selling confirms supply sitting between 600–607, which aligns with the VRVP overhang.
The key development is on the weekly timeframe:
MDY has now put in a clean Morning Star reversal across the past three weeks.Week of Nov 10: sharp flush to 580, strong rejection.
Following week: gap down to 569, buyers immediately reversed the move on high relative volume.
This week: price trading well above the midpoint of the initial flush candle.
Morning Star formations on weekly charts are high-probability trend reversal signals, and MDY has printed one at the exact level where buyers have repeatedly defended the rising 20-week structure.
Taken together, this gives us elevated confidence that mid-caps are positioning for a continuation to the upside over the next 1–2 weeks, assuming the supply shelf at 600–607 is absorbed.
Russell 2000
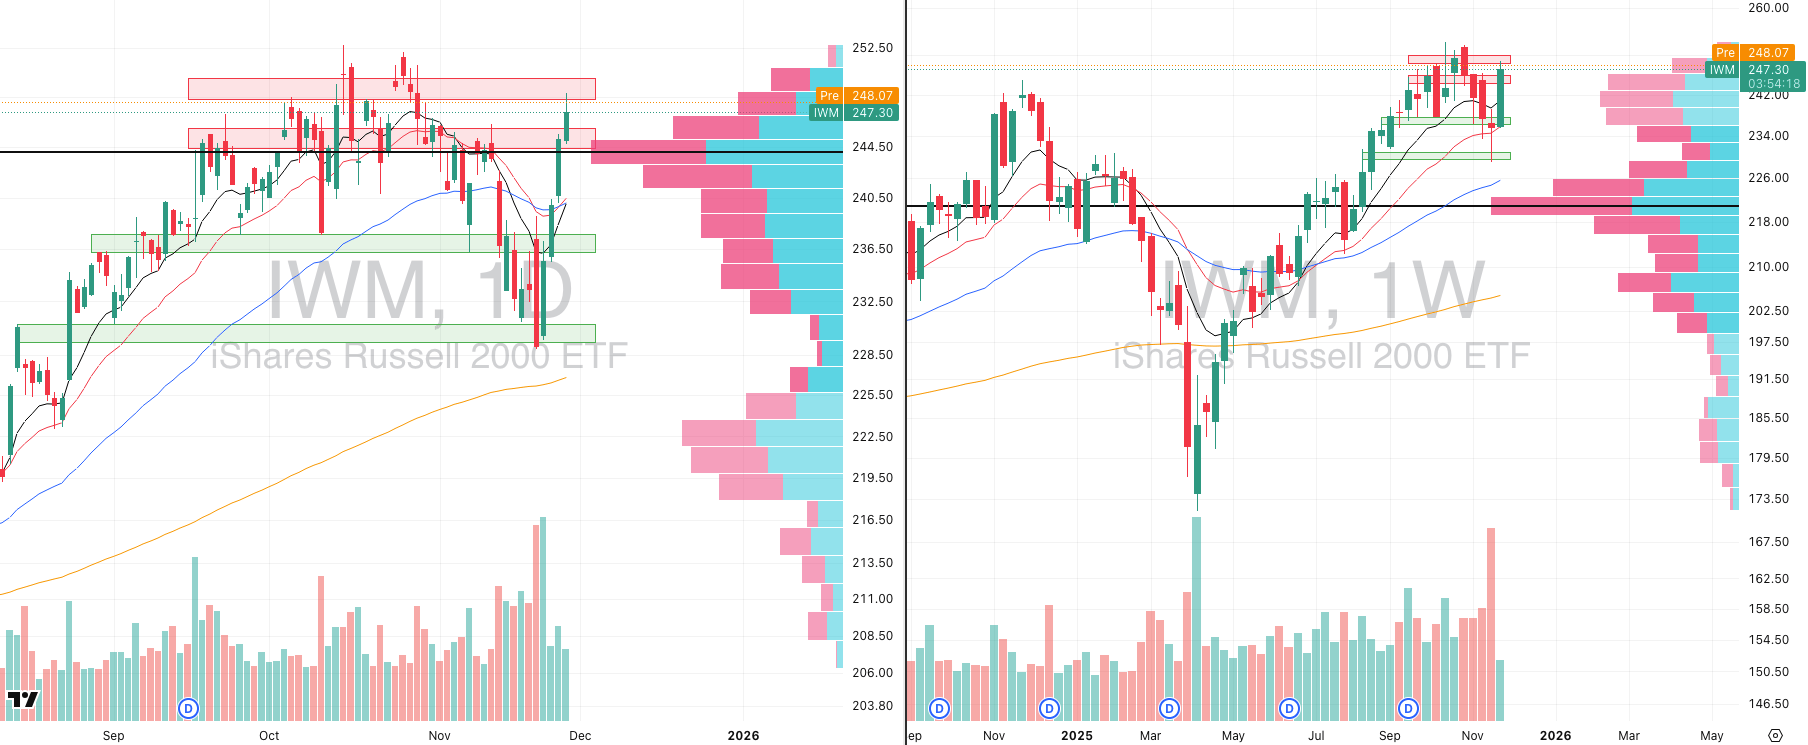
IWM VRVP Daily & Weekly Chart
69.05%: over 20 EMA | 54.11%: over 50 EMA | 58.54%: over 200 EMA
Small caps have also printed a Morning Star reversal on the weekly timeframe - arguably cleaner and stronger than MDY’s. The pattern formed directly on the rising 20-week EMA, giving the setup real technical weight.
Price has now rallied four sessions straight off Monday’s open, pushing firmly off the Morning Star pivot. The move has been orderly and broad-based, backed by improving breadth across all small-cap groups.
Overhead, IWM still needs to chew through supply up toward 250, which lines up with the prior multi-month distribution shelf.
After four consecutive up days, some form of pause/pullback is likely. A drift back toward 243.70 — the daily POC — would be completely normal and constructive.
Importantly, a pullback into that level isn’t bearish; that zone overlaps the prior supply block (the red band on your chart), which now has the potential to act as support-turned-demand.
A successful retest and rotation higher would be the ideal scenario and would position IWM for what looks increasingly like a multi-week upside resolution, supported by the Morning Star patterns we’re seeing across the board.
The Smartest Free Crypto Event You’ll Join This Year

Curious about crypto but still feeling stuck scrolling endless threads? People who get in early aren’t just lucky—they understand the why, when, and how of crypto.
Join our free 3‑day virtual summit and meet the crypto experts who can help you build out your portfolio. You’ll walk away with smart, actionable insights from analysts, developers, and seasoned crypto investors who’ve created fortunes using smart strategies and deep research.
No hype. No FOMO. Just the clear steps you need to move from intrigued to informed about crypto.
FOCUSED STOCK
IONQ: Going Big on Quantum
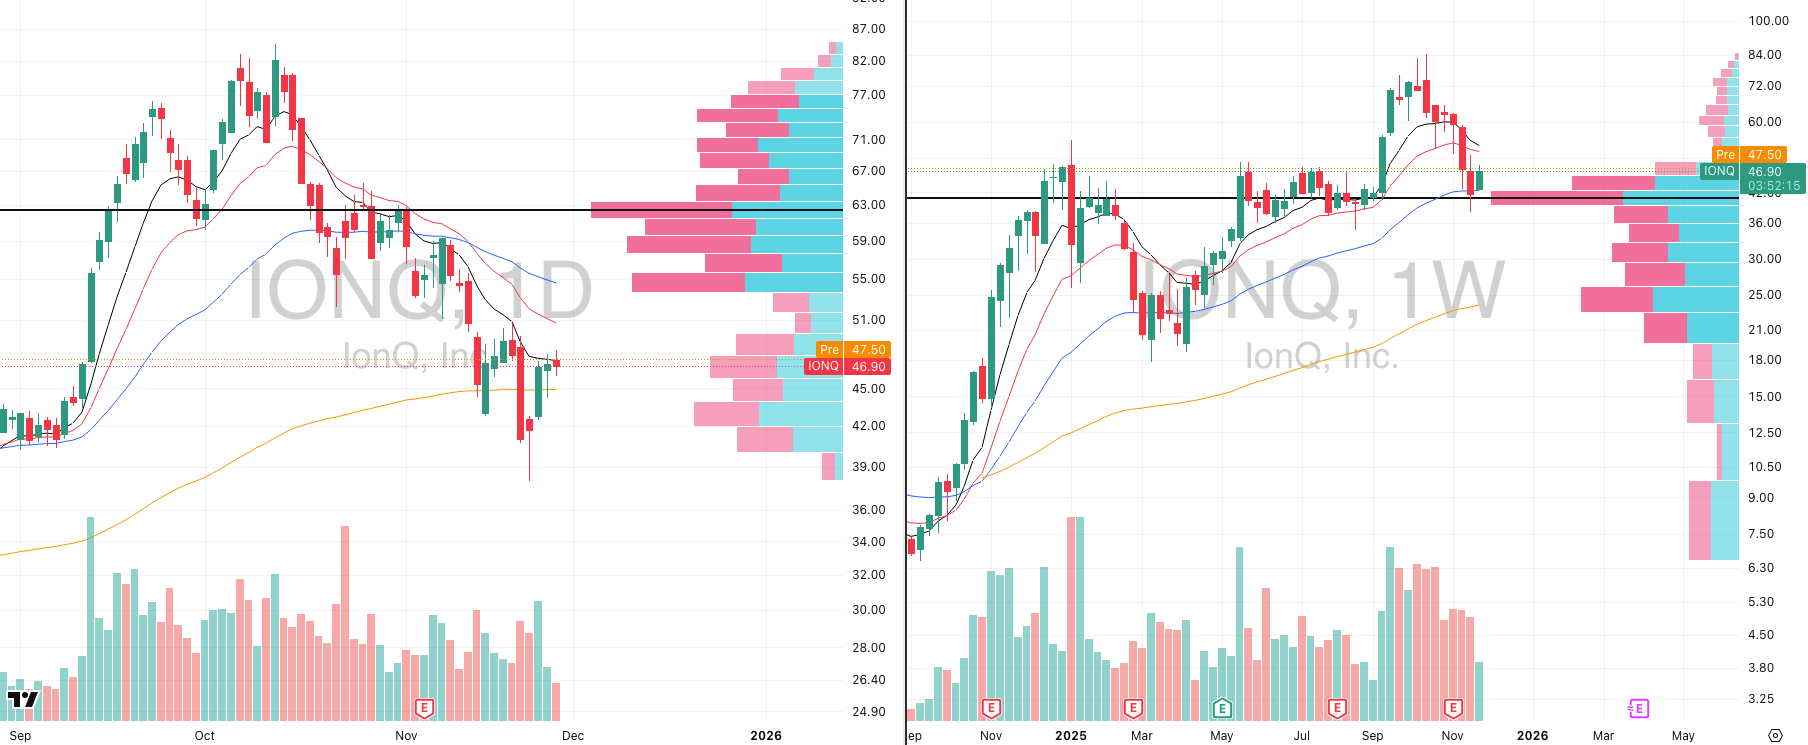
IONQ VRVP Daily & Weekly Chart
ADR%: 3.41% | Off 52-week high: -34% | Above 52-week low: +77.1%
IONQ is one of the highest-beta names within quantum computing and is starting to turn a key corner technically.
After several weeks of declining relative volume during the corrective phase, IONQ has now stabilised directly on its rising 50-week EMA — a level it has not violated on a closing basis since early 2024.
That weekly bounce also reclaimed the weekly Point of Control, a meaningful reference given how much historical demand sits at this band dating back to December 2024. This is the same zone that acted as major supply during the prior intermediate-term trend.
On the daily chart, the stock has carved out a clean Morning Star formation between Thursday (Nov 23) and Monday (Nov 24). Monday’s session saw high relative volume and a decisive reclaim of short-term moving averages.
Price action has since tightened, with a clear contraction range forming beneath 49.40–49.50. A breakout through this level would signal the start of a new cycle leg, with room into the 55–63 supply pocket.
The broader quantum group is beginning to wake up as well, and IONQ remains one of the stronger structural candidates for pullback-long setups as we move into December.
FOCUSED GROUP
XME: Precious Metals Are Breaking Out
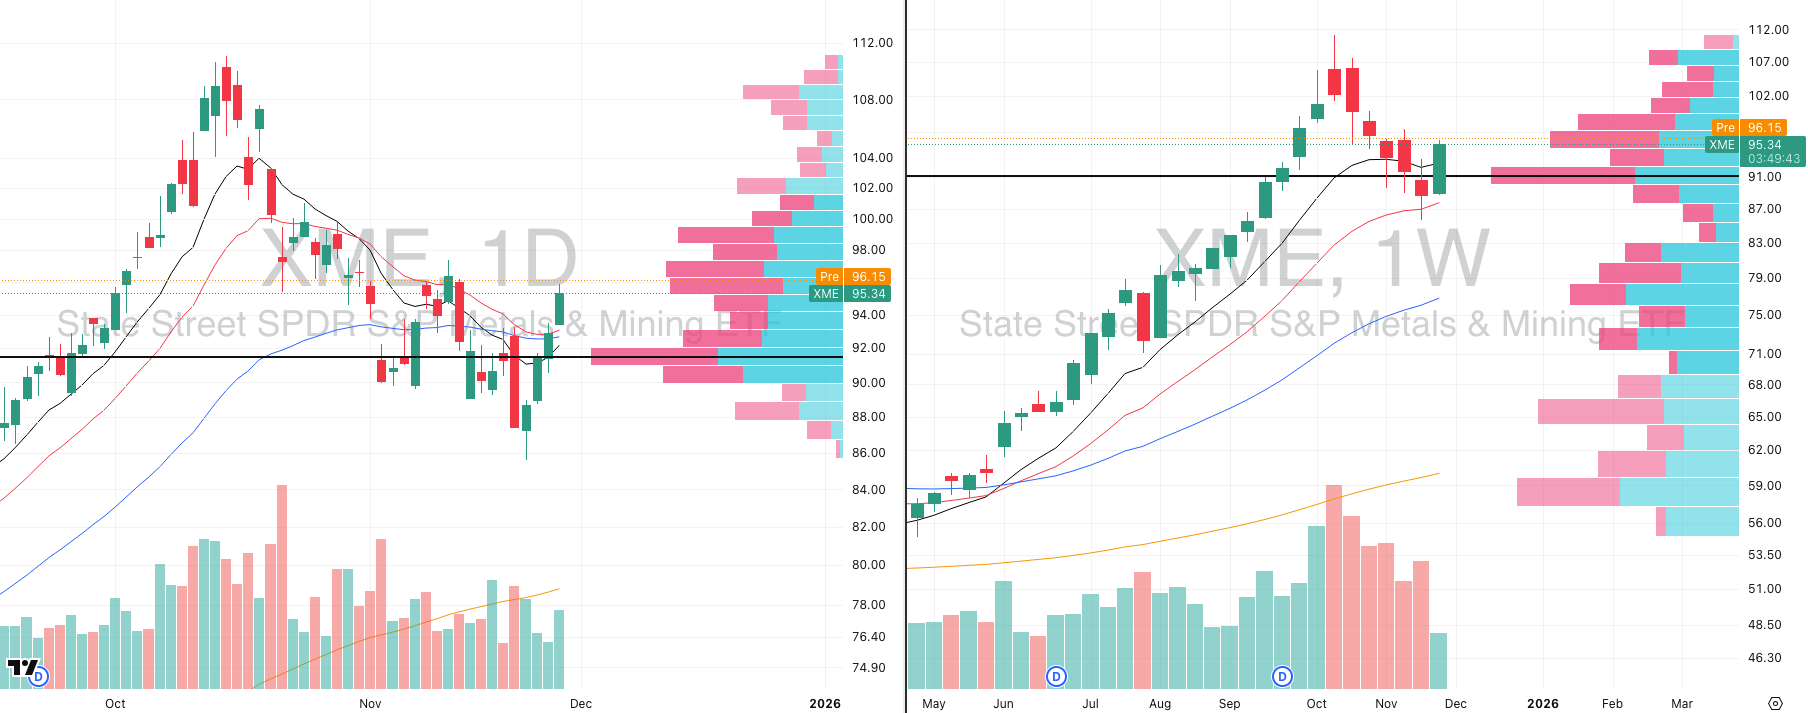
XME VRVP Daily & Weekly Chart
XME has printed one of the cleanest weekly Morning Star reversals in the entire market, and unlike many indices, the pattern formed after a controlled, low-volume pullback — exactly what you want to see before a trend continuation.
The October–November decline was non-threatening: price bled lower, but volume collapsed, confirming the move was corrective rather than distributional. There was zero evidence of funds exiting the group.
The ETF briefly undercut and tested the 20-week EMA, flushed weak hands, and immediately reversed — that reclaim is often the start of the next leg in a strong commodities cycle.
Wednesday’s session matters as XME took back the entire short-term EMA stack (10/20/50-day) in one move. That’s what strong groups do when sellers lose control.
VRVP shows price has moved back above the primary demand shelf around 91–93, meaning the market absorbed the pullback and is now rotating capital back into the space.
Internally, the group is lit: gold, silver, and steel names are showing fresh momentum, with miners particularly dominant in breadth scans.

Did you find value in today's publication?This helps us better design our content for our readers |
Reply