- Swingly
- Posts
- Why We Are Starting To Get Bullish
Why We Are Starting To Get Bullish
In partnership with


MARKET ANALYSIS
Here’s What You Need To Know

Futures are marginally higher this morning, but the bigger takeaway is not the uptick itself but the fact that the market is holding last week’s rebound without immediate giveback, which matters a lot after the kind of volatility we just saw.
The Dow continues to hover near fresh all-time highs, while the S&P 500 and Nasdaq are grinding higher rather than expanding aggressively, reinforcing the idea that this is acceptance and digestion which is amazing to see.
Yesterday’s follow-through in tech is important given after the software-led unwind last week, the market needed to prove that buyers would step back in and so far, they have, albeit selectively.
This week now becomes more about confirmation than momentum, with retail sales, the delayed jobs report, and CPI all clustered together. The market is extremely sensitive here because expectations are already fragile.
Last week’s data hinted at a softening labor backdrop, and the risk is not “bad data” per se, it’s data that forces the market to reprice growth expectations too quickly.
Earnings are more of a background variable today rather than a driver. What matters more is whether capital continues rotating within equities rather than exiting them, which so far appears to be the case.
Globally, there’s no confirmation of a broader risk-off move. Asia pushed higher overnight, led by Japan, and that matters because global equities are not validating a bearish macro narrative right now.
Crypto and commodities are still stabilizing after last week’s extremes, and the lack of immediate follow-through in either direction suggests fear has cooled.
Net-net, the macro picture supports continuation, but not complacency. This still feels like a market that wants to work higher but needs data to cooperate as a catalyst.
Nasdaq

QQQ VRVP Daily & Weekly Chart

QQQE VRVP Daily & Weekly Chart
46.53%: over 20 EMA | 52.47%: over 50 EMA | 49.50%: over 200 EMA
The QQQ continued its recovery attempt yesterday, but it is important to contextualize that the advance occurred on muted relative volume, roughly 100% of the 20-day average, which remains materially lower than the elevated volume observed during the sell-off between February 3rd and February 5th.
Despite the lack of volume expansion, price action itself was constructive, as QQQ opened directly into the 20-week EMA near 605, tested that level early in the session, and found immediate demand, signaling that higher-timeframe buyers are still defending this intermediary trend support.
The internal volume distribution on that test was particularly encouraging, with approximately 8.2 million shares traded on upticks versus only 5.3 million on downticks, a clear indication that dip buyers remain active at this level despite broader uncertainty.
While there is still substantial overhead supply from the January distribution zone, and follow-through may remain choppy, this is the first time in several weeks that the NASDAQ has shown credible signs of stabilization rather than continued acceleration lower.
When stripping out mega-cap distortion, the QQQE tells a similar but arguably more important story, as it too reclaimed and held above its 20-week EMA, a level that historically defines whether growth participation is contracting or stabilizing.
Relative volume in QQQE remains subdued, which is not surprising given the ETF’s lower liquidity, but structurally this mirrors the November 2025 fractal, where an undercut of the 20-week EMA was followed by a reclaim and multi-week consolidation before trend continuation.
The key takeaway is not short-term momentum, but price acceptance above a critical weekly moving average, suggesting that selling pressure beneath the surface of the NASDAQ is no longer expanding.
This reinforces the view that growth is no longer deteriorating uniformly, and that leadership is likely to re-emerge selectively rather than through broad index strength.
S&P 400 Midcap

MDY VRVP Daily & Weekly Chart
65.07%: over 20 EMA | 70.85%: over 50 EMA | 70.85%: over 200 EMA
MDY remains the strongest capitalization segment, though it is increasingly extended in the short term, currently trading near four ATR multiples above its 50-day EMA, a level where upside asymmetry naturally begins to compress.
Yesterday’s session was an inside day with relatively low volume at roughly 80% of average, but the internal volume profile continued to show persistent dip buying, particularly near the lower end of the session range.
Notably, deeper intraday tests near 646 showed meaningfully higher green volume than red, reinforcing that institutions are still defending pullbacks rather than distributing into strength.
Breadth readings remain elevated, with roughly 65–71% of constituents above their key moving averages, which historically increases the probability of short-term mean reversion, even if the intermediate trend remains intact.
From a tactical standpoint, MDY still represents strength, but risk-reward is no longer as favorable as it was earlier in the move, and rotation rather than continuation should increasingly be expected.
Russell 2000
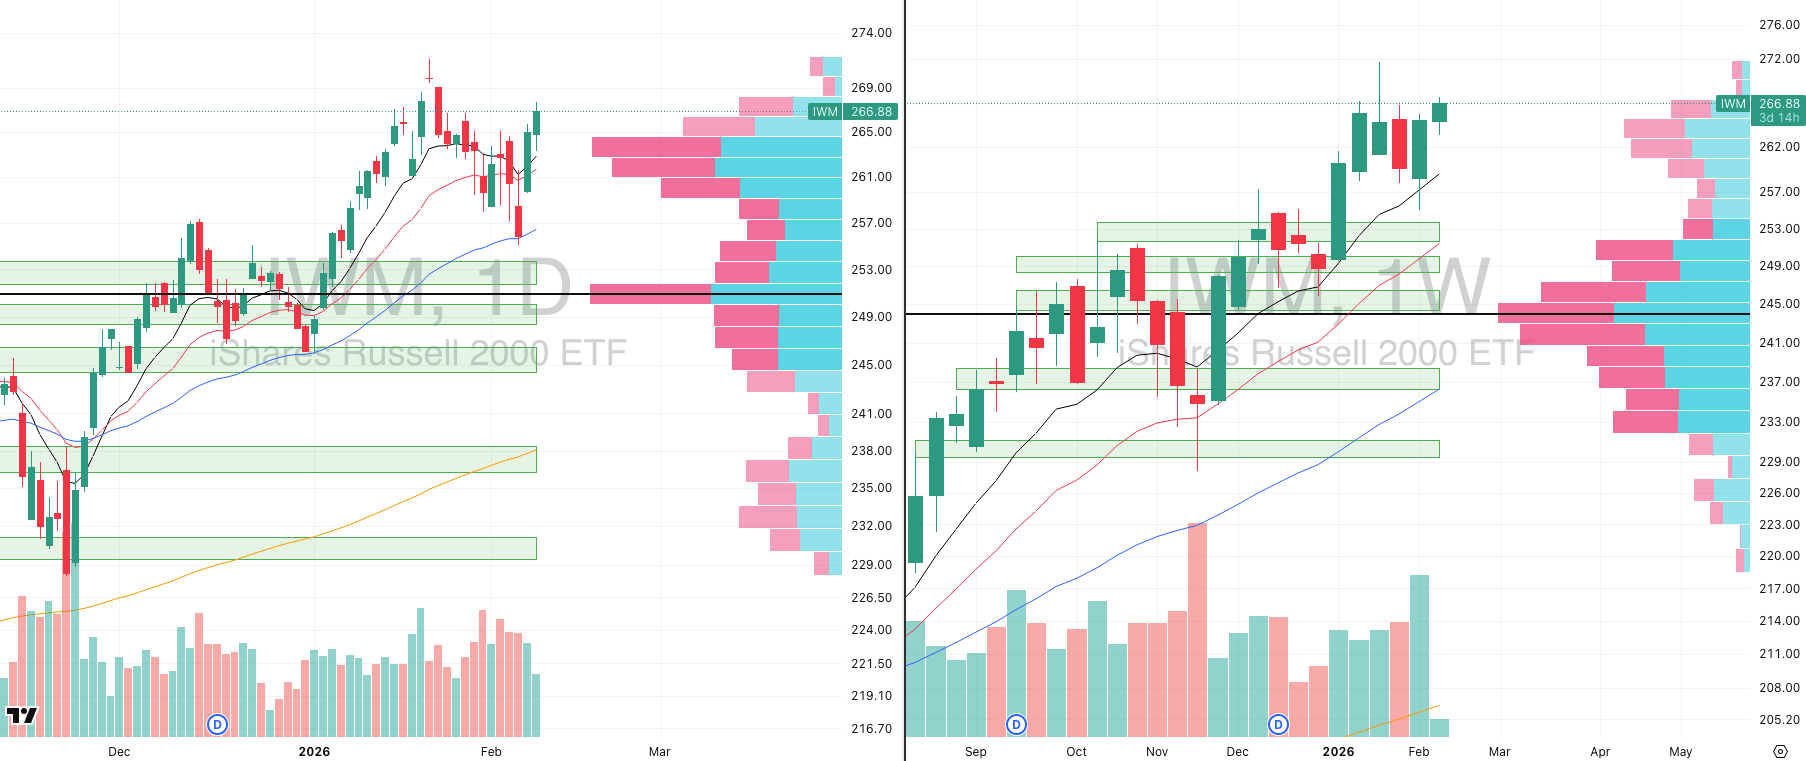
IWM VRVP Daily & Weekly Chart
55.45%: over 20 EMA | 59.85%: over 50 EMA | 65.95%: over 200 EMA
The Russell 2000 continues to lag mid-caps but is quietly improving structurally, having confirmed a valid Morning Star reversal from last week’s sell-off and successfully retested its 10-day EMA before pushing higher.
Relative volume has not expanded meaningfully, but this is consistent with repair phases, where price stabilizes first before participation broadens.
On the weekly timeframe, IWM continues to hold above its rising 10-week EMA, maintaining its intermediary uptrend despite volatility elsewhere in the market.
Importantly, breadth remains far less extended than mid-caps, with only roughly 50–65% of constituents above their short-term averages, leaving considerably more upside room should rotation continue.
If capital begins rotating out of extended mid-caps, small caps remain one of the most structurally prepared beneficiaries, particularly given their relative lack of crowding and lower positioning risk.
When it all clicks.

Why does business news feel like it’s written for people who already get it?
Morning Brew changes that.
It’s a free newsletter that breaks down what’s going on in business, finance, and tech — clearly, quickly, and with enough personality to keep things interesting. The result? You don’t just skim headlines. You actually understand what’s going on.
Try it yourself and join over 4 million professionals reading daily.
FOCUSED STOCK
IREN: Why We Are Bullish on Crypto Again

IREN VRVP Daily & Weekly Chart
ADR%: 12.16% | Off 52-week high: -40% | Above 52-week low: +800.5%
IREN continues to stand out as the cleanest, highest-quality equity expression of crypto risk at a time when both Bitcoin and Ethereum are testing primary trend support on their weekly and monthly structures, rather than breaking down.
From a technical standpoint, IREN recently tested and held its 200-day moving average, the same level that acted as demand in late December, and price has since stabilized rather than accelerating lower, which is a critical divergence relative to many other high-beta crypto equities.
On the weekly structure, IREN remains in a constructive base, with no violation of its broader trend despite extreme volatility in the underlying crypto assets, reinforcing that selling pressure is being absorbed rather than expanded.
Relative to Bitcoin, which has an average daily range near 6%, IREN trades with an ADR closer to 12%, meaning it offers roughly double the volatility and convexity, while still respecting higher-timeframe structure — an ideal profile for momentum traders.
Importantly, despite Bitcoin’s drawdown toward its 10-month EMA and 200-week EMA, IREN has not experienced equivalent structural damage, signaling relative strength and sponsorship beneath the surface.
From a positioning perspective, Bitcoin and Ethereum have both undergone aggressive liquidation and sentiment resets, while IREN has already digested volatility and compressed, increasing the probability that any stabilization or double-bottom in crypto translates into outsized equity upside.
This is particularly notable given that IREN is coming off a 52-week advance exceeding 800%, yet has not entered a distribution phase on the weekly chart, suggesting this is consolidation within trend, not exhaustion.
Risk management remains paramount given the stock’s volatility, but from a risk-to-reward standpoint, pullbacks into the 200-day EMA / base lows offer a far more asymmetric long setup than chasing Bitcoin directly near inflection points.
If crypto confirms a secondary test or higher low at primary support, IREN is one of the first names likely to respond, given its combination of beta, liquidity, and technical cleanliness.
Did you find value in today's publication?This helps us better design our content for our readers |
Reply