- Swingly
- Posts
- Why We Are Short Semiconductors...
Why We Are Short Semiconductors...


MARKET ANALYSIS
Here’s What You Need To Know

The weakness we are seeing this morning is, in our view, primarily a function of technical overextension rather than genuine deterioration in market character.
Across nearly every major index just a few sessions ago, breadth had reached highly stretched territory, with close to or above 80% of constituents trading above their 20-day EMA.
That level of participation is statistically difficult to sustain without some form of cooling phase, particularly after the velocity of the rally we have seen since late March.
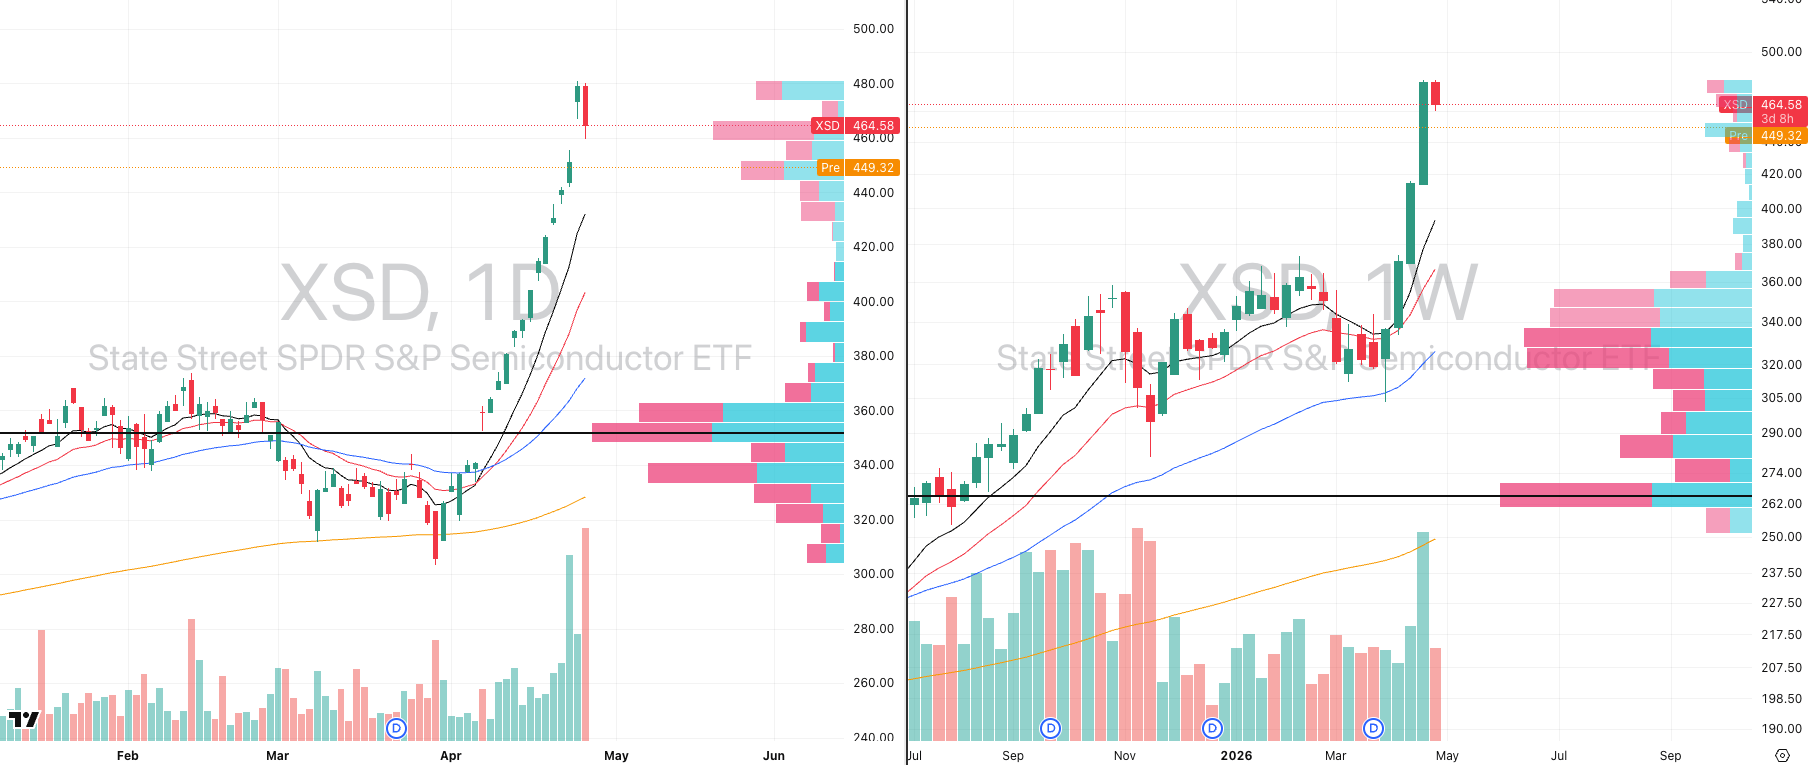
XSD VRVP Daily & Weekly Chart
The clearest pressure point sat exactly where we highlighted it yesterday: semiconductors. XSD had pushed into an extreme 13 ATR multiple extension from its 50-day EMA, which placed the group firmly into parabolic territory.
In yesterday’s premarket report we explicitly framed semiconductors as a parabolic short trade, and that has so far worked exactly as expected. The group was simply too extended to continue vertically without profit-taking, and today’s move lower is that mechanical unwind beginning to play out.
We hope many of you took notice of that setup, because these are the moments where understanding statistical extension matters far more than reacting emotionally to headlines.
When a leading growth group reaches that level of expansion, the first pullback is often not bearish — it is simply mean reversion doing what it always does.
The macro headlines are helping accelerate that unwind, but they are not the primary driver. Oil moving sharply higher, with WTI now above $101 and Brent above $112, adds pressure because it immediately creates sensitivity across growth-heavy areas of the market, especially while investors are already sitting on large short-term gains.
At the same time, renewed uncertainty around Iran negotiations keeps that oil bid alive, which naturally pressures sentiment around technology and duration-sensitive names.
The additional pressure this morning came from the OpenAI revenue miss narrative, which hit AI infrastructure names hard in premarket trade. Nvidia, Broadcom, AMD and Oracle all traded lower after concerns emerged around OpenAI missing internal growth targets and potential pressure on future compute spending.
But importantly, this does not change the structural reality that most of these names were already extremely extended before the headline arrived. The headline simply provided the catalyst for profit-taking.
For now, we still view this as a healthy reset inside an otherwise very strong tape. The strongest rallies do not fail because of one red morning after a vertical move — they usually fail when pullbacks begin showing heavy relative volume, failed reclaim attempts, and expanding distribution across leadership and we are not seeing that (yet).
Watch how leaders behave into their rising short-term moving averages. If semiconductors and growth names begin finding demand there, this pullback becomes opportunity rather than warning.
S&P 500
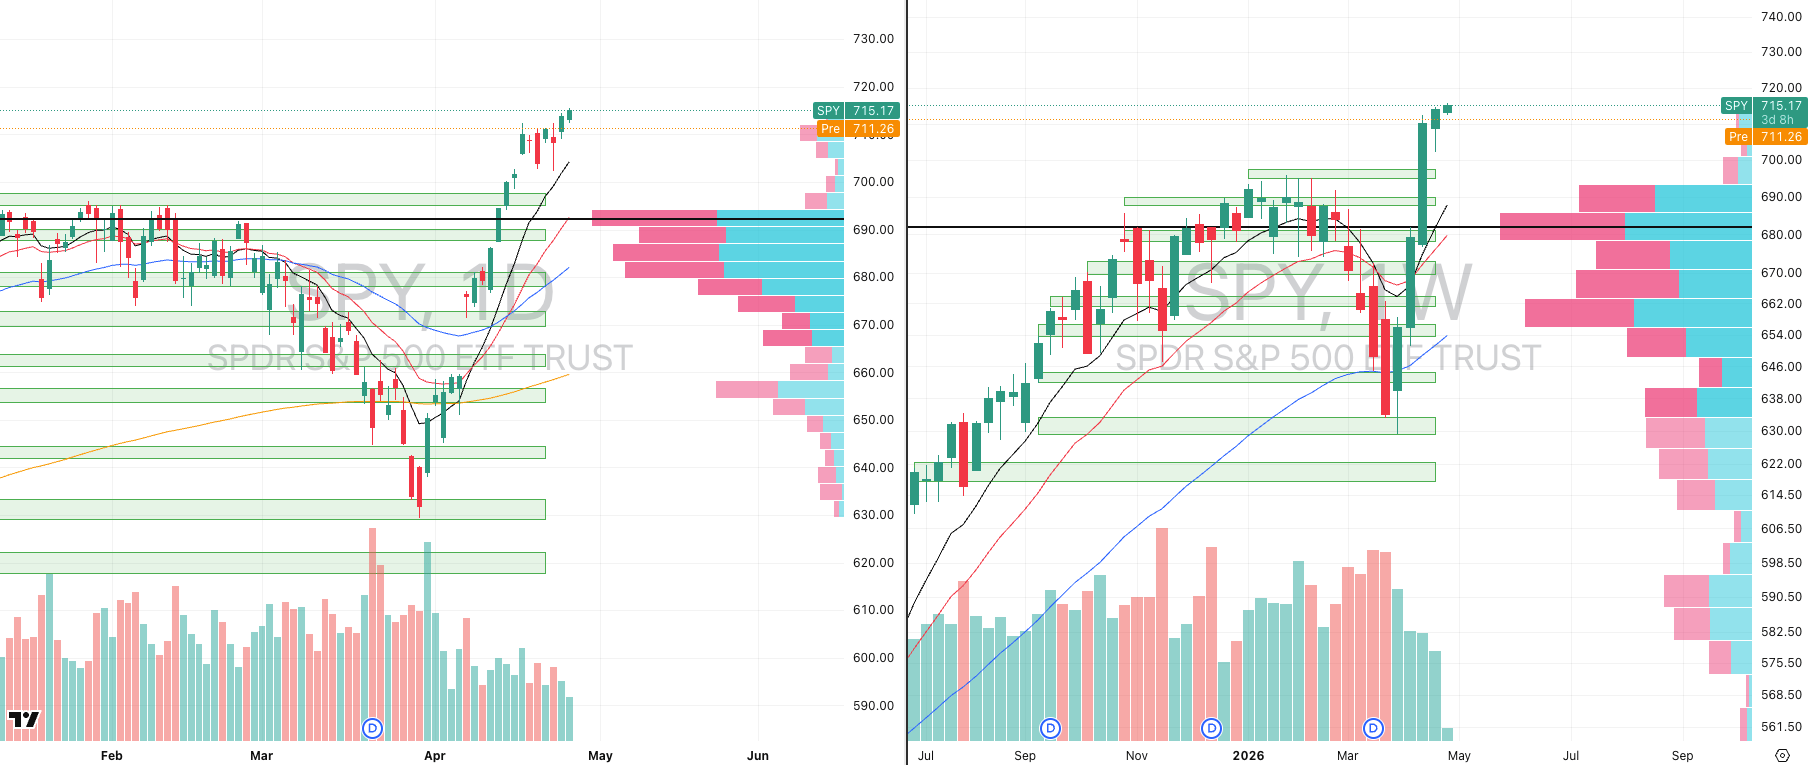
SPY VRVP Daily & Weekly Chart
55.06%: over 20 EMA | 50.29%: over 50 EMA | 55.06%: over 200 EMA
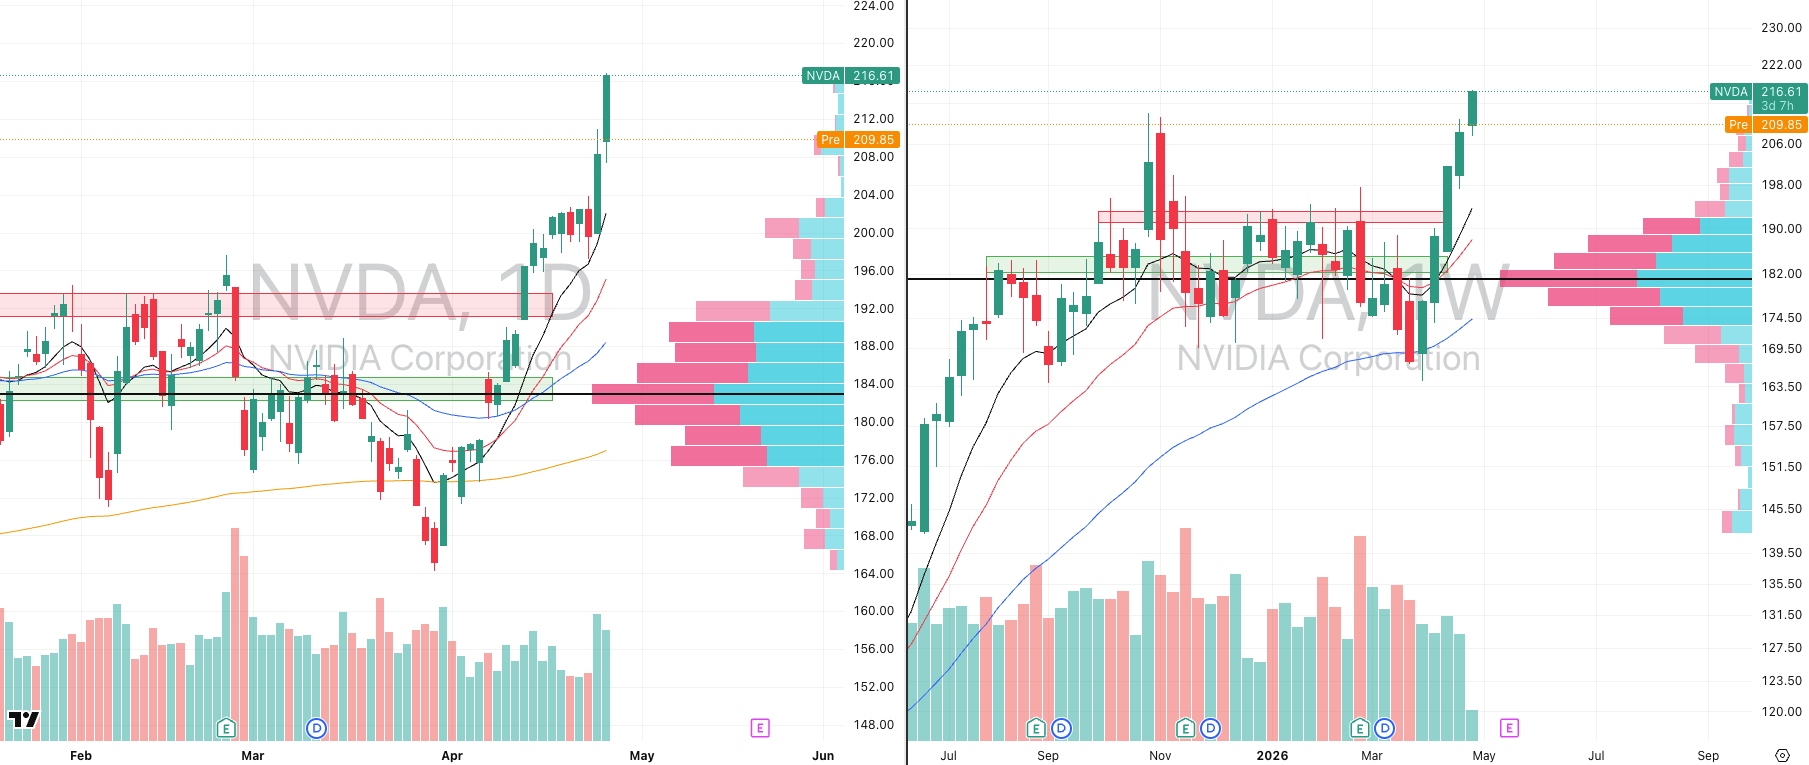
NVDA VRVP Daily & Weekly Chart
As discussed in yesterday’s report, the move lower is unfolding exactly where the greatest short-term fragility sat: semiconductors. XSD had reached 13 ATR multiples above its 50-day moving average, a level of extension where mean reversion becomes statistically extremely difficult to avoid.
Nothing in markets is ever absolute, but at that degree of stretch, across thousands of historical observations, pullback probability becomes exceptionally high. That is precisely why we positioned short XSD, and so far that trade is behaving exactly as expected.
It is important to understand what this means for the broader market. The S&P 500 is capitalization-weighted, so leadership concentration matters enormously. NVIDIA remains one of the largest contributors to index movement, and with a market cap larger than the entire UK equity market, its short-term behaviour materially impacts both SPY and QQQ.
NVIDIA had rallied nearly 30% in five weeks, carrying a 90 relative strength rating versus the SPX, and yesterday’s breakout initially looked technically powerful, printing 108% relative volume with a 4.45% intraday range, roughly 1.8x its expected ADR.
But the problem was not NVIDIA itself — it was the fact that the broader semiconductor complex underneath it was already excessively stretched. When the underlying group is this extended, even strong breakouts become vulnerable to immediate failure.
This morning NVIDIA has already reversed that breakout, and that matters because it remains one of the clearest real-time gauges for broad risk appetite. If NVIDIA continues failing intraday, that pressure will naturally transmit into both the S&P 500 and Nasdaq.
Importantly, none of this invalidates the broader Stage 2 trend. NVIDIA remains structurally strong, having re-entered Stage 2 in early April following the inverse head-and-shoulders breakout above the $180 level. What we are seeing now is not structural weakness — it is a normal cooling phase after an unusually aggressive vertical expansion.
For SPY itself, yesterday’s attempted breakout came on only 41% relative volume, which again reinforces the same concern we have highlighted for weeks: price has continued advancing while participation has steadily deteriorated. That type of rally can continue, but it increasingly requires very little supply to trigger a pullback.
Our first downside objective remains the 10-day EMA near 703.8, which represents roughly 1.6% downside from recent highs. Below that, the more meaningful technical zone sits around 689, where the 20-day moving average, rising 10-week moving average, and much denser visible-range volume profile all begin to align. That area is materially stronger demand.
There is very little meaningful volume support before roughly 693, which means if early weakness accelerates and the opening gap fails to reclaim, downside can travel quickly until stronger demand reappears.
The highest-probability short setup this morning is a failed early gap-fill. If price attempts to reclaim higher in the first 5–30 minutes but cannot sustain above 715, that likely creates another clean short entry targeting the 704 area initially.
Nasdaq
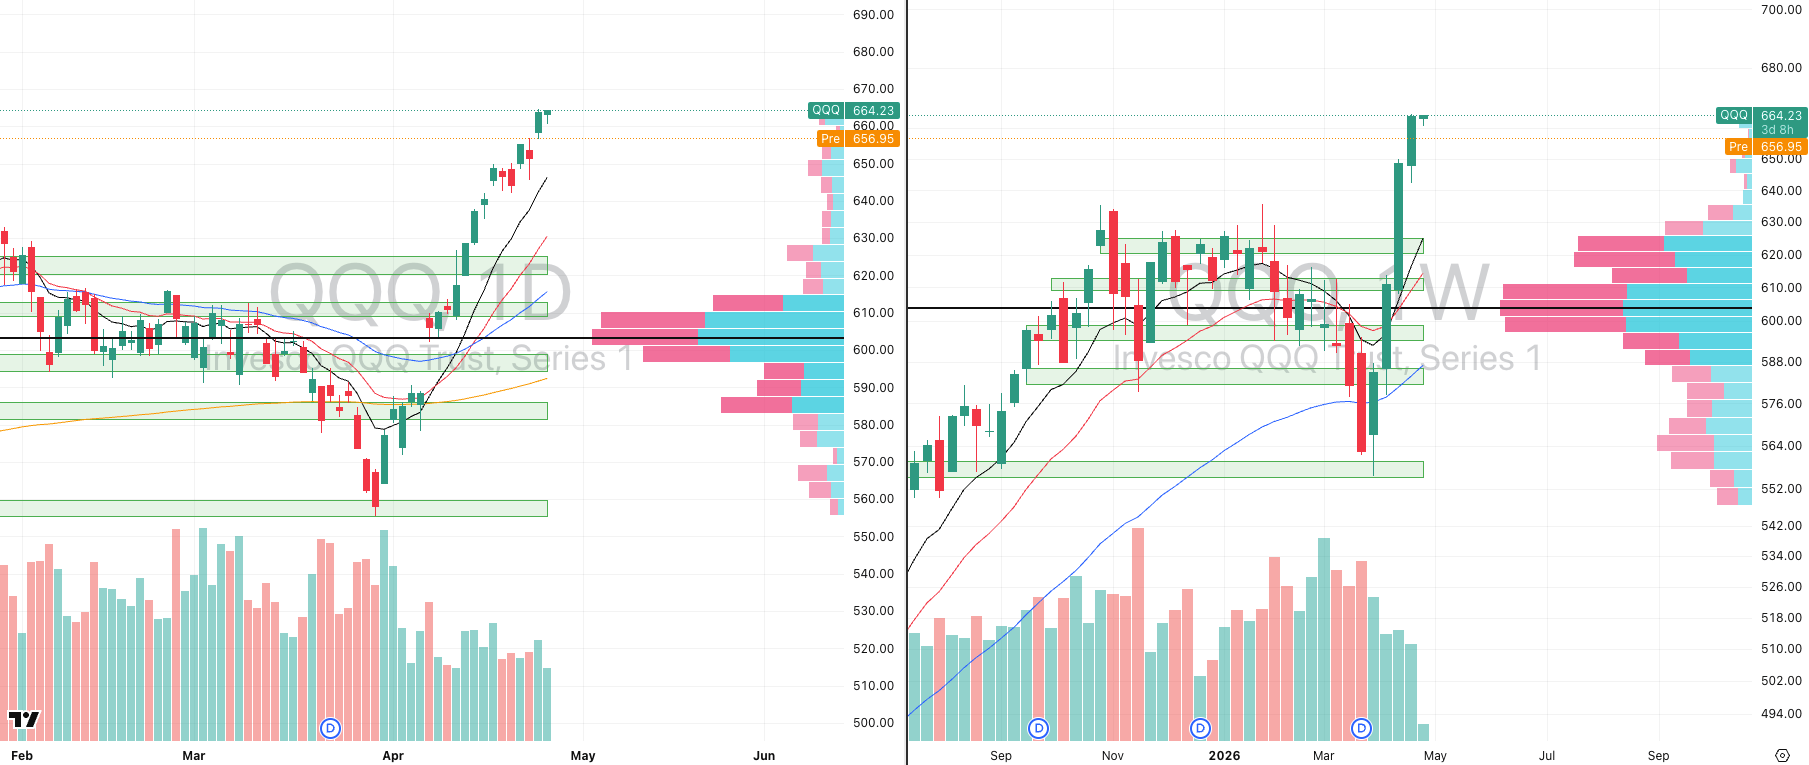
QQQ VRVP Daily & Weekly Chart
61.38%: over 20 EMA | 57.42%: over 50 EMA | 52.47%: over 200 EMA
The Nasdaq remains the index most exposed if growth continues unwinding. It is currently sitting near 6.1 ATR multiples above its 50-day moving average, which is elevated enough to justify a broader reset.
Initial downside remains the 10-day moving average near 645, but structurally the more important level is 625, where the 10-week moving average, prior breakout supply-to-demand flip, and a major visible-range volume gap all converge.
That deeper move would imply roughly 5–6% downside, which sounds large, but after five straight weeks higher on declining participation, it remains entirely within normal trend behaviour.
The key point: this does not break the broader Stage 2 advance. It simply means that fresh long exposure here carries poor asymmetry unless entered into pullback support rather than vertical expansion.
The strongest approach now is simple: allow the pullback to develop, then monitor which leaders hold their rising daily and weekly moving averages best. Those names will likely become the next high-probability entries once the reset matures.
S&P 400 Midcap
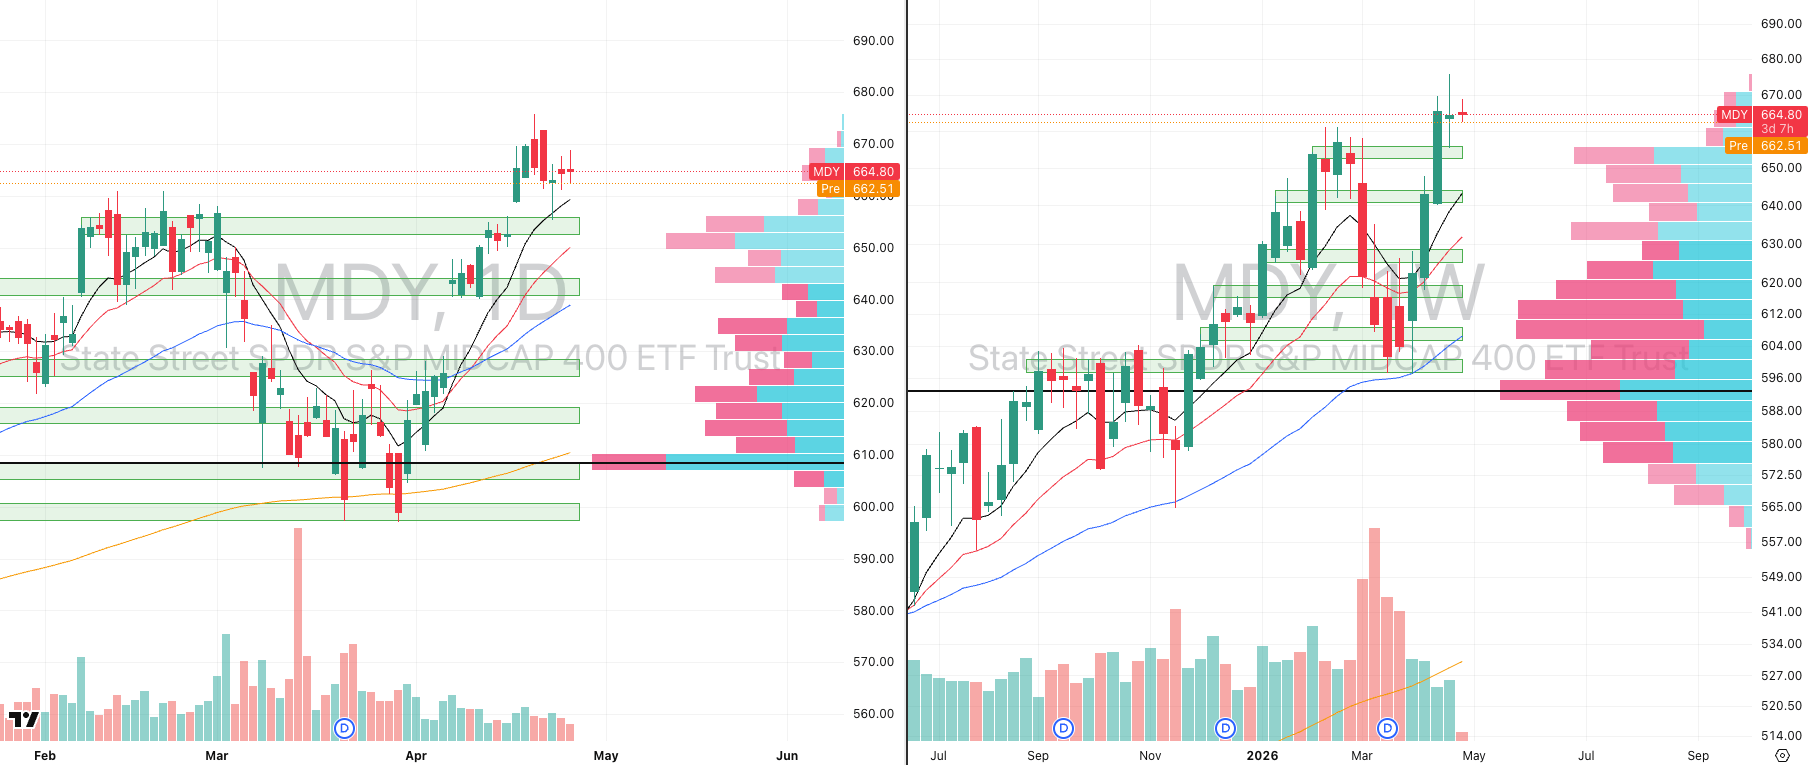
MDY VRVP Daily & Weekly Chart
69.92%: over 20 EMA | 63.40%: over 50 EMA | 61.90%: over 200 EMA
Mid-caps remain materially healthier than large-cap growth from an extension standpoint. Two consecutive inside sessions are now forming, which signals indecision rather than breakdown.
At yesterday’s highs, however, supply did begin to show: red volume exceeded green volume, confirming that sellers are becoming more active near resistance.
Our near-term expectation remains a pullback toward 655, where prior supply flipped to demand and where Thursday’s bounce originated.
Unlike semiconductors, mid-caps are only 2.79 ATR multiples above the 50-day moving average, meaning they are not yet structurally overextended.
Breadth remains elevated, with 70% of stocks above their 20-day EMA, so some cooling is normal, but this area still offers significantly better long-side asymmetry than the more stretched large-cap growth complex.
Russell 2000
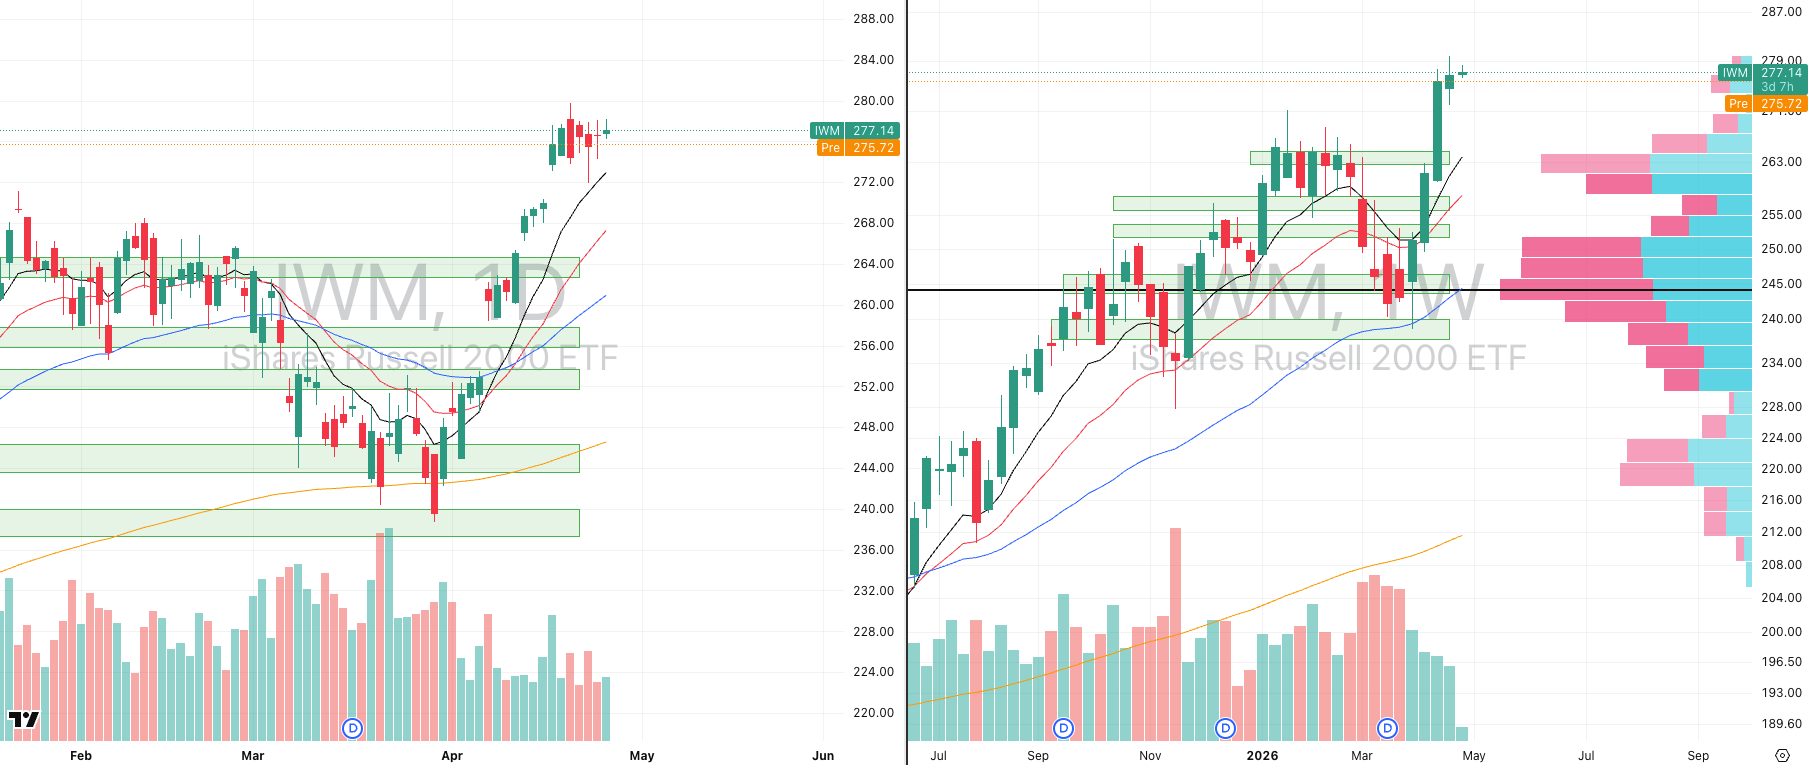
IWM VRVP Daily & Weekly Chart
69.05%: over 20 EMA | 54.11%: over 50 EMA | 58.54%: over 200 EMA
The Russell is now showing the same broad behaviour as mid-caps: tightening after a sharp vertical advance, but with slightly greater extension. IWM is currently sitting 4.28 ATR multiples above its 50-day moving average, roughly 7.2% above the 50-day EMA, which leaves it materially more vulnerable to short-term mean reversion than MDY.
Since 17 April, price has increasingly started showing distribution near highs, and that suggests the first logical move is a pullback toward the 10-day EMA near 272, which implies roughly 1.9% downside from recent levels. That move is entirely achievable within normal daily volatility and only requires around 1.2x ADR expansion.
The deeper technical issue, however, is the distance from the 10-week moving average, which remains almost 4.7% below current price. On the weekly structure, that is where demand becomes materially denser. Between current levels and roughly 264, the visible-range volume profile remains relatively thin, meaning there is limited structural support if sellers continue pressing.
From a tactical standpoint, we still favour the short side while this mean reversion phase remains active, but with tighter execution. A practical approach is short exposure into failed strength with risk controlled above roughly 278–279, targeting the 272 area first, rather than immediately positioning for the full weekly retracement.
The reason for caution is simple: while the 10-week moving average offers the highest asymmetry for an eventual long-side bounce, markets rarely travel there in a straight line. The first high-probability move remains toward short-term moving average support, where buyers may begin stepping back in.
FOCUSED GROUP
URA: Why Uranium Will Pull Back -5%
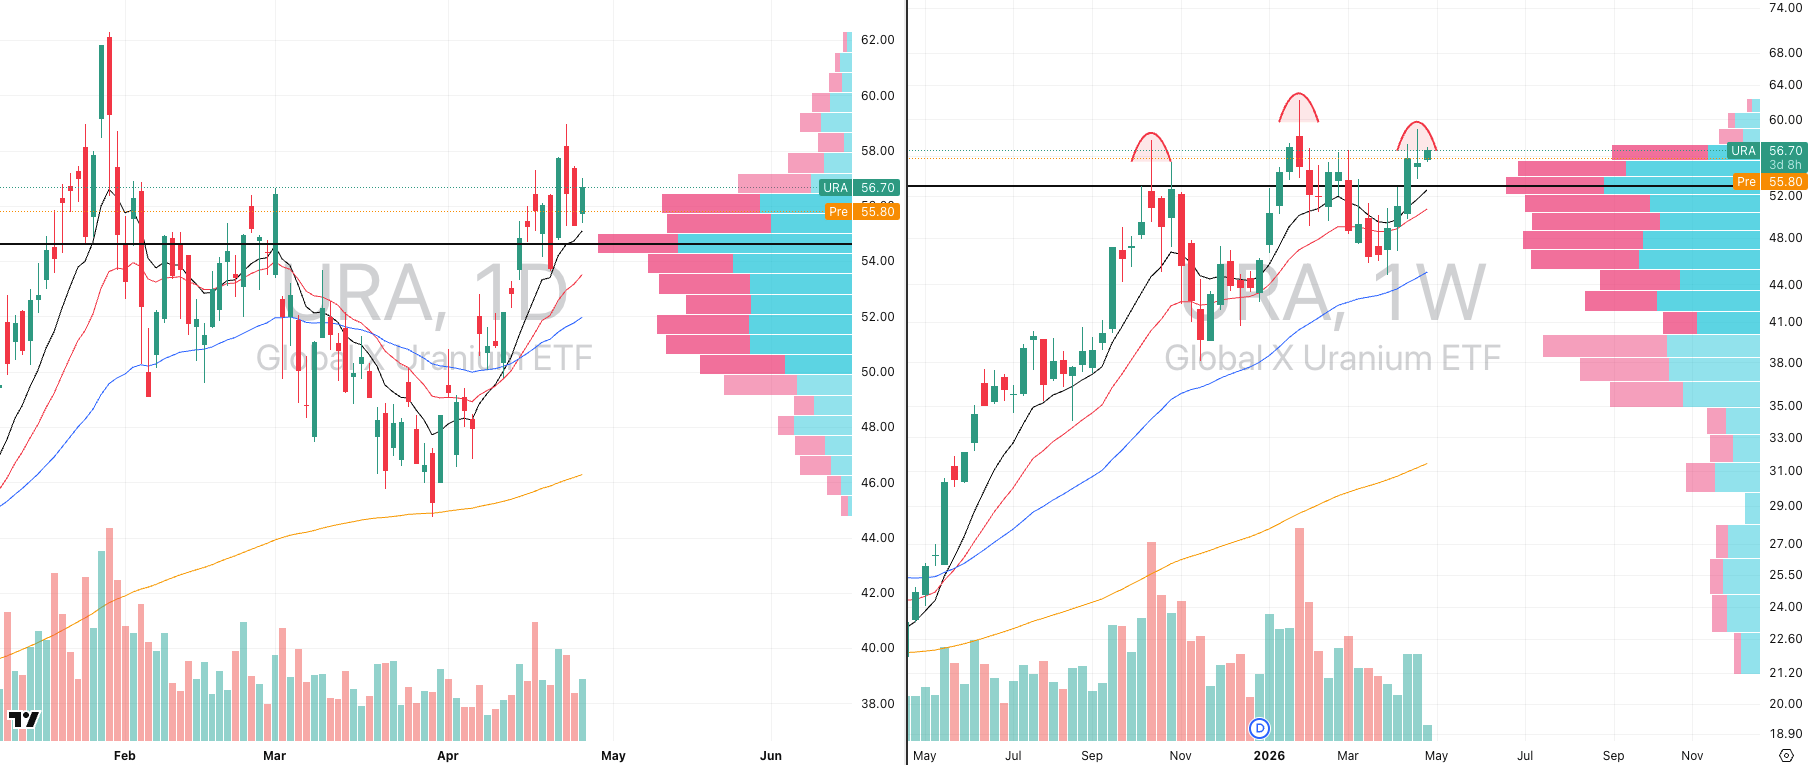
URA VRVP Daily & Weekly Chart
Uranium had been one of the cleaner long setups over recent weeks, particularly after the strong relative-volume expansion that began from 9 April, but the short-term character is now changing.
The group remains heavily tied to broader growth appetite, largely because the uranium narrative is increasingly linked to AI energy demand, nuclear buildout, and small modular reactor themes. When growth begins cooling, uranium often responds with it.
Technically, URA is now forming what increasingly resembles a triple-top structure, and while we do not view that as a major trend failure, it does raise the probability of a pullback toward the 10-week moving average near 53.1, which also aligns closely with the 20-day moving average and point of control. That implies roughly 5% downside, which is entirely normal after the recent move.
Importantly, this would still be a textbook pullback inside a broader Stage 2 structure, not a bearish breakdown. Pullbacks into prior breakout zones are often exactly where stronger continuation setups emerge.
Short-term volume confirms why caution is warranted. At yesterday’s highs near 57, daily volume initially looked constructive, but those buyers are now trapped above current price and become potential supply on any retest.
When we zoom out to the weekly structure, the picture becomes clearer: around 57, weekly volume shows more than a two-to-one imbalance in favour of sellers, with roughly 2 million shares traded red versus 900,000 green. That tells you larger supply has been active at this level for some time.
That is why we suspect price is more likely to rotate lower first before any serious continuation attempt.
The key distinction: a move into the 10- and 20-week moving averages does not invalidate the broader trend. Only a failure to hold those levels would begin to threaten the structural bullish case.
Until then, this is simply a normal reset inside an otherwise still constructive trend.

Did you find value in today's publication?This helps us better design our content for our readers |
Reply