- Swingly
- Posts
- Why We Are Pushing META Exposure
Why We Are Pushing META Exposure


MARKET ANALYSIS
Here’s All You Need To Know

The market is pushing higher again this morning, with Dow futures up strongly and the index now positioned to retake the 50,000 level.
The strength is still being led by technology and AI-related names, with Cisco surging after earnings, Nvidia pushing higher on fresh China chip headlines, and the broader semiconductor trade continuing to carry the market.
Cisco’s earnings were important because they reinforce the same message we have been discussing for weeks. Enterprise technology demand is still holding up, and the market is continuing to reward companies tied to AI infrastructure, networking, cloud and productivity spending.
Nvidia also remains central to the tape. Reports that the U.S. has cleared around 10 Chinese firms to buy Nvidia’s H200 chips have helped reignite optimism around semiconductor demand and China access.
The Trump and Xi meeting is the other major macro catalyst today. The fact that Iran and the Strait of Hormuz were discussed, with both sides reportedly agreeing that the strait must remain open, is important because oil remains the biggest inflation pressure point in the market.
That said, the inflation backdrop is still not clean. Import prices jumped 1.9% in April, with fuel and lubricant prices rising 16.3%, while petroleum prices rose 19%. Export prices also rose 3.3%, taking the yearly increase to 8.8%, the highest since 2022.
Retail sales were in line with expectations, rising 0.5%, but the headline number was helped significantly by higher gas station sales. That means part of the consumer strength is being inflated by energy costs, not necessarily stronger real demand.
Jobless claims also came in slightly higher than expected at 211,000, with continuing claims rising to 1.78M. That is not a major labor market warning yet, but it does show some cooling beneath the surface.
The bigger picture is that the market is still choosing to focus on earnings, AI capex and technology leadership rather than inflation pressure.
This is why the S&P 500 and Nasdaq were able to make fresh records yesterday, even though the majority of stocks actually closed lower.
That is an important detail. The headline index looks strong, but the rally is still narrow and heavily dependent on mega-cap technology, semiconductors and AI infrastructure names.
We are not seeing broad market weakness yet, but we are seeing a market where the largest growth stocks are doing most of the work.
This is very similar to what we have discussed over the last few reports. The AI trade remains the dominant force, but many of the leading groups are now technically extended on the intermediate trend.
The market can keep climbing while these names continue to hold their rising 10 day EMAs, but traders need to be very careful about chasing marginal highs after such a strong move.
Today’s focus should be simple: watch whether Nvidia and semiconductors can keep leading, watch whether the Dow reclaiming 50,000 broadens participation, and watch whether oil stays contained after the Trump and Xi meeting
Nasdaq

QQQ VRVP Daily & Weekly Chart
50.49%: over 20 EMA | 51.48%: over 50 EMA | 56.43%: over 200 EMA
The Nasdaq is still extremely extended, sitting around 9.37 ATR multiples above its 50 day EMA, which is roughly 13.97% above that level.
We did get a brief pullback on Tuesday into the 696 area, but buyers stepped in aggressively.
The visible range volume profile at that level showed roughly 3.67M shares traded green versus only 1.9M shares traded red, which confirms demand was active on the dip.
Yesterday then followed with a continuation higher on 73% relative volume.
Objectively, 73% relative volume is still low versus the 20 day average, but relative volume has generally been low throughout this entire two week rally, largely because the move is being driven by the Magnificent Seven rather than broad participation.
The Nasdaq still has very strong relative strength at 83.3 versus the SPX, and breadth is improving again, with the percentage of stocks above the 20 day EMA moving back above 50%.
The percentage of Nasdaq stocks above the 50 and 200 day EMAs is also holding very firm, which tells us the longer term trend is still intact.
The problem remains entry.
At 9.37 ATR multiples, fresh long exposure into marginal highs is off limits from our perspective.
The Nasdaq can continue drifting higher, but the clean long entries are on pullbacks, not late breakout chases.
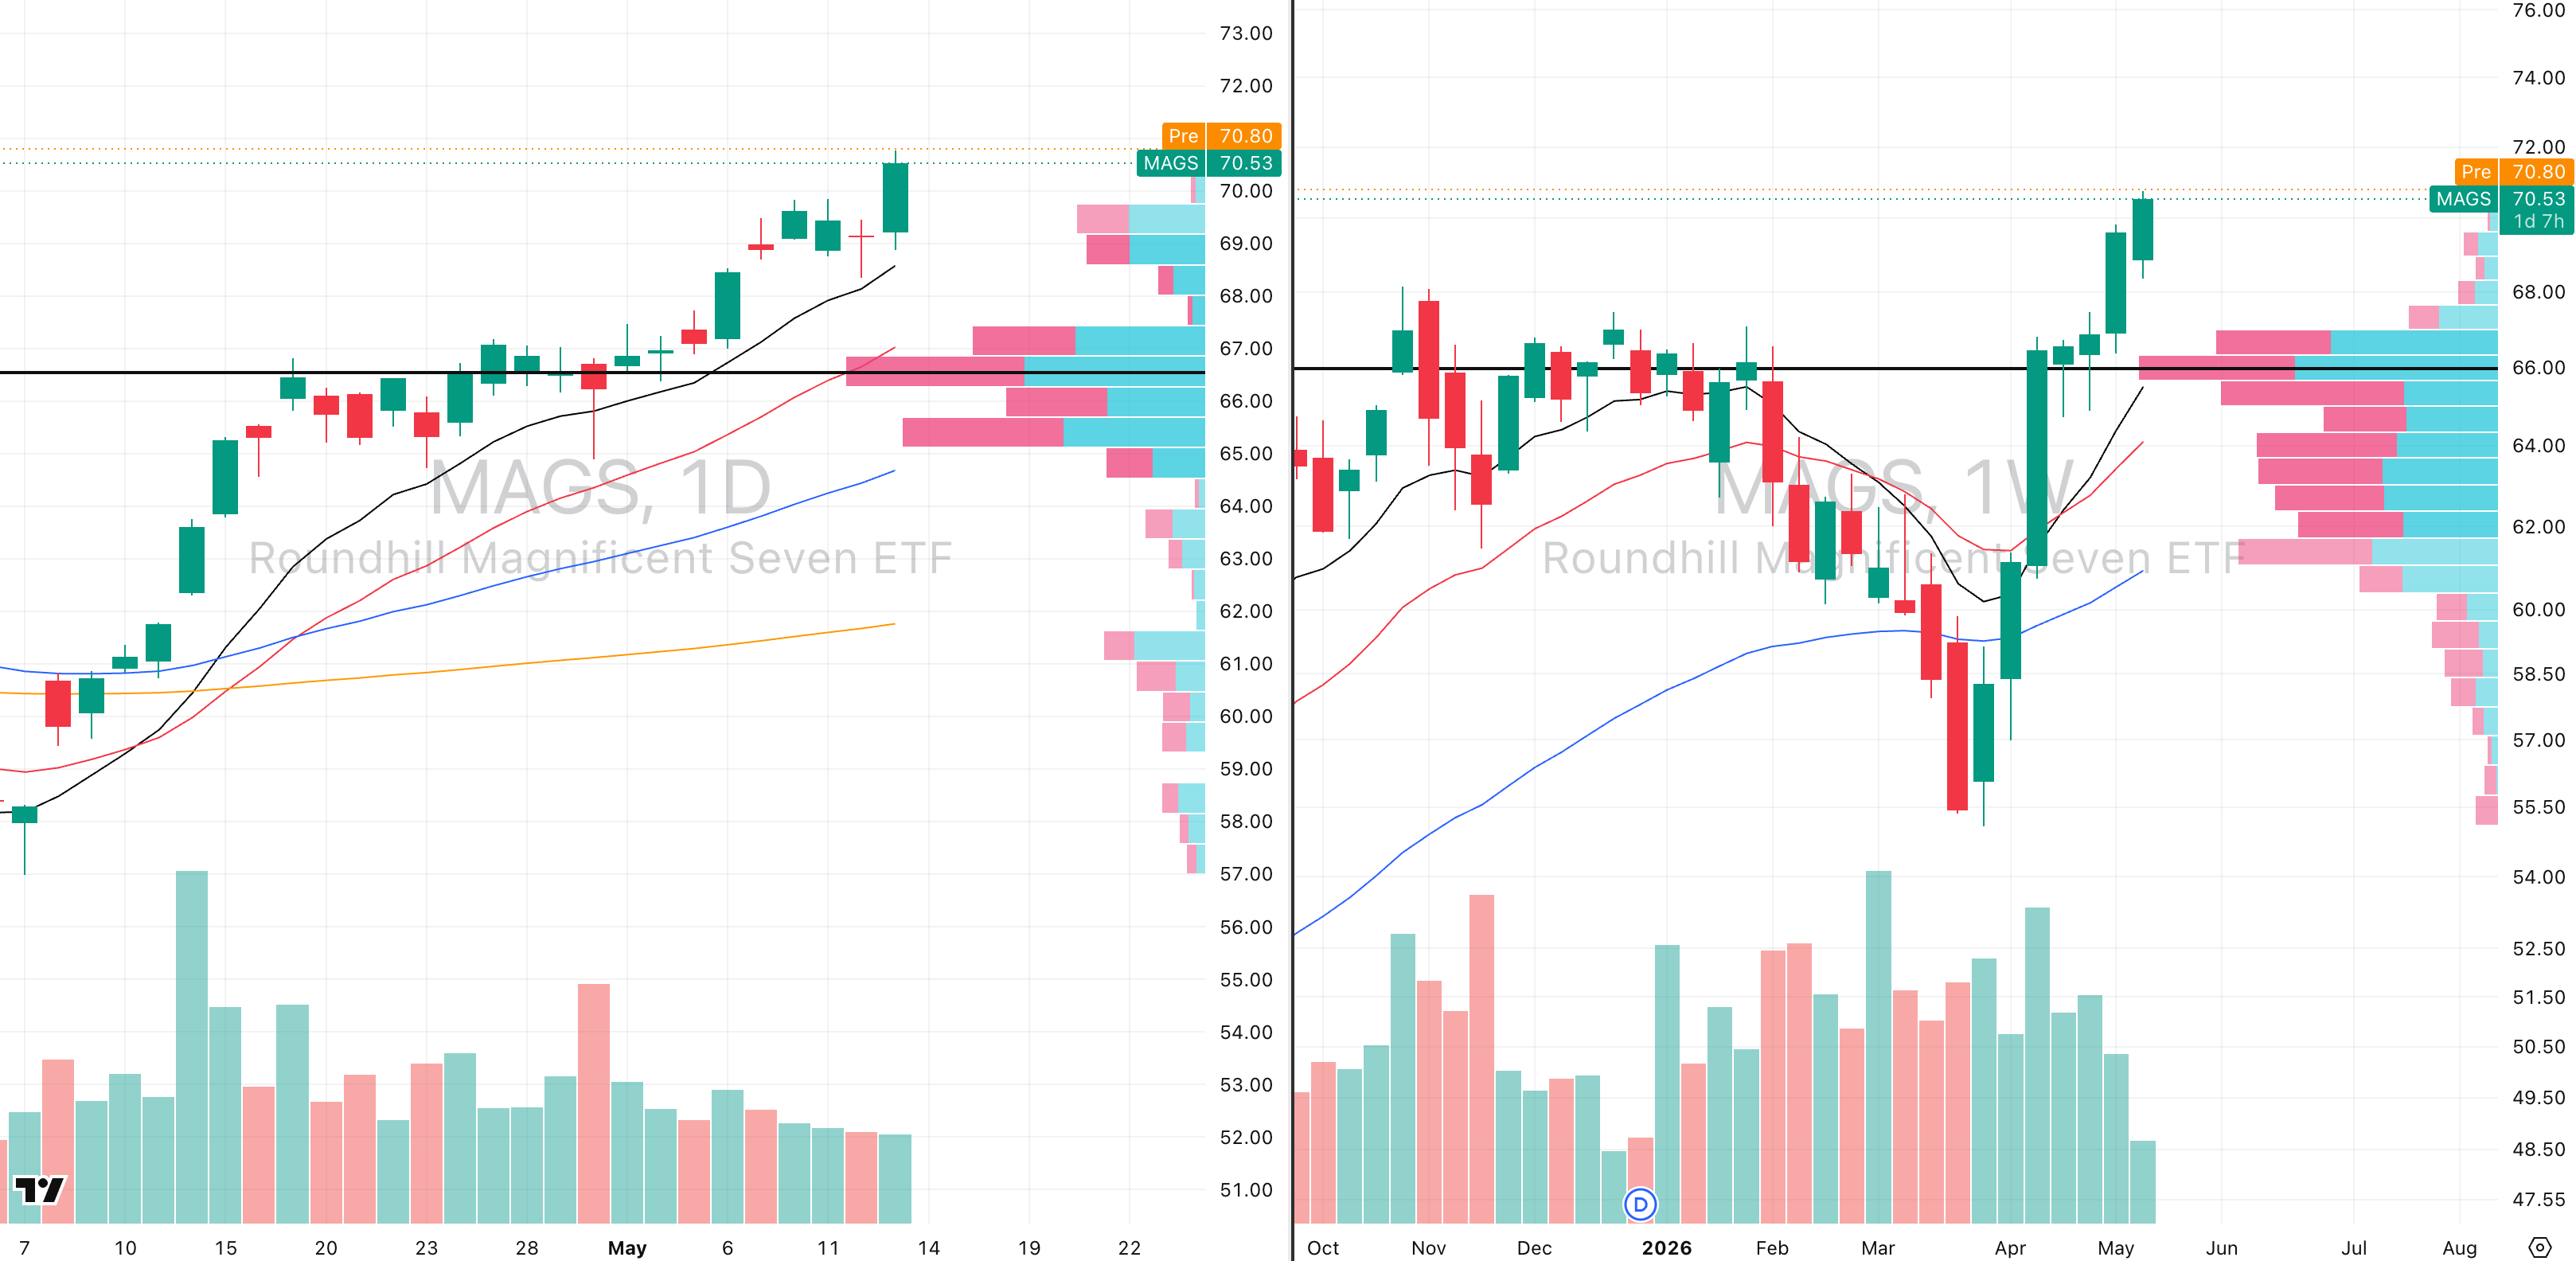
MAGS VRVP Daily & Weekly Chart
The Magnificent Seven broke out strongly yesterday after another successful test of the rising 10 day EMA on Tuesday.
The MAGs are also extended, sitting around 6.79 ATR multiples above the 50 day EMA, but they continue to act as the real engine of the Nasdaq.
This is important because the Magnificent Seven make up around 38% of the Nasdaq, which explains why the MAGs chart and the QQQ chart look so similar.
Relative strength is still strong at around 75 versus the SPX.
We would be tracking the MAGs very closely here because they are likely to dictate how the broader growth complex behaves.
If the MAGs start failing at these highs, that will likely be the signal for a pullback across the Nasdaq and the broader growth trade.
For now, buyer aggression is still present.
Through the midpoint of yesterday’s candle, the visible range volume profile showed roughly 333,000 shares traded green versus around 170,000 shares traded red.
That tells us buyers were still aggressively hitting the ask throughout the move, not just defending the lows.
S&P 400 Midcap

MDY VRVP Daily & Weekly Chart
34.75%: over 20 EMA | 51.00%: over 50 EMA | 53.25%: over 200 EMA
MDY has now seen four sessions of expanding relative volume as price has pushed lower, which shows distribution pressure has been building.
That said, the last two sessions have shown some momentum slowing, with the average true range contracting as price tests the rising 20 day EMA.
This 20 day EMA is an important level because MDY has respected it well throughout this rally.
The prior test on April 29th was bought aggressively before price pushed back higher.
From a pullback long perspective, this is the area where long exposure starts to make sense again.
A clean long setup would be an entry around the 20 day EMA, with a stop below the dense visible range volume profile area around 659.76.
That gives a cleaner expression of asymmetry than chasing the Nasdaq at highs.
On the weekly chart, MDY is still showing some failure near highs, but the declining relative volume during this consolidation is not a major concern because the ATR multiple has cooled to around 2.88.
Breadth is also very washed out short term, with only around 35% of mid cap stocks above their 20 day moving average.
The more constructive point is that the percentage of stocks above the 50 and 200 day EMAs remains above 50%.
That means short term weakness is present, but longer term demand is still holding.
Russell 2000

IWM VRVP Daily & Weekly Chart
41.13%: over 20 EMA | 58.02%: over 50 EMA | 56.61%: over 200 EMA
The Russell 2000 has a higher relative strength rating at around 76.4 versus the SPX.
It is also more extended than MDY, sitting around 4.59 ATR multiples above its 50 day EMA, or roughly 7.53% above that level.
Over the last two sessions, price undercut the rising 10 day EMA and was bought back up aggressively both times.
That is a major sign of strength.
Unlike MDY, IWM has not needed to test the 20 day EMA to find demand.
The visible range volume profile around 279.92 shows roughly 3.39M shares traded green versus around 2M shares traded red, confirming buyers are supporting intraday dips.
For now, IWM remains a better relative strength proxy than MDY.
The only caveat is extension as the IWM is stronger, but MDY offers cleaner pullback asymmetry because it has cooled off more.
FOCUSED GROUP
XLC: Watch GOOGL & META Closely

XLC VRVP Daily & Weekly Chart
Our focus group today is XLC, Communication Services and the reason is simple. XLC is sitting inside a large base that has now been developing for around 230 trading days.
On the weekly structure, price is consolidating above the 10 and 20 week moving averages, and every dip since April 27th has been bought back up.
The structure also resembles a messy inverse head and shoulders, with the head forming around March 27th and the right shoulder now being built.
XLC is also holding its 50 day EMA very well, with price repeatedly being bought back up at that level.
More importantly, we now have a morning star formation across the last three trading sessions.
Morning stars are one of the better reversal structures, and with XLC gapping higher this morning, that setup is now being validated.

GOOGL VRVP Daily & Weekly Chart

META VRVP Daily & Weekly Chart
Google has broken out, which matters because it is the largest weighted stock inside XLC.
Meta is the second largest weight, and this is where the better individual trade opportunity may be.
Meta is consolidating around its 20 month moving average, relative volume started picking up yesterday, and the average true range is beginning to expand.
That gives Meta a viable long setup, especially because it is not just a short term bounce but a higher timeframe structure trying to resolve higher.
XLC as a whole now looks like one of the more important sectors to watch for fresh long exposure.
While the Nasdaq is extremely extended, XLC offers a cleaner setup because it is breaking out of a much larger base rather than chasing a late stage vertical move.

Did you find value in today's publication?This helps us better design our content for our readers |
Reply