- Swingly
- Posts
- Why We Are Going BIG on Uranium
Why We Are Going BIG on Uranium


MARKET ANALYSIS
Here’s All You Need To Know
Broadly speaking, things are still going very well for the bulls right now, and what continues to surprise is just how well the large growth complex is holding after such a fast recovery back to highs.
Normally after a move of this speed, you would expect much more immediate profit-taking, especially in the heavier names, but instead many of the major growth leaders are still holding their gains cleanly and continuing to absorb supply.
That matters because large-cap growth remains the core engine of this market, and as long as those names stay firm, the broader indices continue to have support underneath them.
The market is still trading heavily around the expectation that geopolitical stress continues to ease, with fresh rhetoric around U.S.–Iran negotiations helping maintain risk appetite even though nothing fully definitive has been signed yet.
At the same time, oil remains elevated rather than collapsing, which tells you macro stress has eased but has not disappeared.
West Texas Intermediate above $91 is still historically elevated enough that traders cannot ignore it, particularly if we see buyers return aggressively into energy again.
What is notable underneath the surface is that this rally is no longer just a reflex bounce — leadership is actually holding, breakouts are sticking better, and failed moves are producing fewer immediate stop-outs than we were seeing through the earlier part of the year.
Earnings are also helping support the tone, with PepsiCo beating this morning and adding another steady fundamental input into an already constructive tape.
The next important test comes from whether this strength can broaden further beyond the biggest growth names, because that is what would make this move materially stronger rather than simply another leadership-driven extension.
S&P 500

SPY VRVP Daily & Weekly Chart
72.16%: over 20 EMA | 50.89%: over 50 EMA | 54.87%: over 200 EMA
SPDR S&P 500 ETF Trust is now officially 0.6% above all-time highs, and although yesterday’s session again came on extremely low participation at just 66% relative volume versus the 20-day average, it is becoming increasingly difficult to ignore how strong the internal breadth has become.
The key difference now is that breadth is expanding aggressively across the board: more stocks are participating, more sectors are holding breakouts, and internal market structure is materially stronger than it was during earlier failed pushes.
Technically, the most important development is the decisive break and hold above the $680 point of control on the visible range volume profile (VRVP) — a level that had repeatedly acted as a major acceptance barrier and has now held cleanly on every open this week.
We are also not yet in true extension territory. Price is only 2.94 ATR multiples above the 50-day EMA, and historically it is usually beyond 5–6 ATR multiples where reversal risk becomes statistically much more serious.
The bigger concern remains the same: volume. Classical technical theory would still argue that declining volume during an aggressive rally should be treated cautiously because it suggests limited commitment underneath price.
However, when breadth is this strong and multiple sectors are advancing simultaneously, the market is effectively telling you that risk is still being accepted despite the low conviction backdrop.
Nasdaq
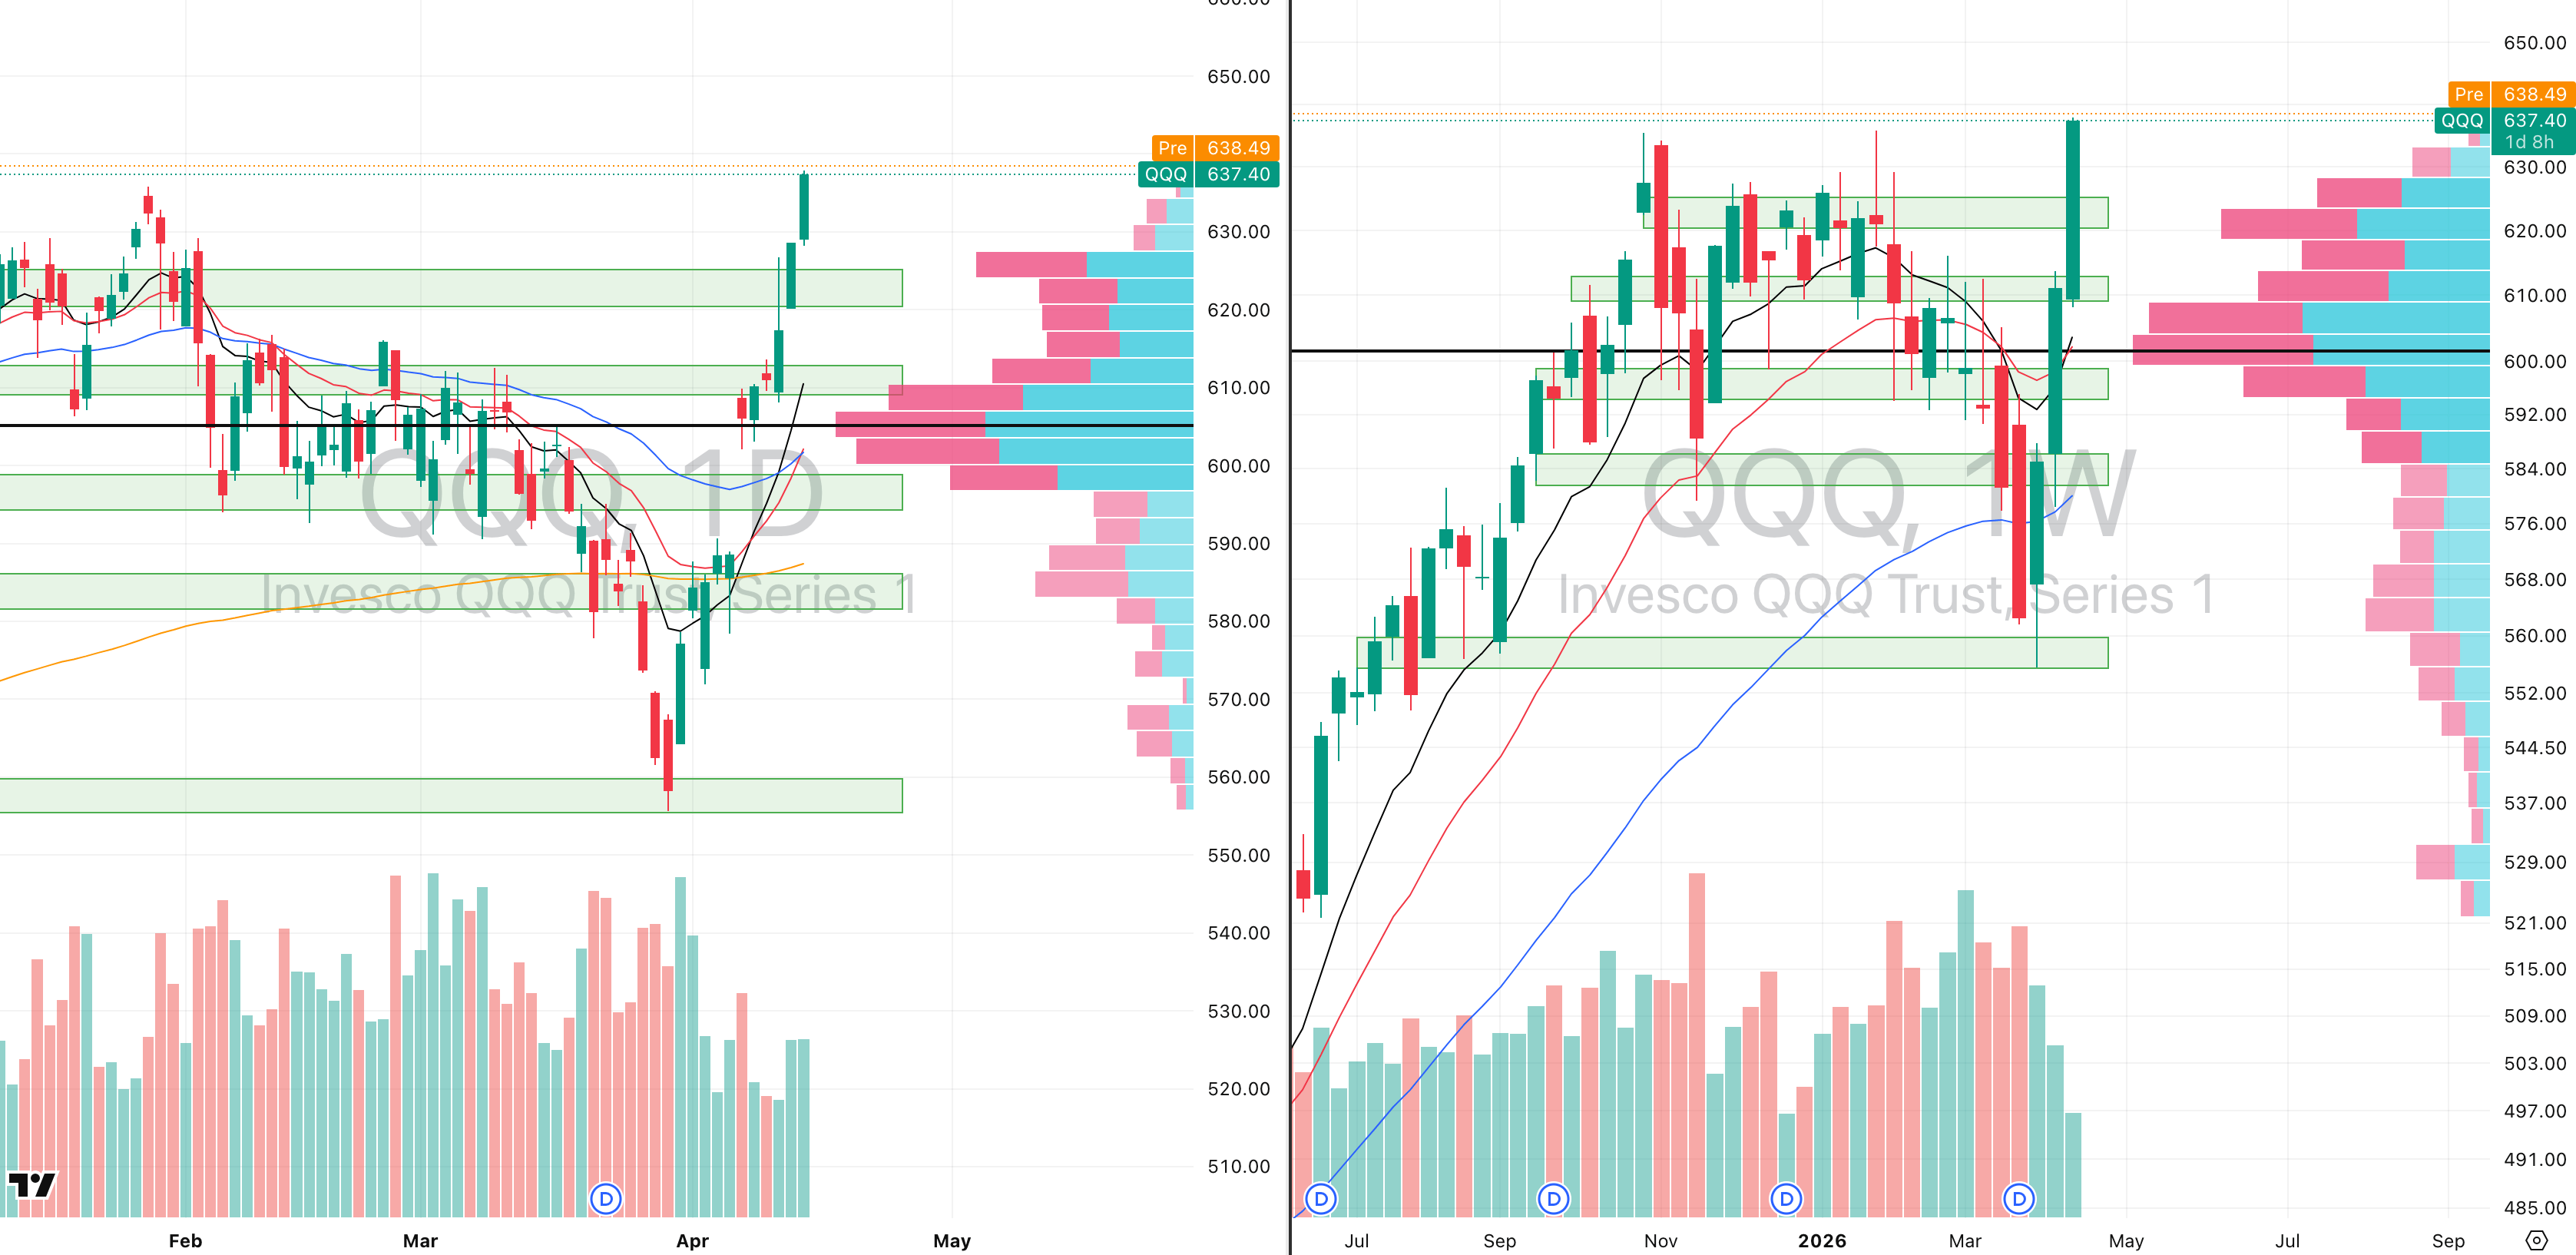
QQQ VRVP Daily & Weekly Chart
72.27%: over 20 EMA | 53.46%: over 50 EMA | 48.51%: over 200 EMA
Invesco QQQ Trust is showing greater short-term technical extension than SPY, now sitting at 3.48 ATR multiples above the 50-day EMA, with relative volume slightly firmer over the last two sessions at around 74%.
That makes sense because technology and growth remain the primary engine behind this rally, and the QQQ continues to reflect where capital is flowing most aggressively.
Even after this move, QQQ is only 0.3% above prior highs, largely because this segment had been hit much harder during the earlier selloff and therefore had more recovery room.
Tech is clearly the strongest area in the market right now, and the QQQ simply mirrors that leadership.
Under normal conditions we would place much more weight on the lack of volume, but at this stage the quality of price action is overriding that concern because entries have been highly tradable, linear, and producing real follow-through.
The most likely explanation is that many larger participants still do not fully trust the current U.S.–Iran de-escalation backdrop, which is why conviction remains muted even while price continues higher.
But from a pure market structure standpoint, strong Nasdaq breadth combined with clean price acceptance is difficult to argue against.
S&P 400 Midcap
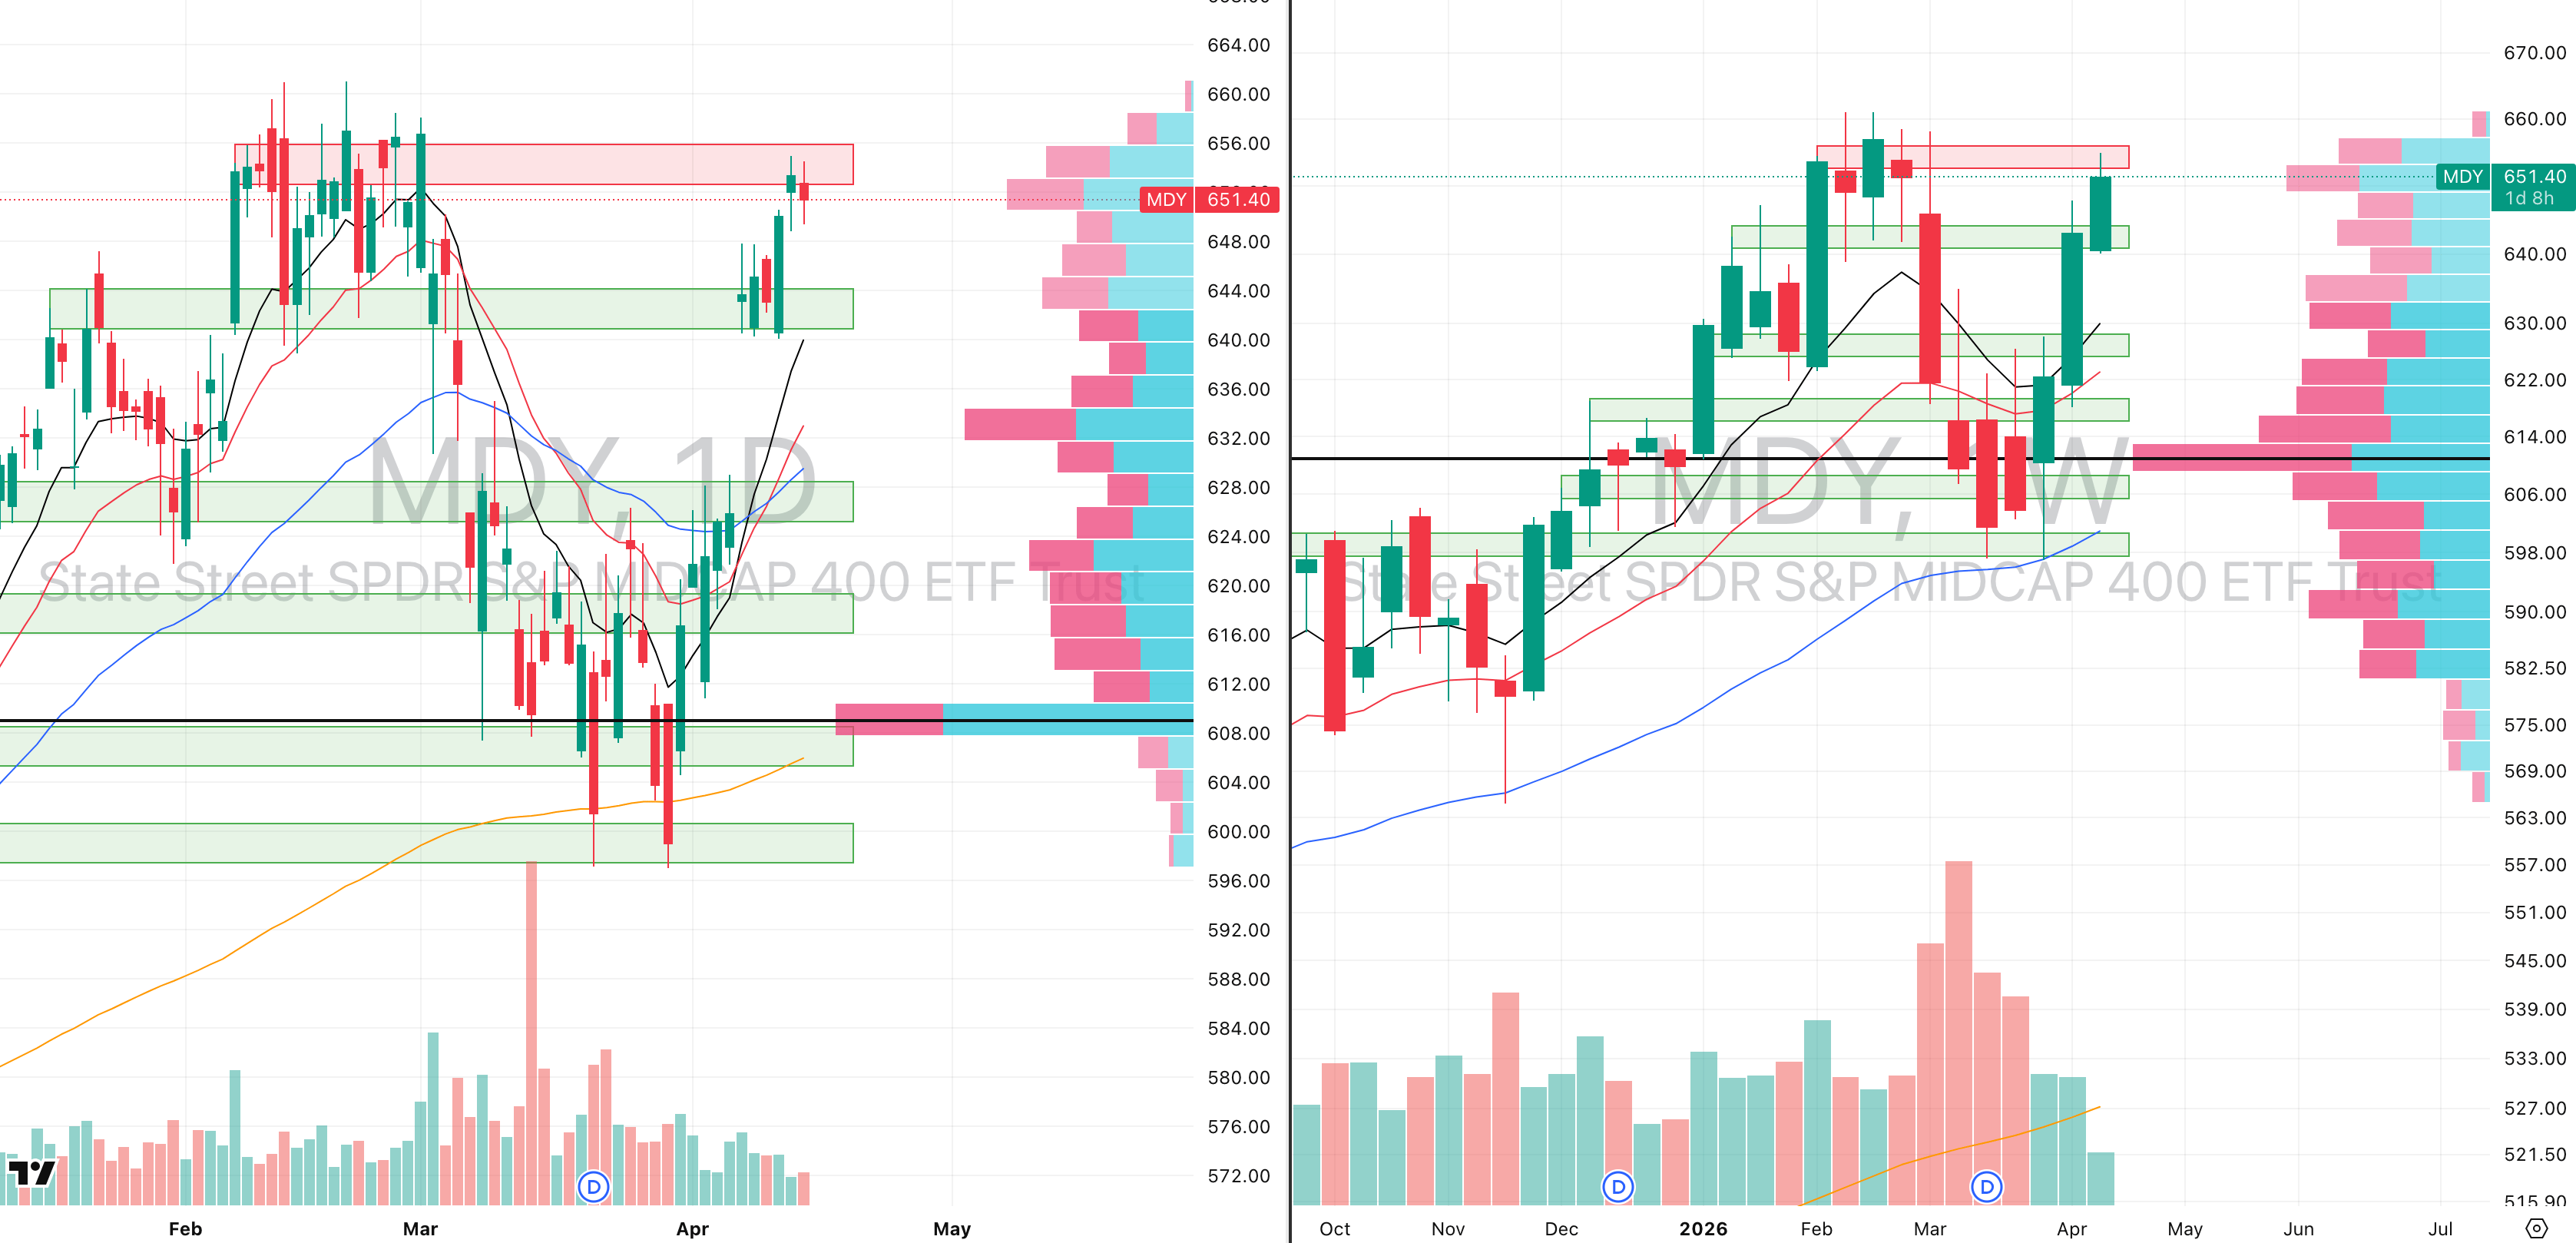
MDY VRVP Daily & Weekly Chart
80.50%: over 20 EMA | 57.00%: over 50 EMA | 58.50%: over 200 EMA
SPDR S&P MidCap 400 ETF Trust is further along the risk curve and therefore naturally showing sharper short-term velocity, with nearly 81% of its components now trading above their 20-day EMAs.
The ETF is meeting expected supply near $656, which is the same area where meaningful distribution occurred during February–March 2026.
Importantly, the rejection in the last two sessions has also occurred on extremely light participation — only 38–41% relative volume — which tells us sellers are not pressing aggressively here.
In other words, this does not currently resemble heavy distribution.
A pullback toward the $640 10-day EMA would be completely normal if it develops, representing roughly -1.82% downside, or about 1.2x MDY’s 20-day ADR.
For now though, that remains lower probability because underlying market behaviour still suggests continued accumulation on lows rather than rotation out.
Russell 2000

IWM VRVP Daily & Weekly Chart
86.06%: over 20 EMA | 66.25%: over 50 EMA | 58.81%: over 200 EMA
iShares Russell 2000 ETF continues to be one of the most impressive segments in the market, now sitting 2.61 ATR multiples above the 50-day EMA, which still leaves substantial room before mean reversion becomes a serious technical concern.
From a breadth standpoint, small caps are currently among the strongest equity segments in the market.
Relative volume remains low, just as it does across the broader tape, but what matters more is the relative strength profile: IWM is now showing 73 relative strength versus SPY, which is one of the strongest readings across the major index ETFs.
That matters because small caps sit closest to the high-volatility part of the equity curve — when this area starts outperforming, it usually reflects real risk appetite underneath the surface.
They are not yet at all-time highs, but for momentum traders this remains one of the most attractive areas because these names typically deliver the largest percentage expansions once leadership confirms.
FOCUSED GROUP
URA: Why Uranium Looks Strong Here

URA VRVP Daily & Weekly Chart
Global X Uranium ETF delivered a very explosive move yesterday, with 120% relative volume — the strongest participation the group has seen in weeks — which immediately stands out because this was not just price drift higher, it was real capital stepping in.
Relative strength has also pushed to 90 versus the SPX, placing uranium among the strongest groups currently operating in the market.
Importantly, despite the move, URA is only 1.69 ATR multiples above its 50-day EMA, which means from a technical extension standpoint there is still meaningful room before the group becomes stretched.
One reason we continue to track uranium closely is that it often moves in tandem with broader growth behaviour: when risk appetite improves and capital rotates into higher-beta themes, uranium tends to respond quickly.
The most important signal came on 13 April, when URA flushed sharply below $50, tested the rising 10, 20 and 50-day EMAs, and then recovered cleanly.
That type of downside rejection into multiple moving-average supports is usually a very strong sign that underlying demand is active.
In other words, sellers had the opportunity to break structure and failed.
That recovery now gives the group a much cleaner technical base to work from if momentum continues.
Below we are attaching the strongest pure uranium names we are personally tracking — specifically the higher-quality names where liquidity, structure and institutional participation are materially better than the lower-tier speculative parts of the theme.
Our preference remains names such as Uranium Energy Corp., Ur-Energy Inc., and Centrus Energy Corp., because these tend to offer cleaner execution and more stable trend behaviour.
We generally prioritise those over the small modular reactor names such as NuScale Power Corporation, Nano Nuclear Energy Inc., or Oklo Inc..
The reason is simple: SMR-related names are far more speculative.
They can absolutely move harder on a percentage basis, but that comes with materially higher volatility and far less forgiving price behaviour.
So the choice comes down to risk tolerance: higher quality uranium producers and fuel-cycle names for cleaner exposure, or reactor names if you are intentionally seeking larger percentage swings with much wider risk bands.
Strongest Pure Uranium Stocks:

UEC VRVP Daily & Weekly Chart
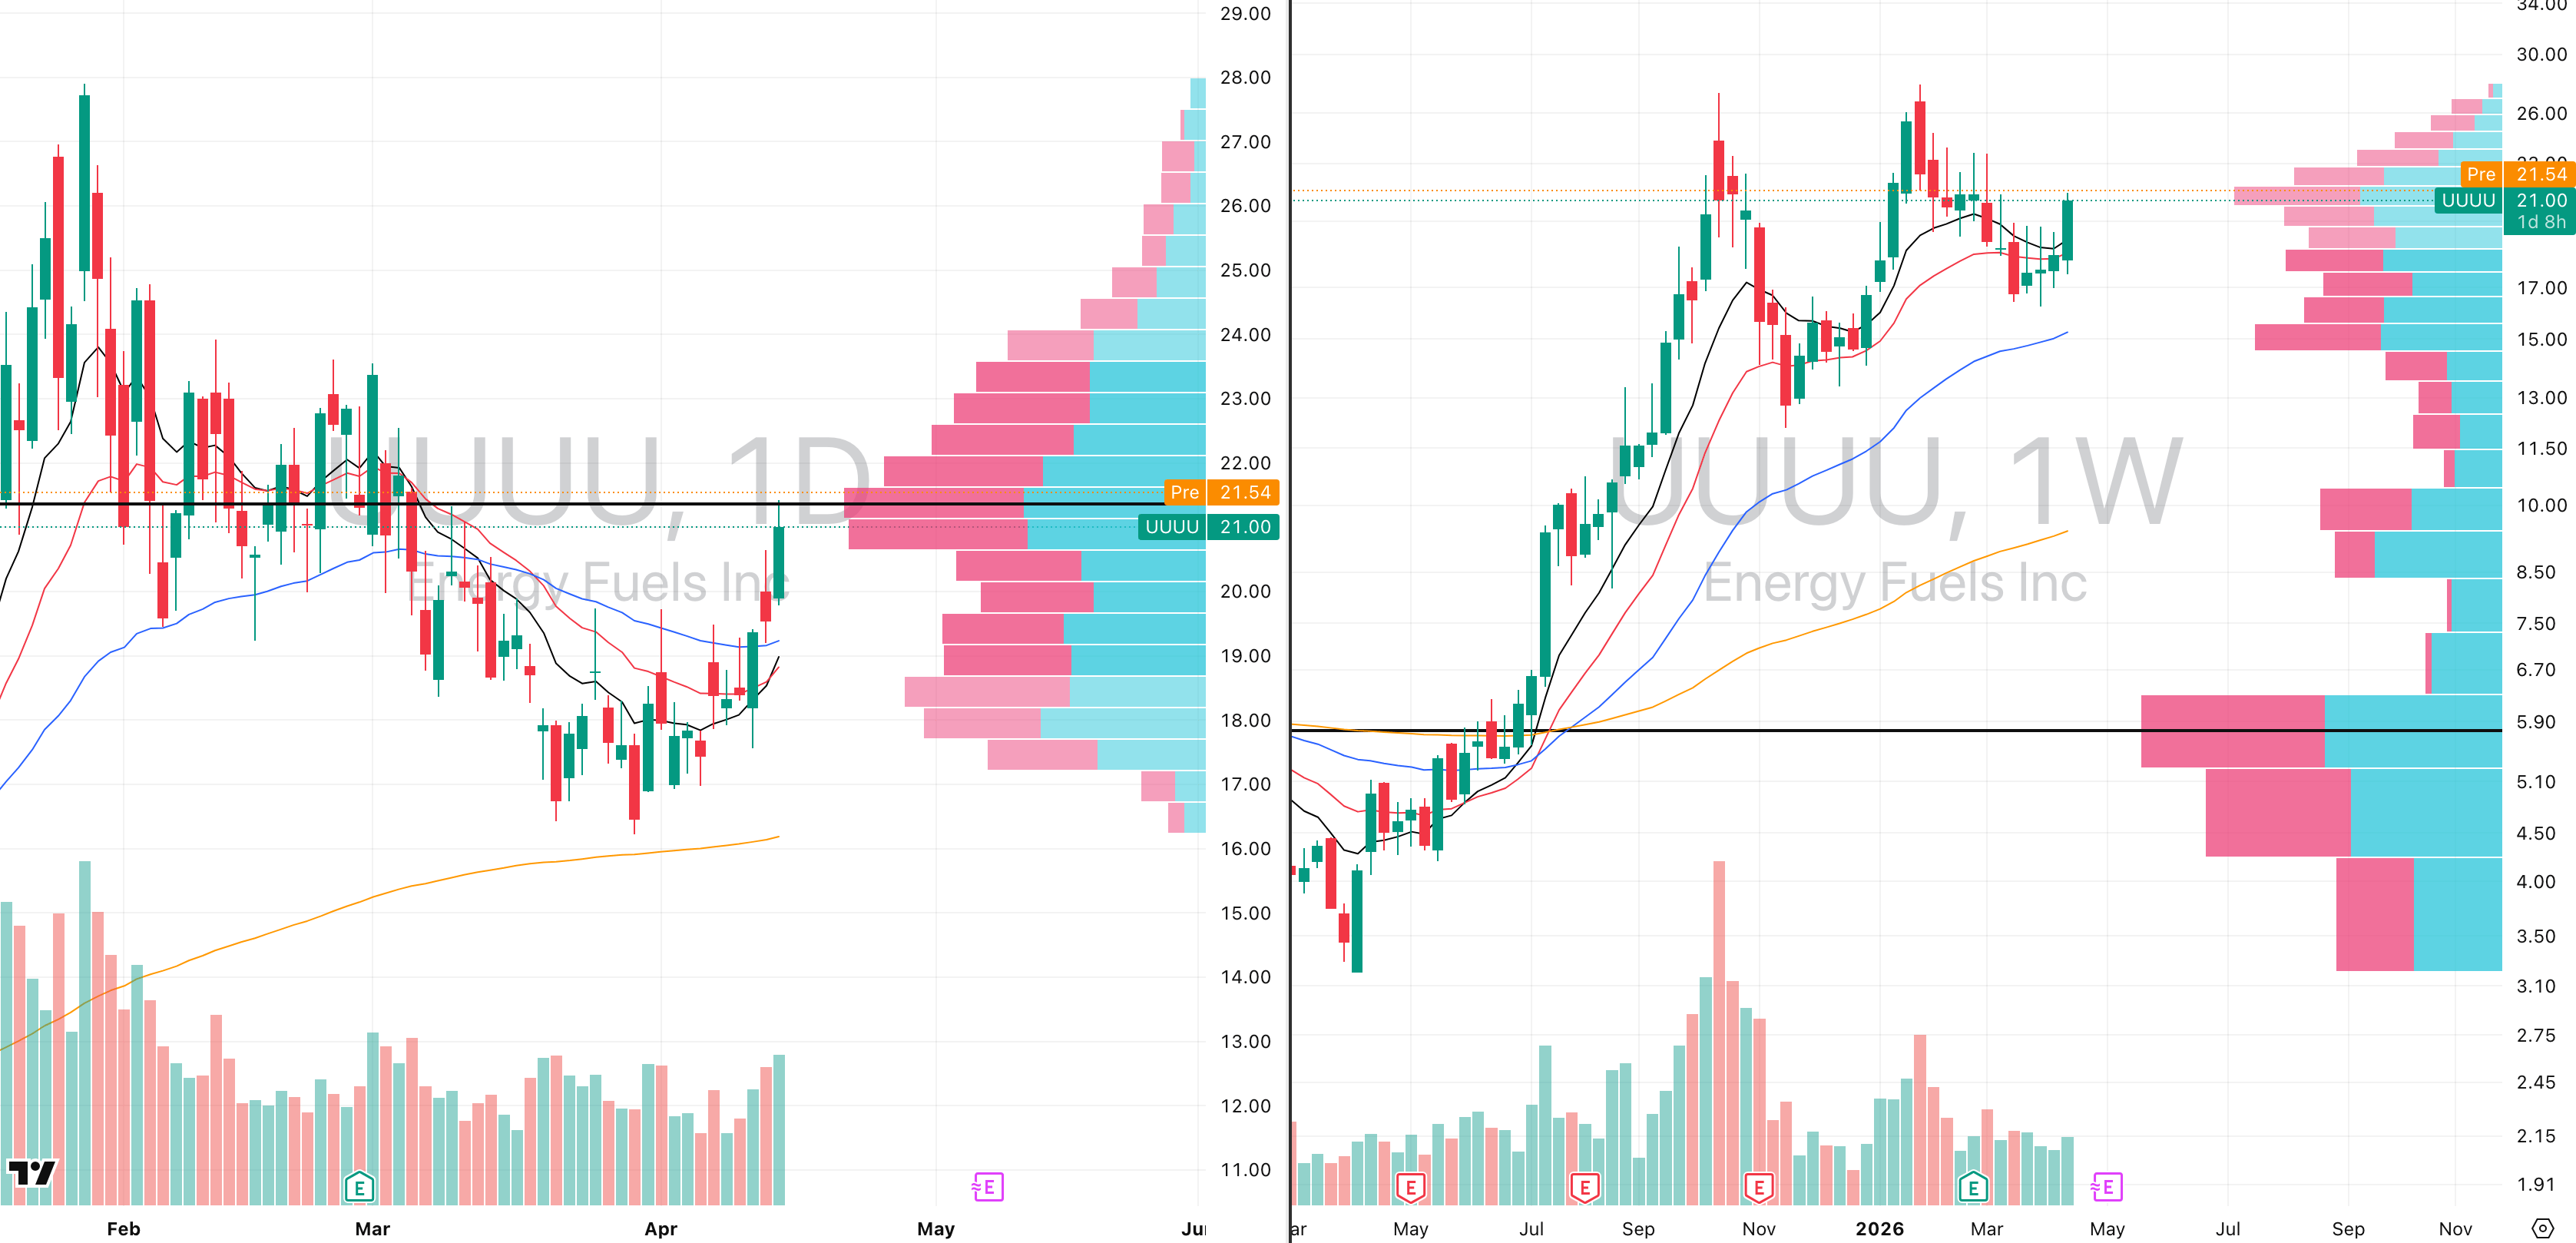
UUUU VRVP Daily & Weekly Chart
Semi-Modular Reactor Stocks To Track:
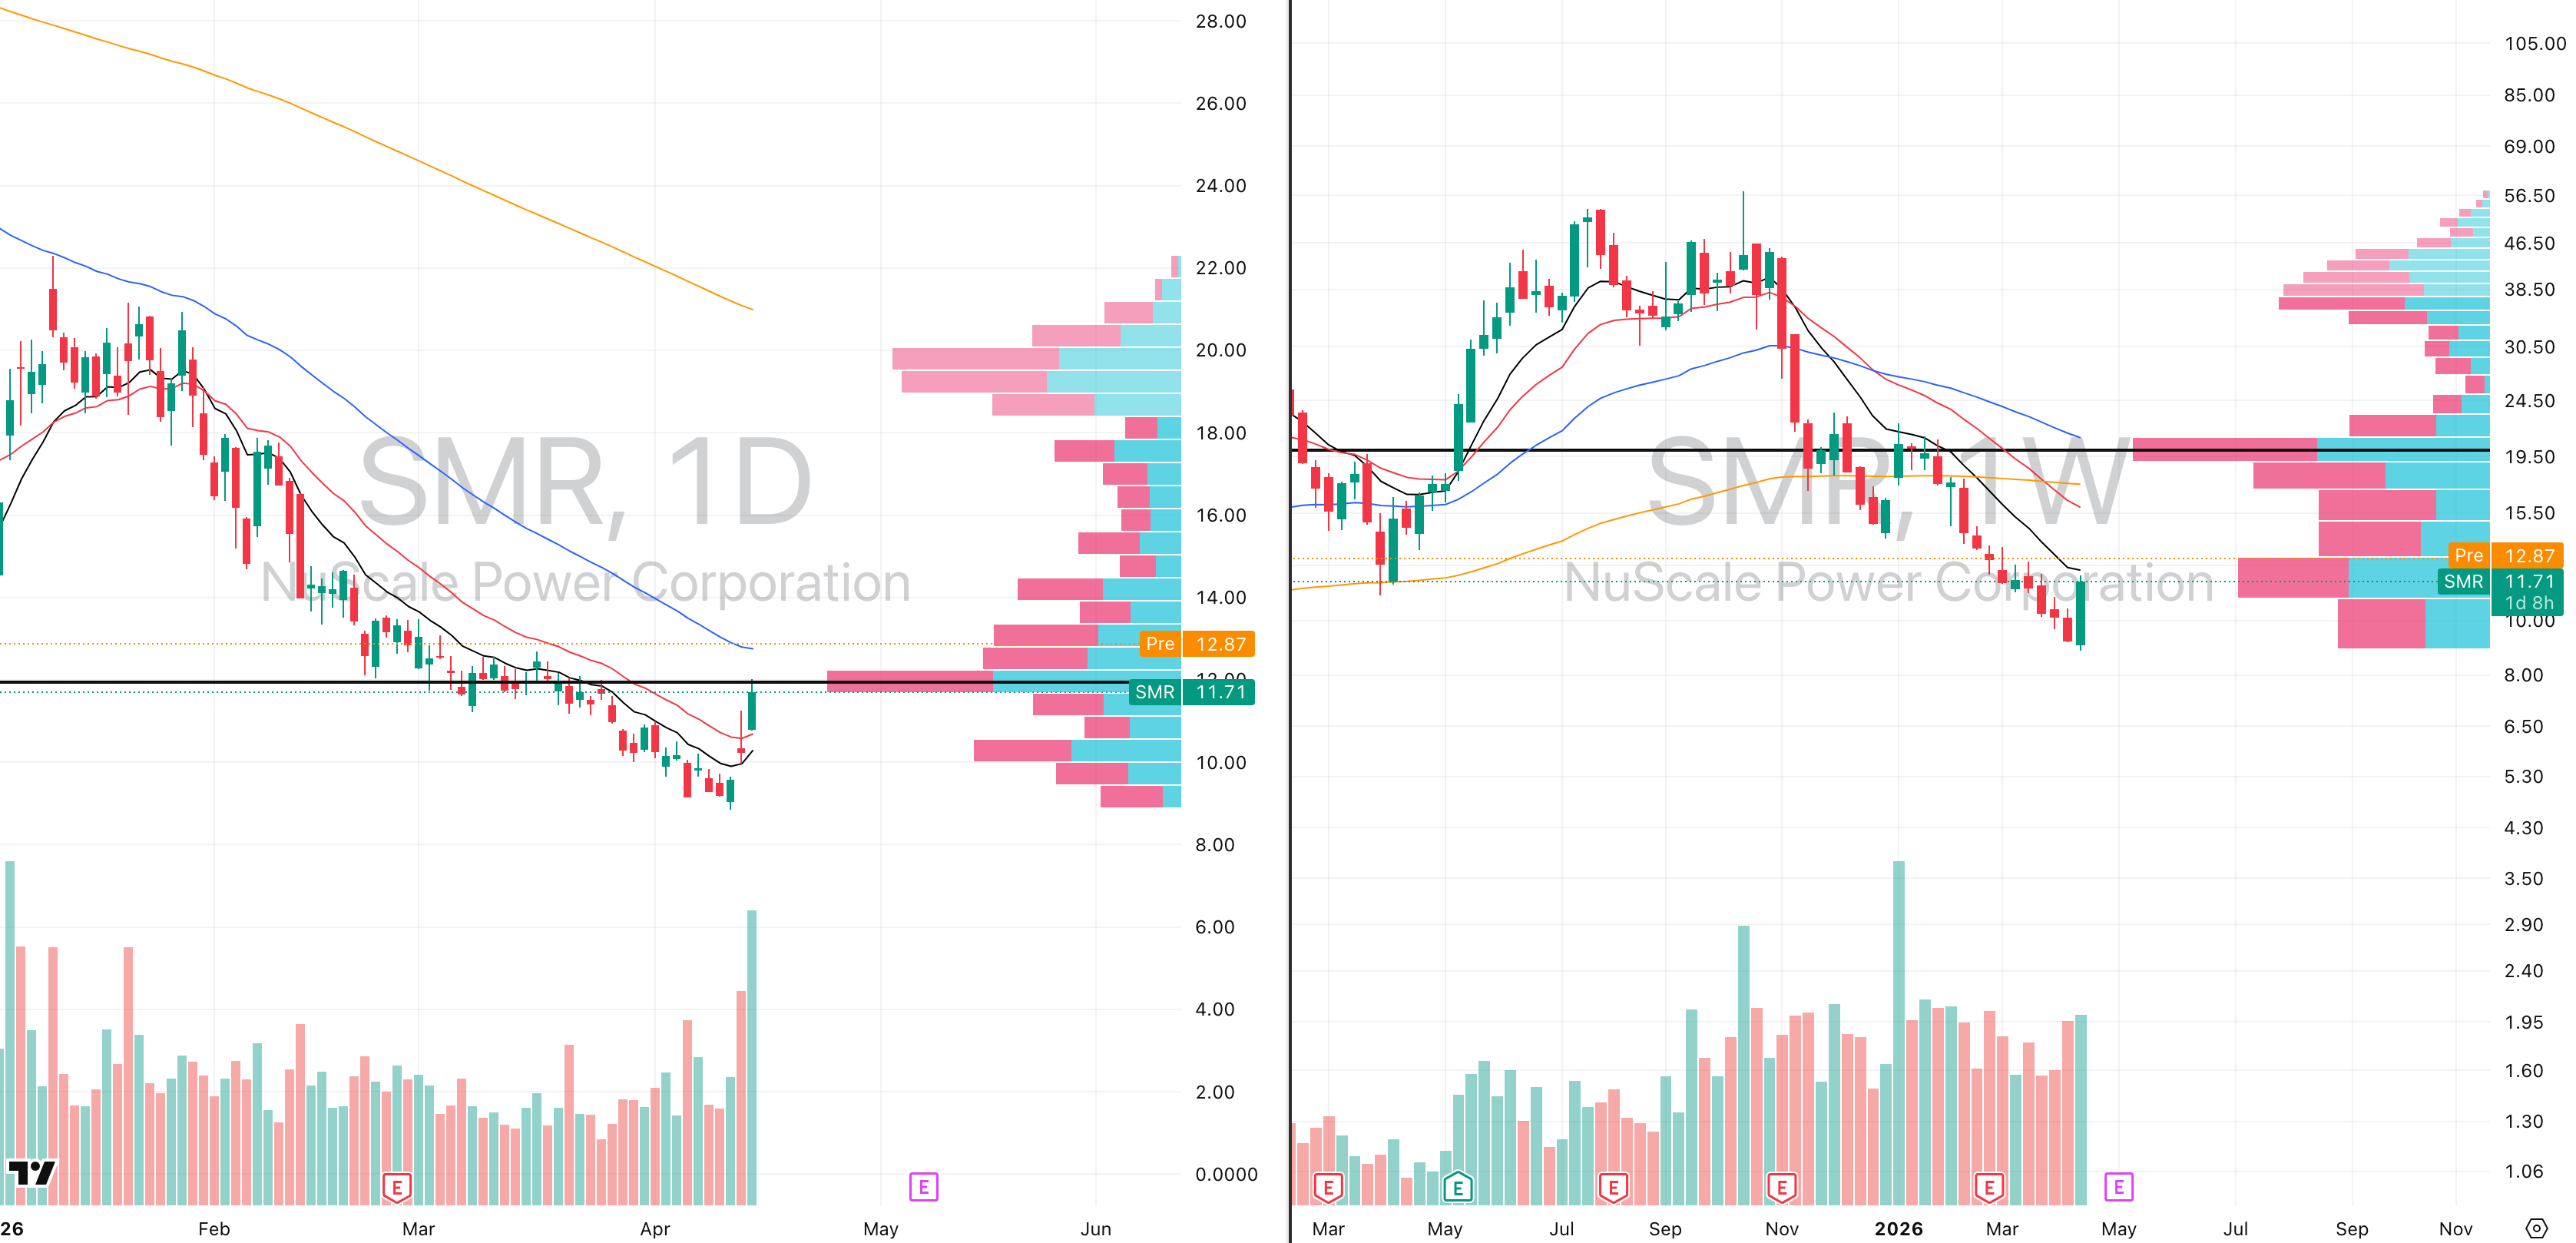
SMR VRVP Daily & Weekly Chart
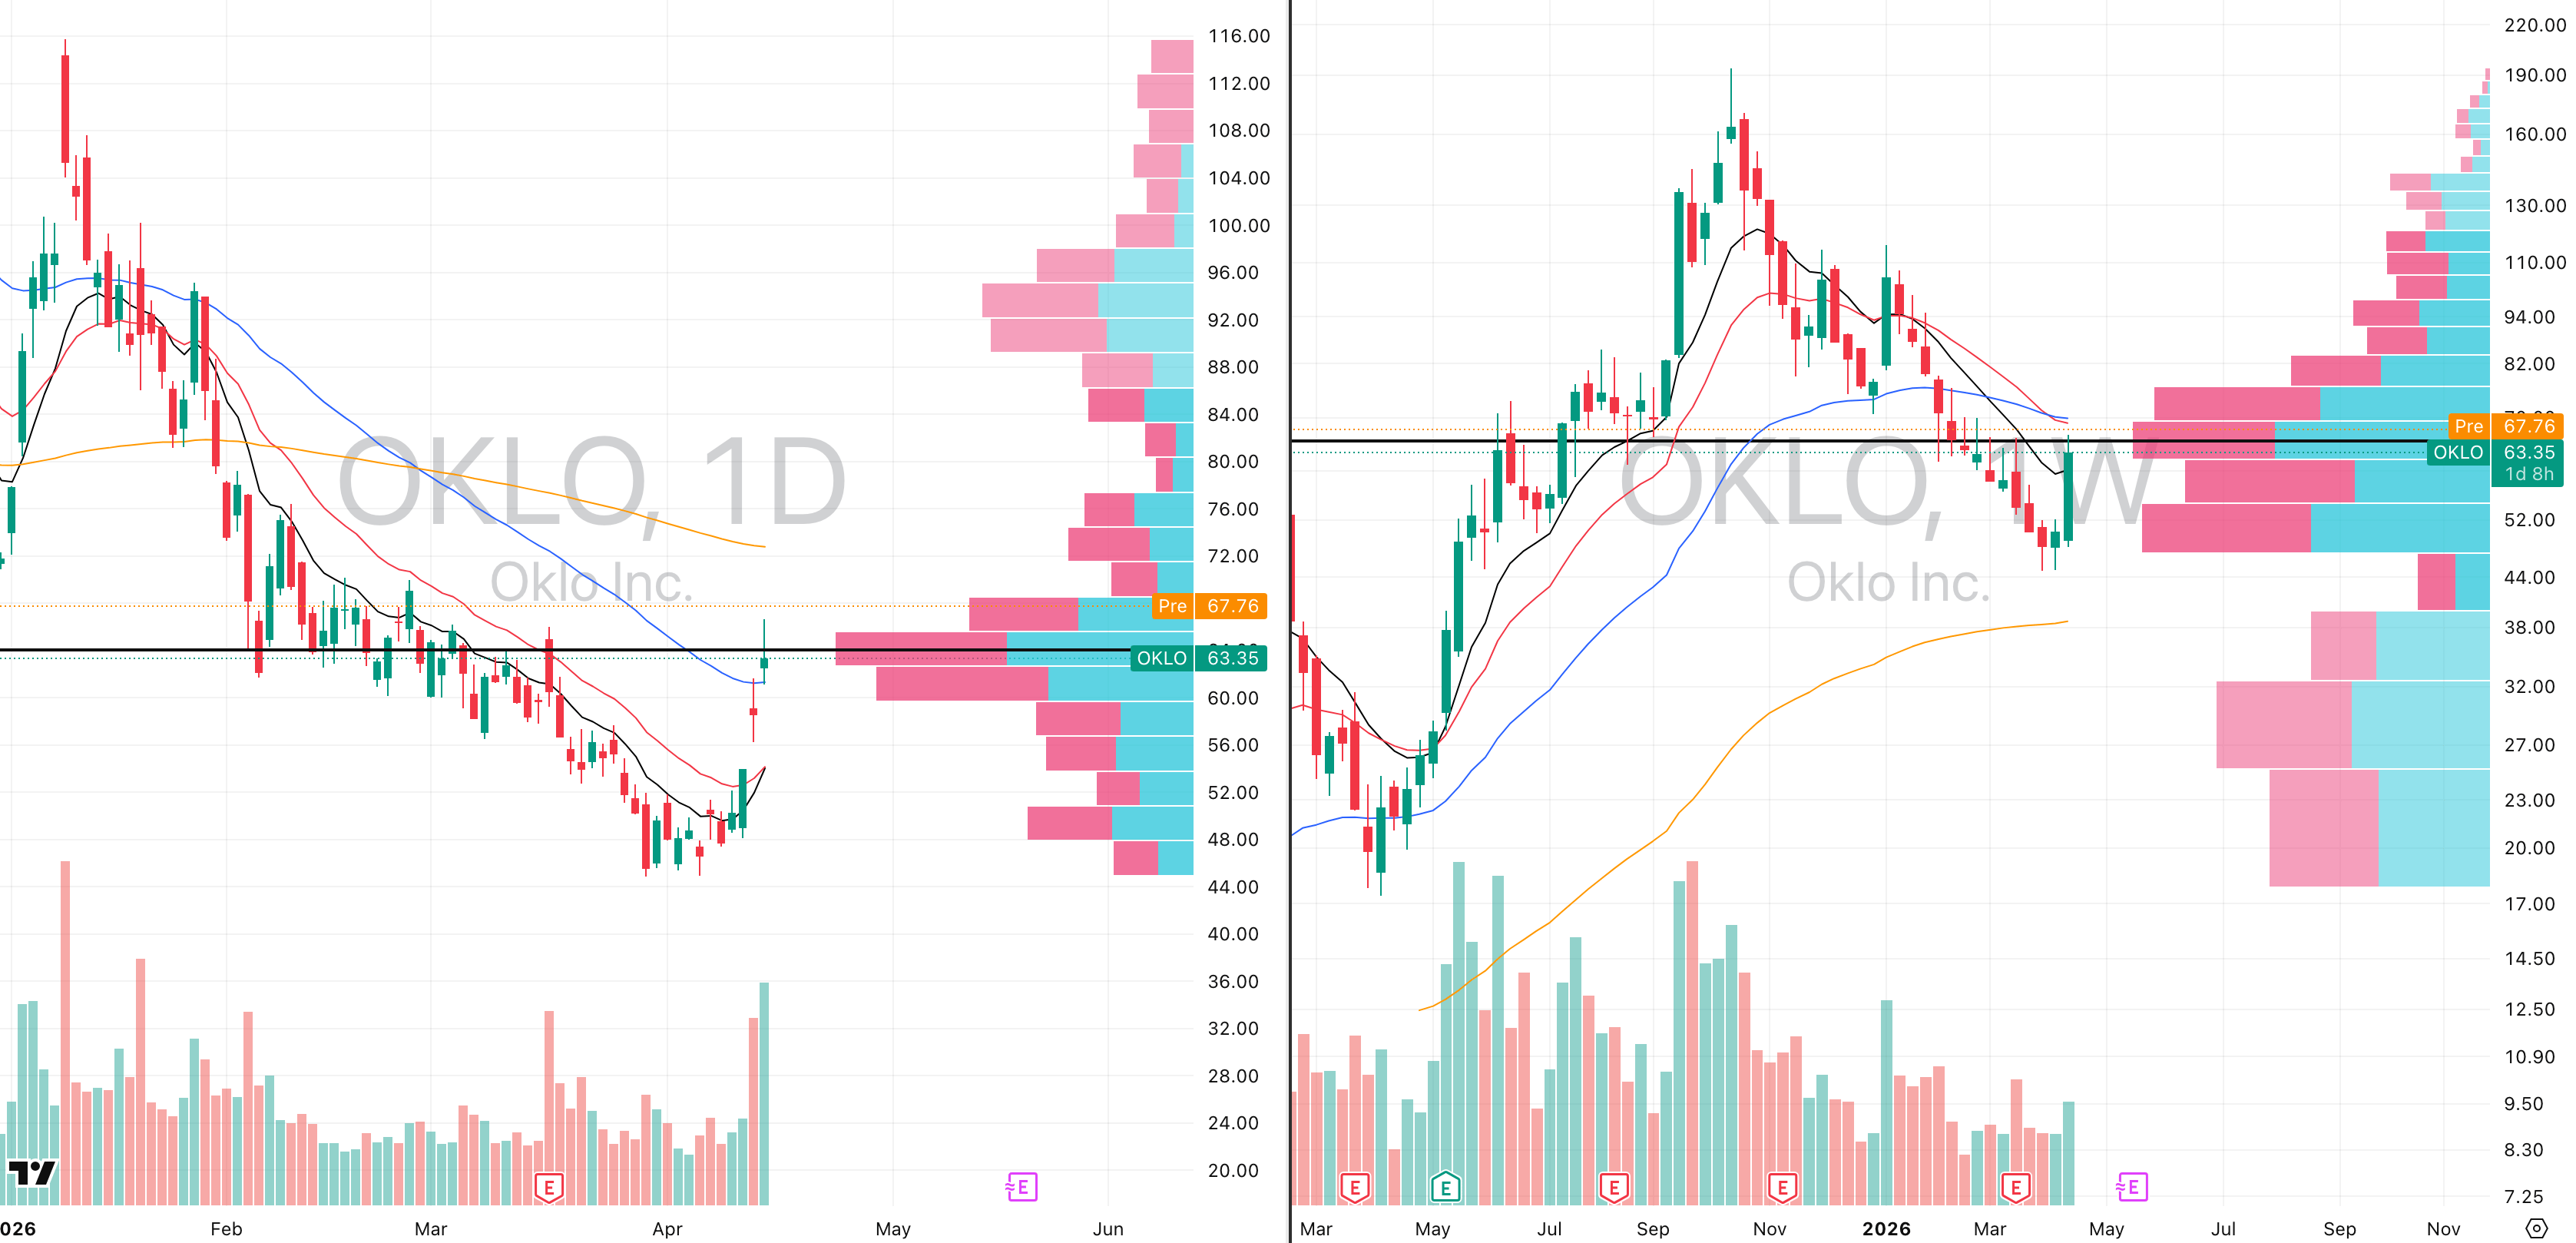
OKLO VRVP Daily & Weekly Chart

Did you find value in today's publication?This helps us better design our content for our readers |
Reply