- Swingly
- Posts
- Why This Still Looks Lower
Why This Still Looks Lower


MARKET ANALYSIS
Here’s What You Need To Know

Futures are attempting a rebound this morning, but the move comes only after a very heavy liquidation session and should be viewed in context: the market is still heading into a third consecutive losing week, which tells you the broader tape remains fragile rather than repaired.
The immediate reason for the premarket bounce is simple: oil has eased slightly after yesterday’s surge, with WTI back near $92–94 and Brent slipping just below $100 after briefly trading above that key psychological level.
That relieves pressure at the margin, but it does not solve the core issue, because energy remains dramatically elevated relative to where it traded only a few weeks ago.
The market is still trading almost entirely around one variable: whether the Strait of Hormuz disruption becomes prolonged. That is why every oil downtick currently produces relief in equities and every oil spike immediately hits risk assets again.
The broader concern is that even though the U.S. continues trying to stabilize supply through waivers and diplomatic pressure, the market still does not believe the supply shock is fully resolved. As long as crude remains near triple digits, inflation risk stays elevated.
That inflation pressure is exactly why this morning’s macro data matters less than it normally would. PCE came broadly in line with expectations, which on paper should be supportive, but the market understands that inflation data is backward-looking while energy is repricing in real time.
The more important macro surprise was growth: Q4 GDP was revised sharply lower to just 0.7%, down from 1.4% previously. That is a meaningful slowdown and confirms that the economy had already begun losing momentum before the latest geopolitical pressure even arrived.
That leaves markets in an uncomfortable position: inflation is not collapsing enough to force easy policy, while growth is slowing enough to weaken confidence.
As a result, rate-cut expectations continue getting pushed further out. Traders are increasingly pricing only one cut late in the year, because oil near $100 makes it difficult for the Federal Reserve to justify easing aggressively.
This is why the market reaction remains unstable: you have weaker growth, sticky inflation, and geopolitical energy risk all hitting at once, a combination that rarely allows clean directional equity trends.
Gold, interestingly, is not behaving like panic would normally suggest. Despite all the geopolitical stress, gold is still struggling to expand meaningfully higher, which tells you capital is not yet moving into safety in a fully committed way.
Bitcoin and crypto-linked names are seeing some premarket support, with Coinbase and crypto beta stocks higher, largely because Bitcoin continues holding above its recent breakout zone. That remains one of the few pockets of tactical strength this morning.
The key takeaway is that today’s premarket bounce should not automatically be read as risk returning. At this stage, it is simply a response to oil easing slightly after an extreme move, while the broader macro structure remains unresolved.
Nasdaq
QQQ VRVP Daily & Weekly Chart
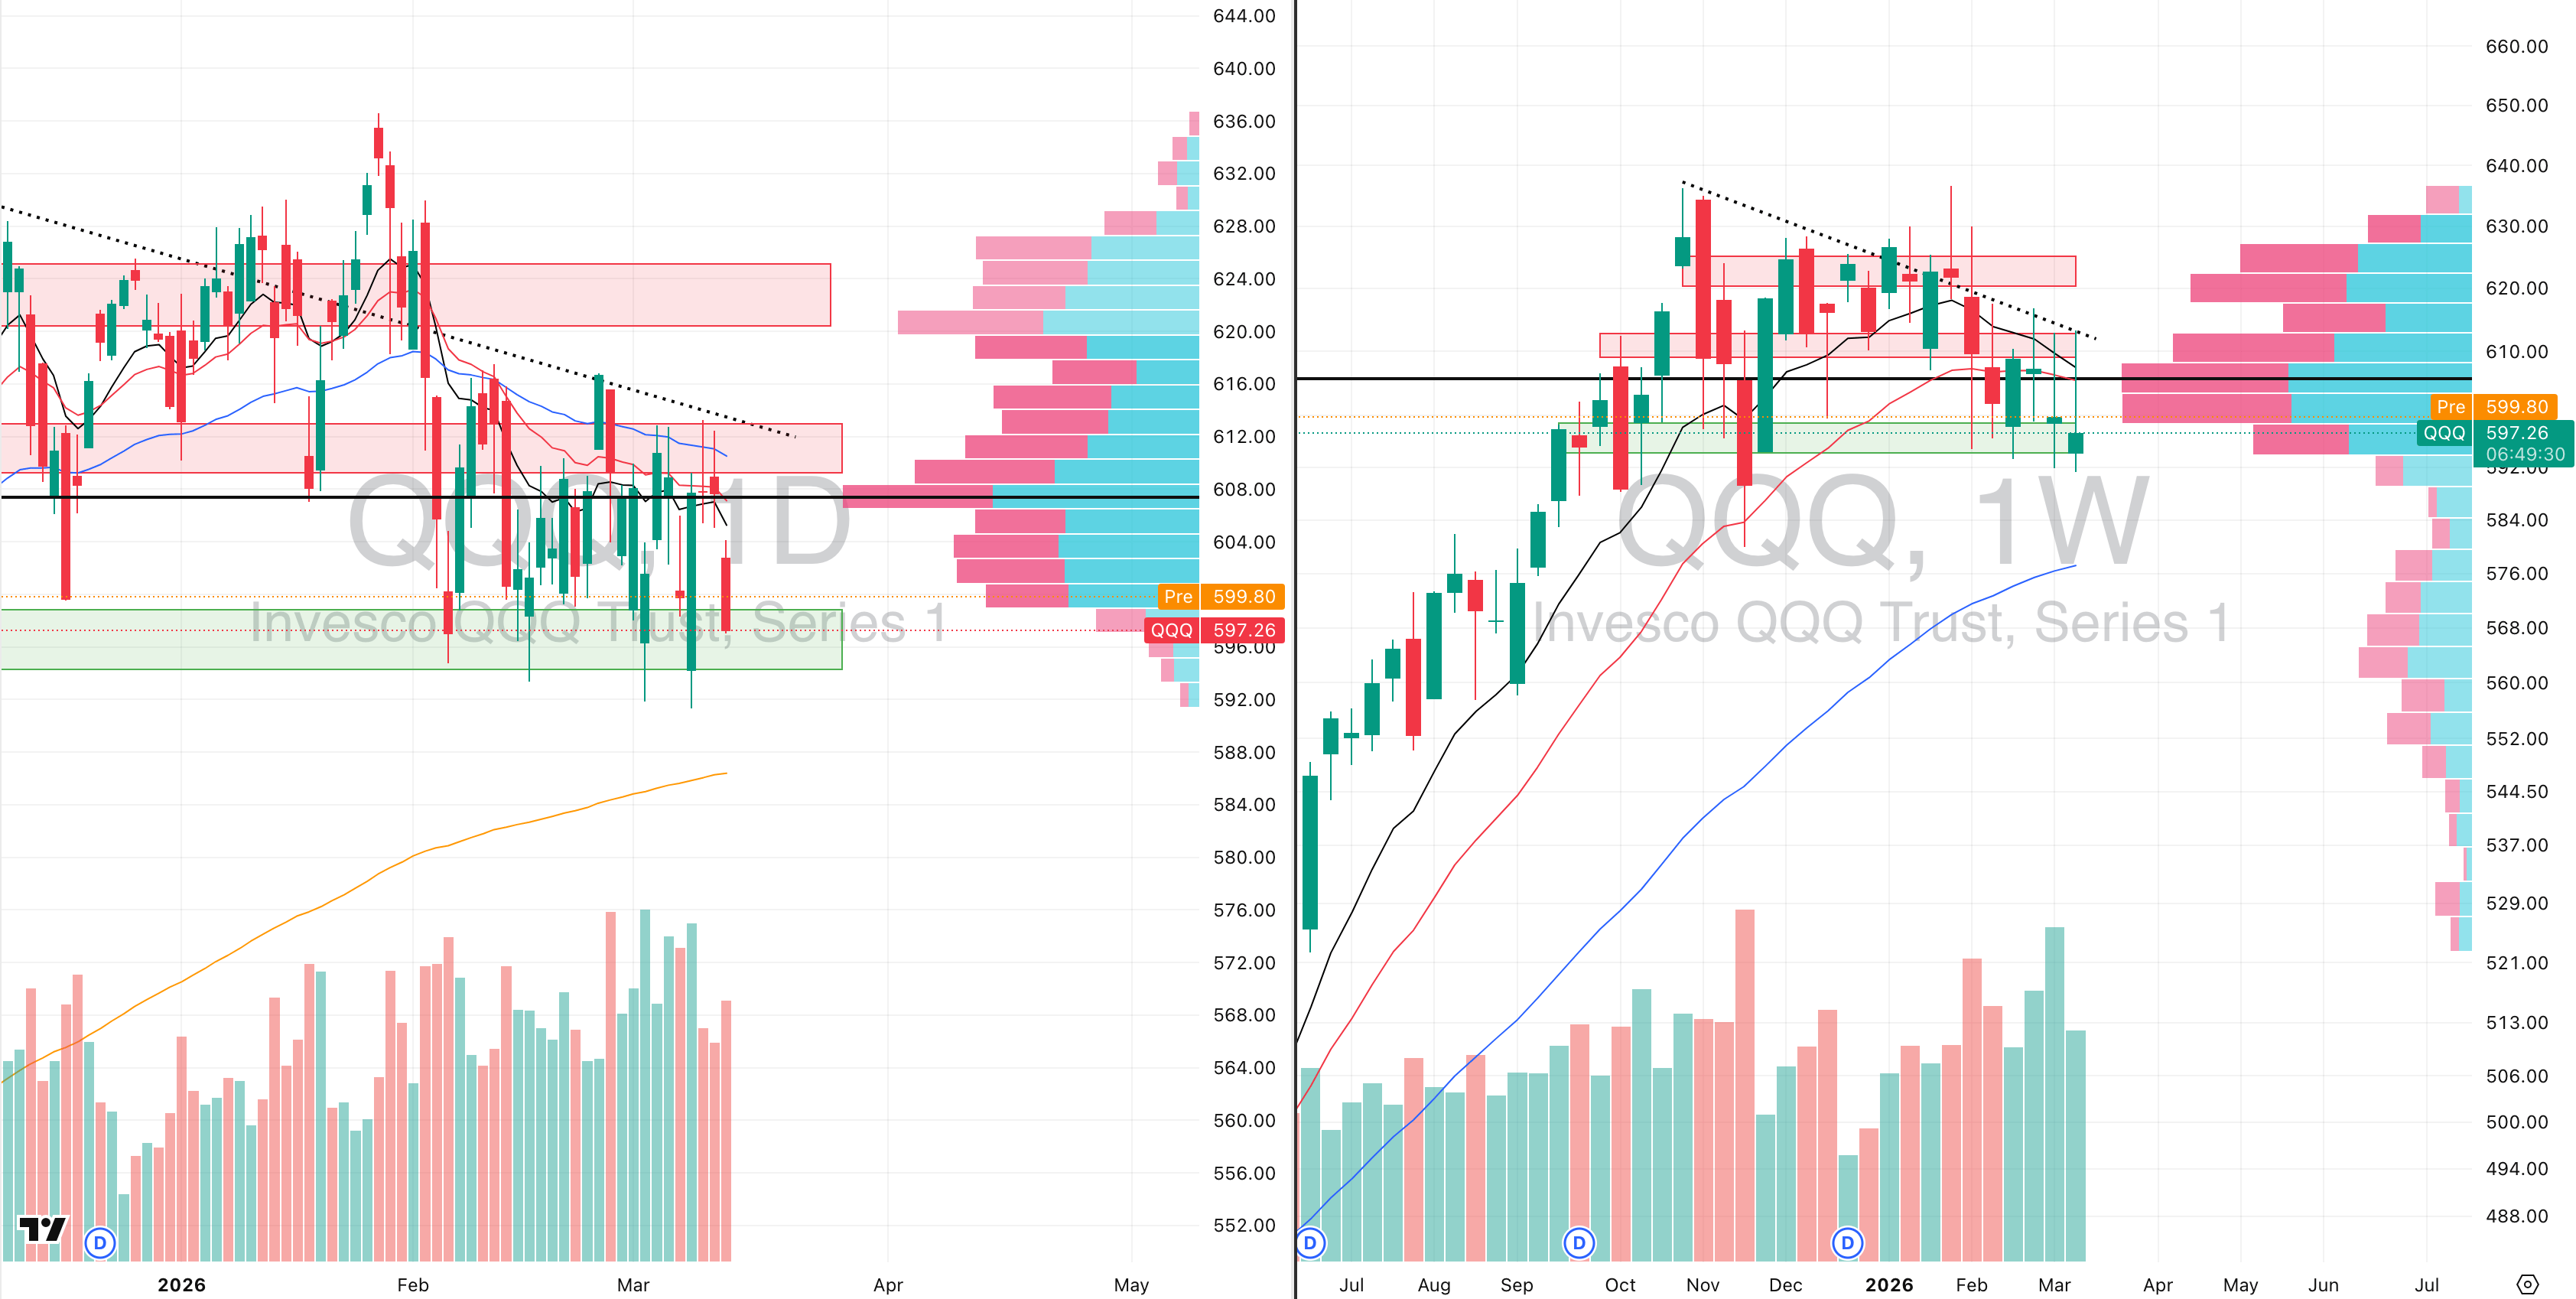
25.74%: over 20 EMA | 28.71%: over 50 EMA | 44.55%: over 200 EMA
The QQQ had a painful session yesterday and largely followed the path we outlined, opening with a gap lower and then moving directly into the $594 to $598 demand zone, which is the same area where price repeatedly found support through early February.
That zone matters because it has acted as the most obvious near-term demand shelf for over a month, but the quality of yesterday’s move suggests that support is being tested under pressure rather than being defended with conviction.
Relative volume finished at 113% of the 20-day average, which means this was not simply another weak drift lower — there was genuine participation behind the downside move.
On the weekly chart, the rejection of $613 remains the defining technical event. That level has now acted as a descending resistance zone for months, and this week’s failure there leaves QQQ more than 3.5% below that rejection point, confirming that sellers continue stepping in every time price attempts to reclaim higher ground.
Structurally, the ETF is now increasingly behaving like a stage 3 rollover, where prior trend support begins failing and rallies lose follow-through rather than extending.
Our base expectation remains a further move lower toward the rising 200-day EMA near $586, which is roughly 1.9% lower from here and almost exactly one average daily range away.
That level is the first place where a more meaningful technical reaction could develop because it combines long-duration trend support with a much cleaner institutional reference point.
S&P 400 Midcap
MDY VRVP Daily & Weekly Chart
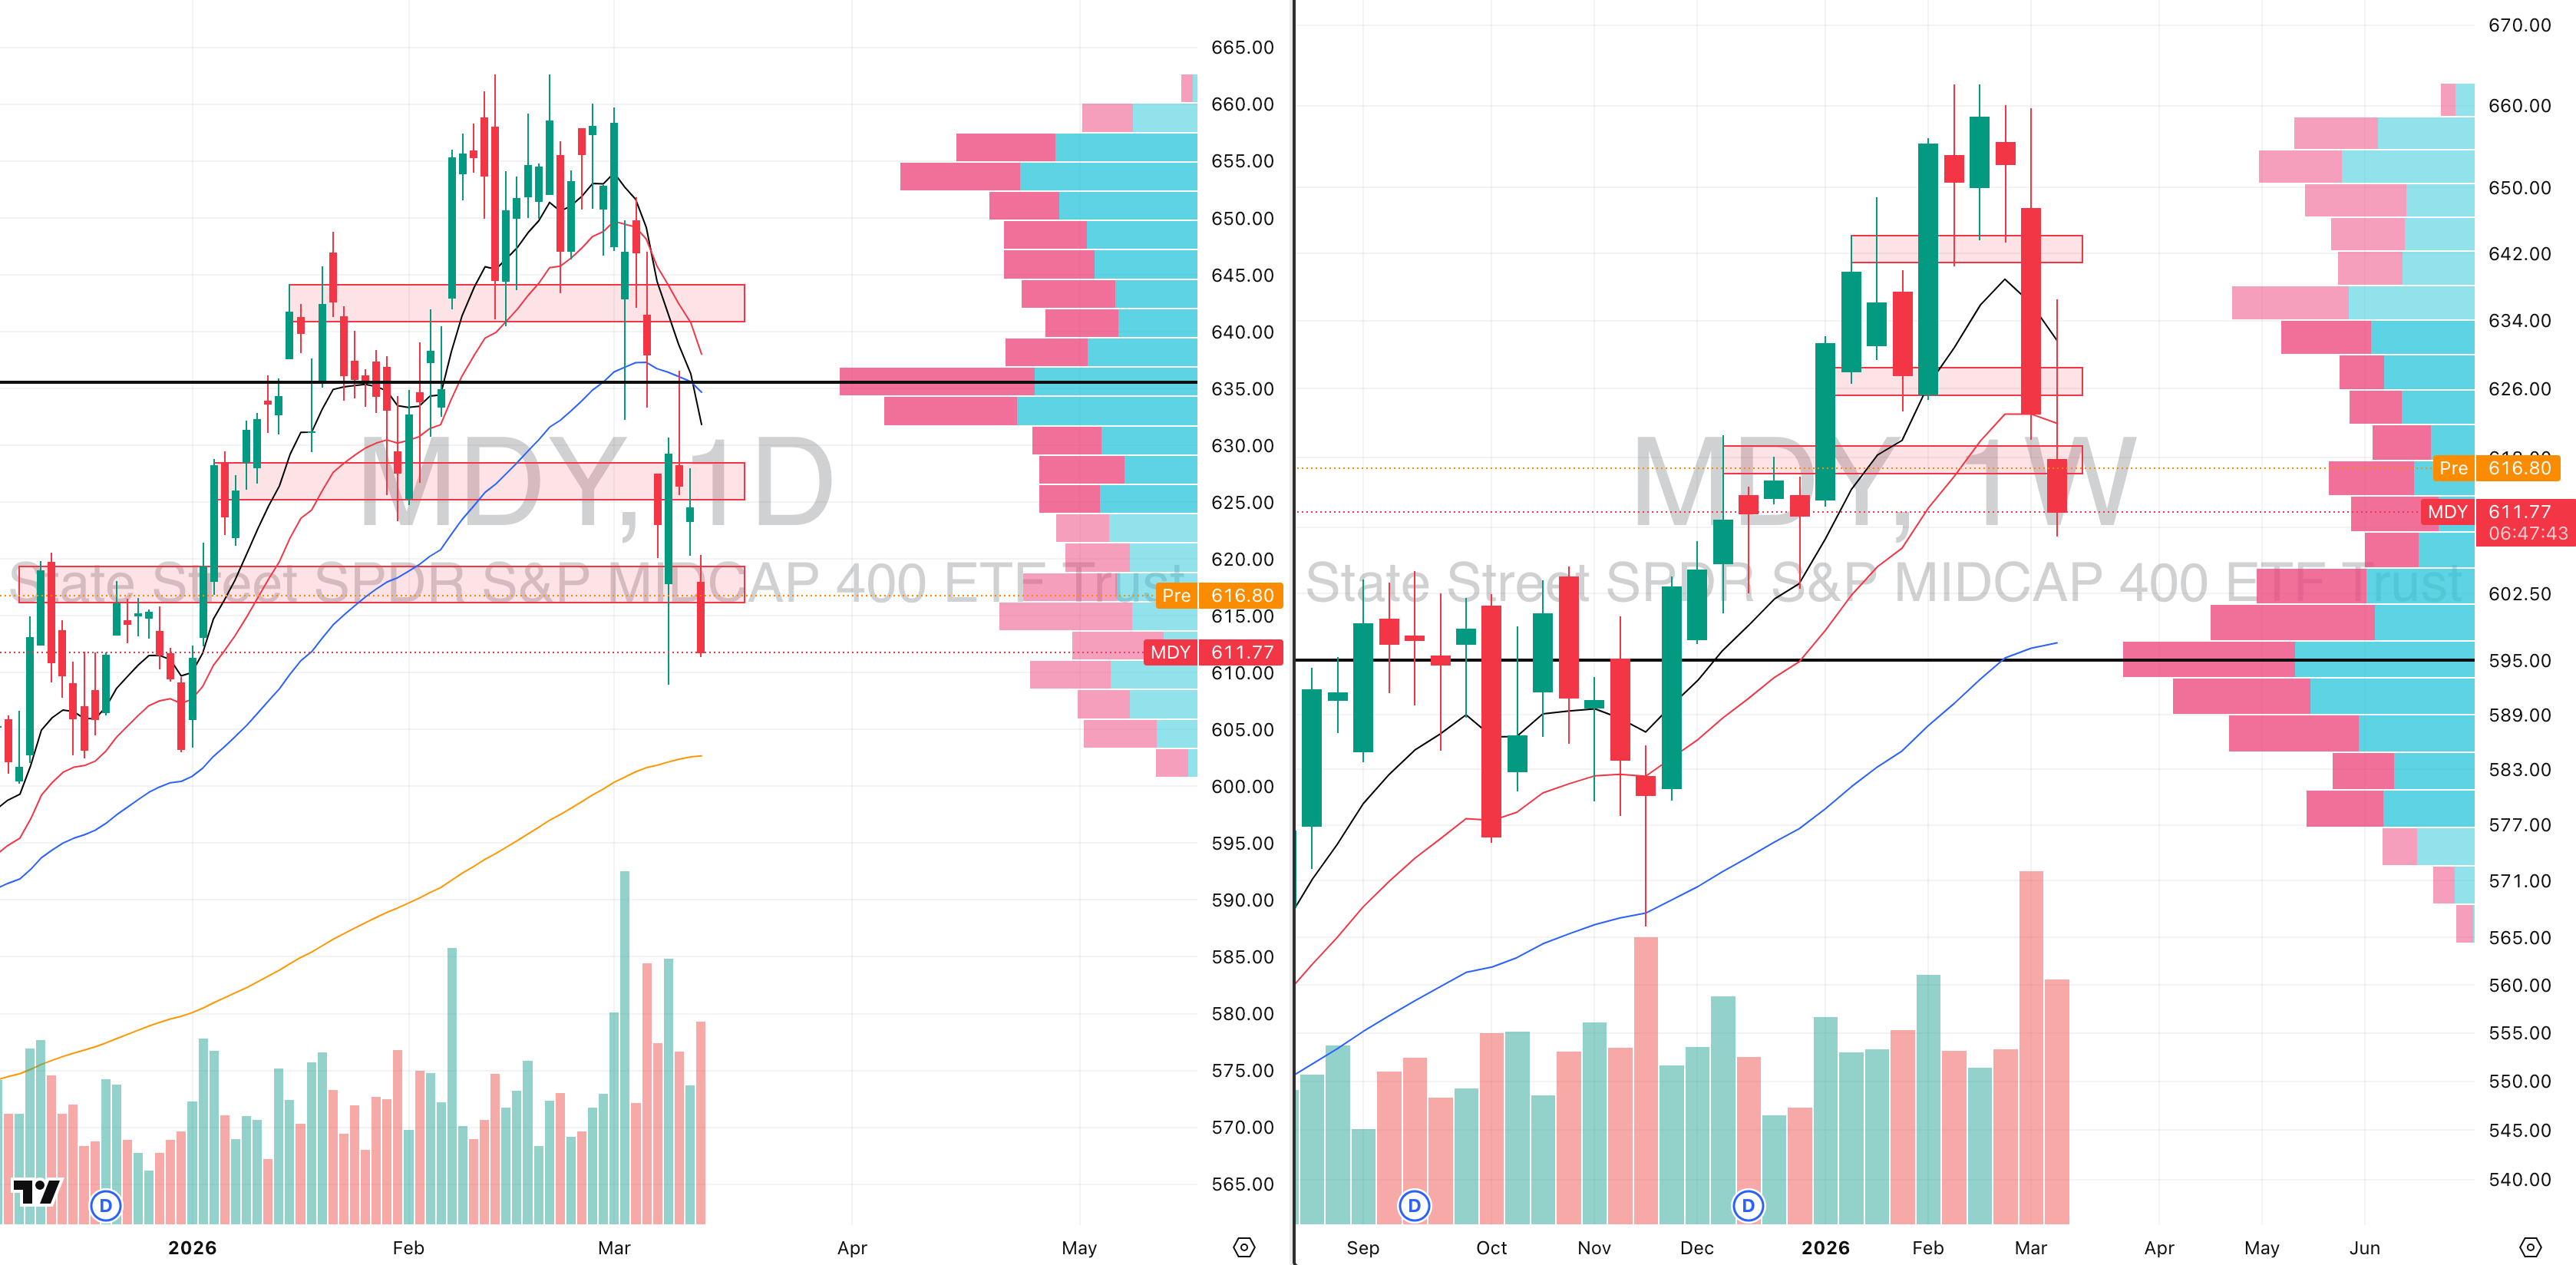
17.25%: over 20 EMA | 26.00%: over 50 EMA | 48.56%: over 200 EMA
MDY delivered another acceleration lower yesterday, and importantly it did so with much greater force than prior sessions.
The intraday range exceeded 2%, which is materially larger than its current 1.7% ADR, meaning volatility is now expanding beyond normal daily behavior.
Relative volume came in at 145%, which confirms that sellers remained highly active throughout the move rather than simply fading price passively.
Although futures are attempting a bounce this morning, the broader structure still suggests that any rebound is likely to struggle because supply overhead remains extremely heavy after repeated failed rallies.
At this stage, MDY is behaving like a very aggressive stage 4 breakdown, where downside momentum is still accelerating rather than stabilizing.
The weekly candle reinforces that view: the ETF is already down more than 4.4% this week, which is significantly larger than its normal weekly range and confirms that selling pressure is still expanding rather than compressing.
Until price begins producing tight closes and lower volatility, this remains a market where rallies are likely to be sold rather than trusted.
Russell 2000
IWM VRVP Daily & Weekly Chart
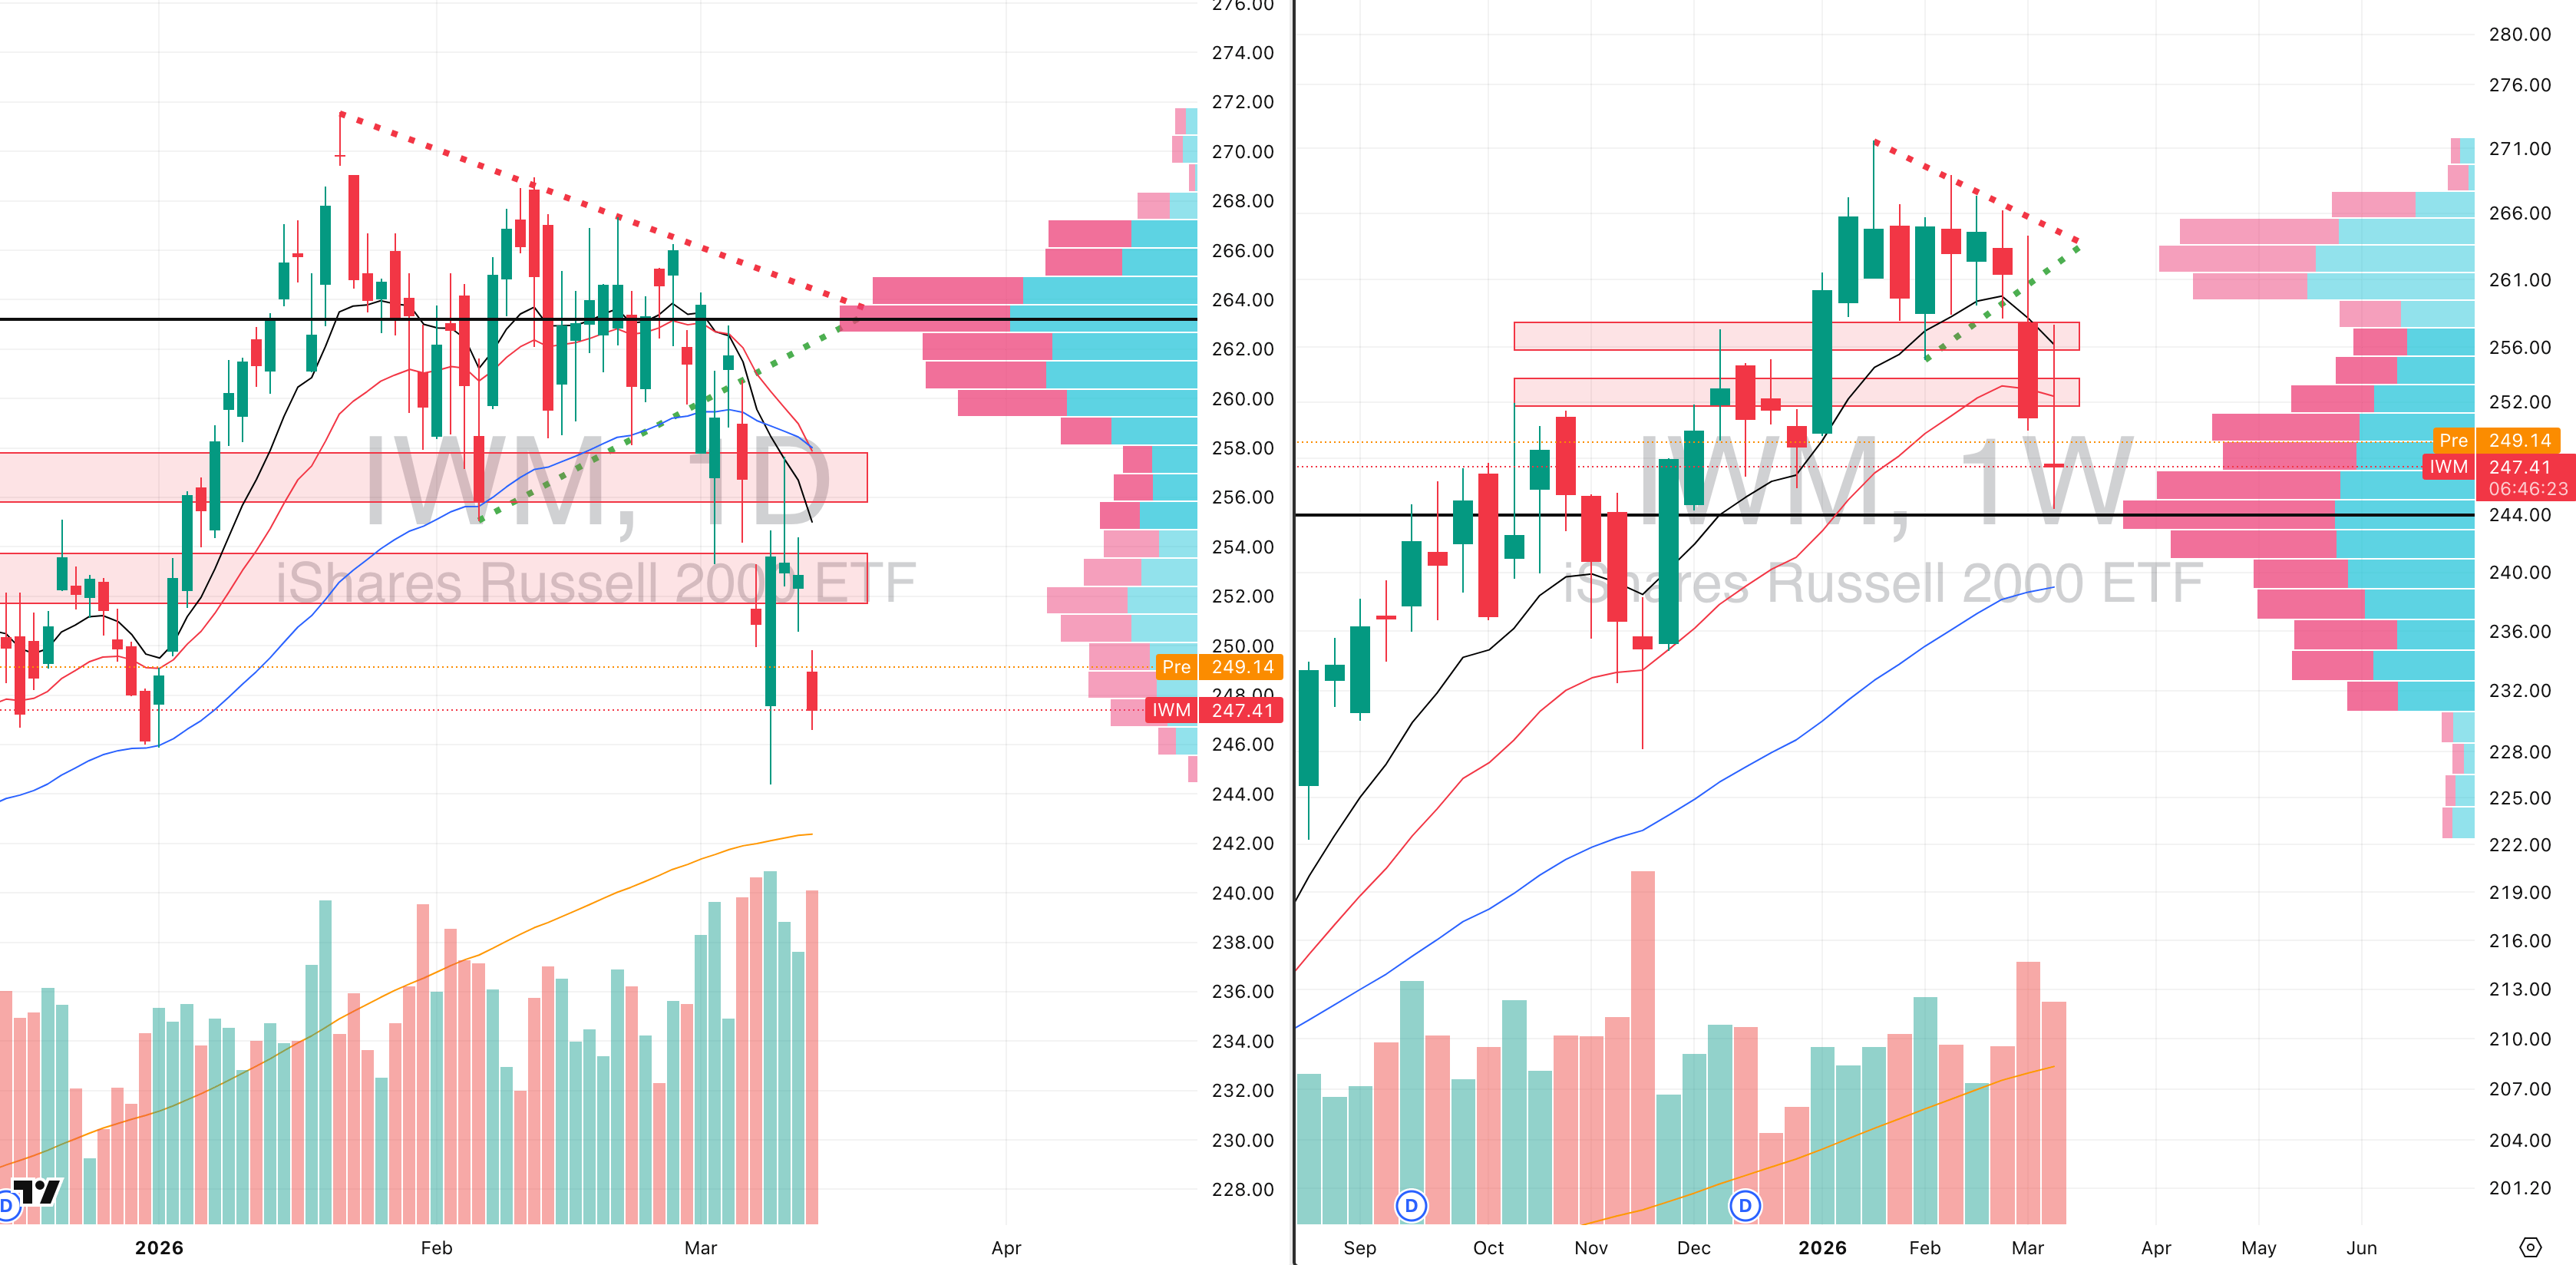
22.79%: over 20 EMA | 27.75%: over 50 EMA | 27.75%: over 200 EMA
IWM is showing the same broad weakness as MDY, although the breakdown remains slightly less violent in absolute terms.
Yesterday’s range still exceeded its normal 20-day ADR, and that happened on 146% relative volume, which tells you participation expanded again on the downside.
The weekly structure remains particularly weak because the ETF sharply rejected the $258 area, where both the declining 10-week EMA and 20-week EMA continue to cap price.
That rejection leaves small caps in the same technical position as mid-caps: rallies are failing quickly, while downside momentum remains dominant.
Our base expectation remains a move toward the rising 200-day EMA near $243, which is roughly 2.5% lower and represents about 1.5 times normal daily range
That level is the first major area where price could begin stabilizing because it combines long-term trend support with visible historical demand.
FOCUSED STOCK
META: Breaking A 51 Day Support
META VRVP Daily & Weekly Chart
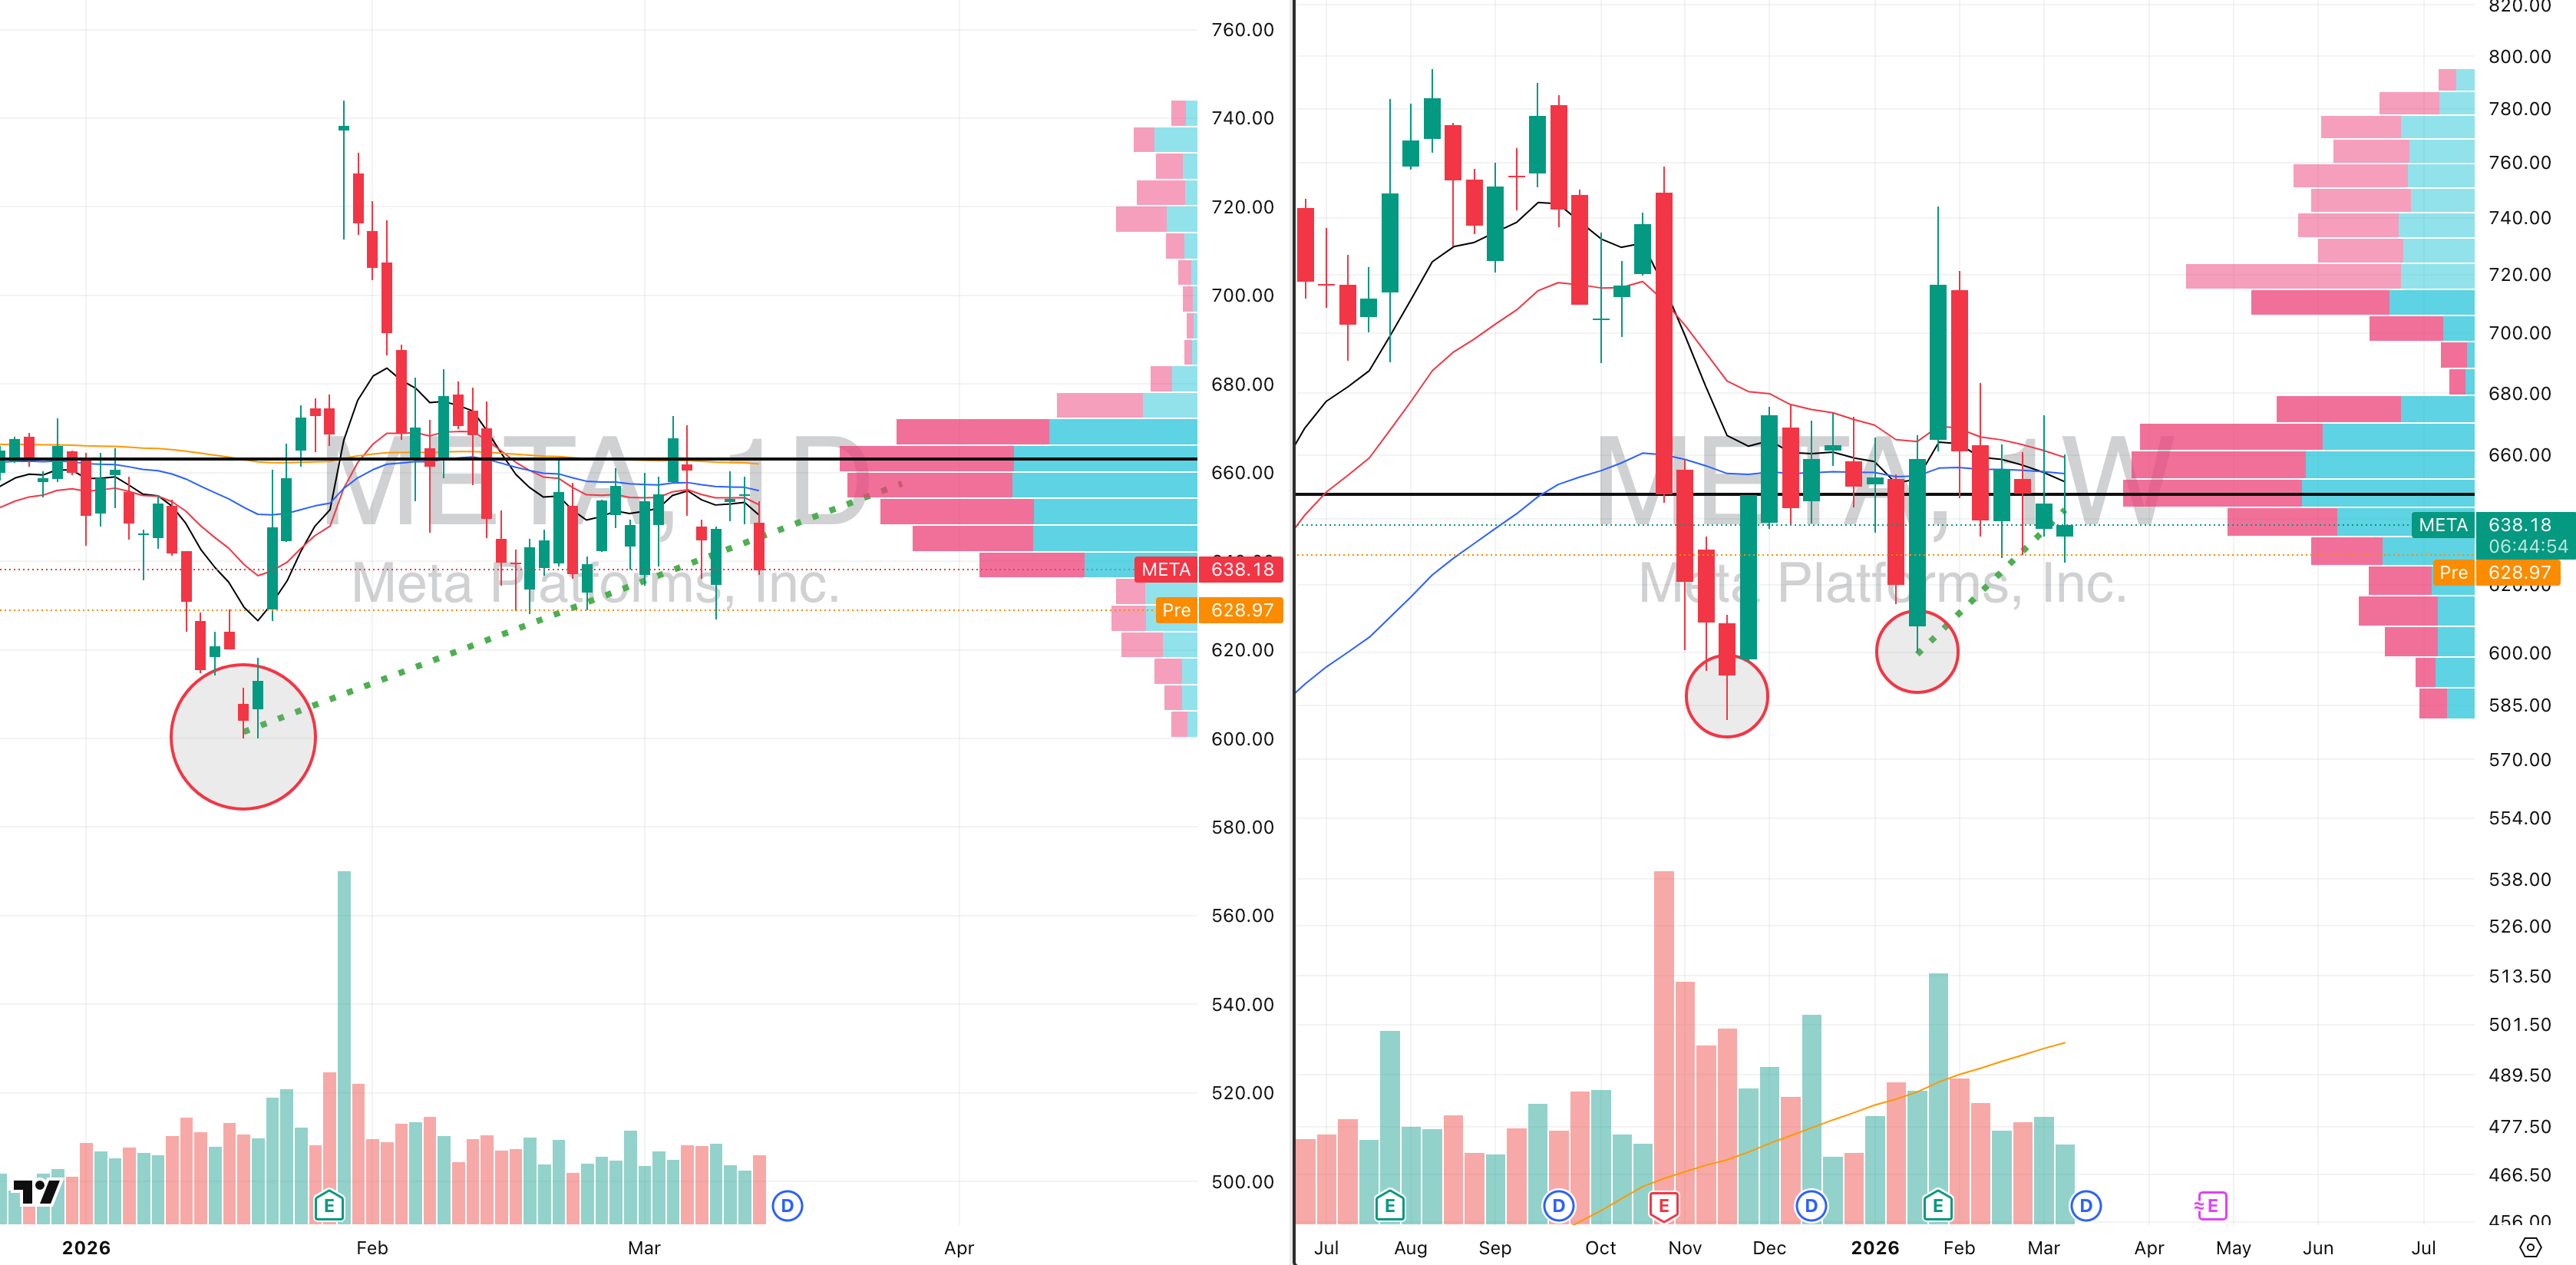
ADR%: 2.47% | Off 52-week high: -22.1% | Above 52-week low: +29.3%
Meta is becoming increasingly important here because it sits at the center of what XLC is doing, and right now both structures are beginning to weaken together.
The key level is the rising support line that had held for 51 consecutive trading days. That support is now breaking, which immediately changes the character of the chart because a level that repeatedly attracted demand is now starting to fail.
When a support line holds for that long and then begins to break, the first implication is always that the market is reassessing value at a higher level and no longer willing to defend price as aggressively.
That same level is now beginning to flip into resistance, which is exactly the type of character change that often produces a much sharper downside move.
This matters even more because Meta is the largest component inside XLC, and XLC itself is now beginning to lose structure. If Meta weakens decisively, the entire communication sector becomes vulnerable.
From a trading standpoint, the best short entry was yesterday when the initial breakdown began and price first lost that rising support.
At current levels, caution matters much more because the stock is opening with a gap, and that immediately introduces the possibility of an intraday gap-fill move before trend continuation.
The cleaner approach is to let the first 15 minutes trade out, because if buyers attempt to fill the gap early and fail, that often gives the higher-quality intraday entry.
If that early recovery cannot hold and yesterday’s broken support starts acting as resistance, this can become a very explosive downside trade quickly because the structure underneath is now much weaker than it has been for nearly two months.

Did you find value in today's publication?This helps us better design our content for our readers |
Reply