- Swingly
- Posts
- Why This Market Is Hard Right Now
Why This Market Is Hard Right Now
In partnership with


MARKET ANALYSIS
Here’s All You Need To Know

U.S. index futures are flat following two consecutive down sessions in the S&P 500, reflecting a pause in momentum rather than a shift to risk-off.
While price remains elevated, we are not seeing the upside follow-through that strong breakouts typically deliver, particularly after the aggressive two-week advance earlier this month.
A growing number of recent breakouts have failed or stalled shortly after triggering:
This has been most visible in parts of the AI and non mega-cap tech complex
Several leaders pushed into supply, reversed, and are now below their breakout levels which is not a good sign
That said, the pullback itself has been controlled:
No broad expansion in downside volume
No signs of forced liquidation
Weakness has largely been met with buyers stepping in at logical support levels
From a purely trend perspective, the market remains still constructive:
Major indices are still holding rising short- and intermediate-term moving averages
Prior breakout levels are being tested, not decisively broken down broadly
The broader market is digesting gains rather than giving them back
We are not getting clean upside continuation yet but we are also not seeing aggressive downside follow-through
This keeps the market firmly in consolidation mode, with risk defined around key support rather than trending lower
This is a very dangerous environment to trade in and consider stepping out unless you are being extremely selective
Nasdaq
QQQ VRVP Daily & Weekly Chart

QQQE VRVP Daily & Weekly Chart
57.42%: over 20 EMA | 58.41%: over 50 EMA | 61.38%: over 200 EMA
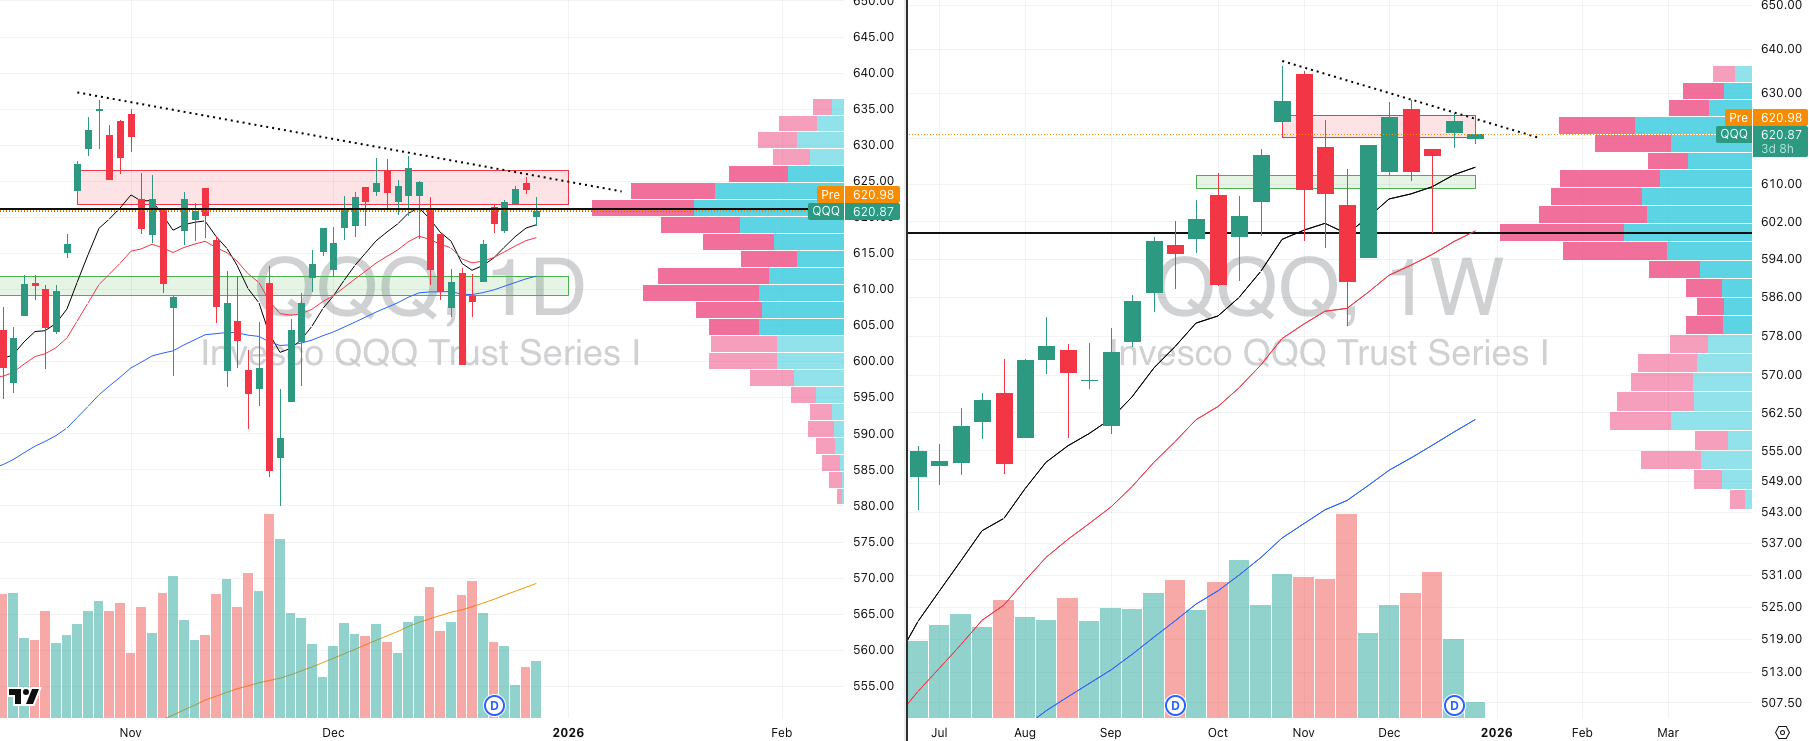
The QQQ remains in a well-defined contraction pattern that has been in place since late October.
Despite recent volatility, price action has held up well overall, especially when viewed through the lens of this broader consolidation.
Last Friday (Dec 26), QQQ rejected the declining resistance trendline at 625.72.
That rejection was followed by downside follow-through on expanding relative volume, which is important to acknowledge.
On the downside, key short-term support is holding:
The rising 10-day EMA at ~619 was respected
Today’s critical level is the 20-day EMA at ~616
A failure to hold the 20-day EMA would likely open the door to:
A move toward 611, near the 10-week point of control
This zone sits inside a low-volume pocket on the VRVP, meaning price could move there relatively quickly
From that area, a reclaim of resistance would require roughly a 3% upside move, which would take time to rebuild
At current levels, demand is still present, and the market continues to compress rather than unwind.
This type of price action is often frustrating for traders:
Breakouts stall
Follow-through is limited
Chasing momentum has consistently led to getting chopped up
Importantly, this contraction is not isolated to cap-weighted QQQ:
The equal-weighted QQQE is contracting in a very similar fashion
Both indices are moving in tandem, which is constructive and suggests participation in this base building period is more than just a handful of mega-cap names, even though mega-caps remain stronger
In this environment, inactivity can often be the correct trade:
Only a small group of stocks are producing clean trends
Outside of those names, risk-adjusted returns have been poor
That said, this is not a complacency zone:
The weekly chart shows a very tight two-week contraction
These structures often resolve with expansion
A breakout attempt is still very much on the table and needs to be monitored closely over the next few sessions
S&P 400 Midcap
MDY VRVP Daily & Weekly Chart
54.00%: over 20 EMA | 64.75%: over 50 EMA | 59.25%: over 200 EMA
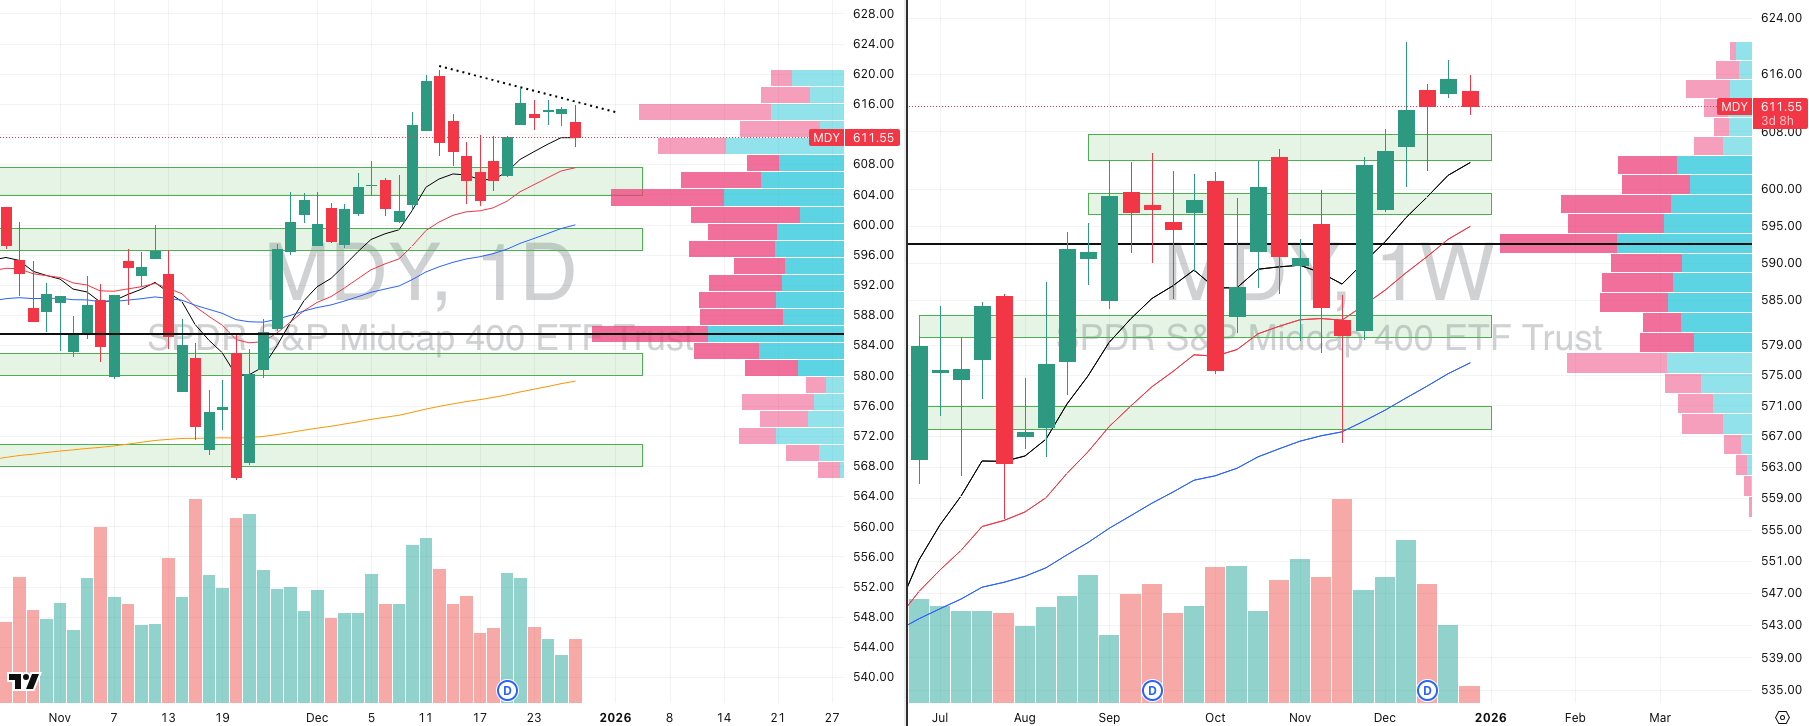
Mid-caps had another relatively weak session, continuing the same pattern we have seen throughout the second half of December, where upside attempts repeatedly stall into the same declining resistance level.
This resistance has now capped price multiple times, first on December 12th and again on the 22nd, 23rd, 24th, 26th, and most recently yesterday on the 29th. The repeated failures at the same level clearly show that supply is still active overhead.
Despite that, the broader structure remains intact. MDY is still holding above its rising 10-day moving average, and sellers have not been able to force a decisive breakdown or expand volatility to the downside.
From here, a retest of the 20-day moving average around 607 appears increasingly likely. This level is particularly important because it represents a major area of confluence, including the 20-day EMA, the 20-week EMA, and prior resistance that has already flipped to support earlier in the month.
As long as MDY holds this 607–608 zone, the current move should be viewed as consolidation rather than distribution. A pullback of roughly 0.6 percent into support would be entirely normal within the context of the broader uptrend.
The risk only begins to increase if price fails to hold this area cleanly. In that scenario, the recent rally would start to resemble a low-volume or failed rally, which historically increases the odds of a deeper corrective phase. At this stage, however, there is no confirmation of that outcome.
The larger issue for traders is not technical damage, but opportunity. Breakouts have lacked follow-through, momentum has been inconsistent, and most mid-cap names are chopping rather than trending, which makes execution difficult.
Russell 2000
IWM VRVP Daily & Weekly Chart
45.28%: over 20 EMA | 59.94%: over 50 EMA | 62.43%: over 200 EMA
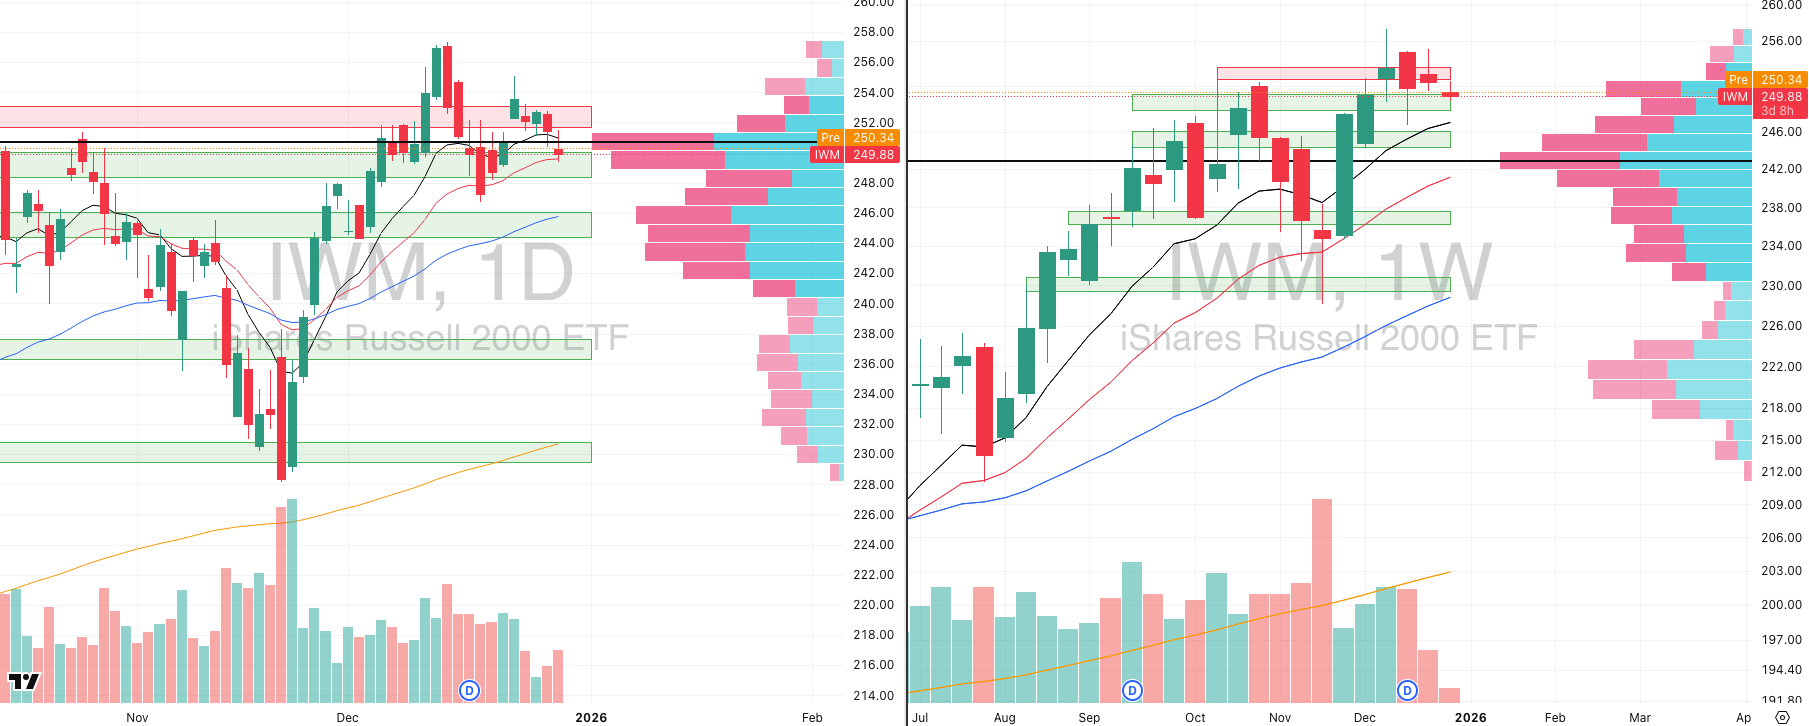
Small caps are exhibiting a very similar structure to mid-caps, though with slightly weaker relative strength. IWM failed to hold its point of control yesterday, which places more emphasis on nearby support levels.
Price is now drifting toward the rising 20-day moving average, a level that has been respected consistently since late November. This moving average represents the most important short-term support in the small-cap space.
If the 20-day moving average holds, the broader structure remains constructive and the current pullback should be viewed as consolidation near highs rather than the start of a breakdown.
If that level fails, downside pressure is likely to accelerate quickly toward the 10-week moving average near 247. That move would represent roughly a 1 to 1.2 percent decline and would be the next logical area where buyers would need to step in.
A failure to hold the 10-week moving average would materially weaken the intermediate trend and would suggest that the recent recovery is not yet ready to transition into a sustained advance. As of now, that scenario remains conditional and is not confirmed.
At present, there is no evidence of aggressive selling, no expansion in downside volume, and no decisive loss of trend. The market is still digesting gains rather than breaking down.
This remains a difficult trading environment, not because the market is weak, but because it is consolidating after a strong advance without offering clean continuation setups.
In conditions like this, patience is an edge. Cash is a valid position, and forcing trades usually leads to poor outcomes.
The best opportunities typically emerge after prolonged consolidation phases like this one, and that is where our focus remains.
Colorado’s Most-Awarded Brewery Did Something Totally Unique

Some companies make lofty promises to investors and never deliver. Others use those dollars to unlock new levels of scale.
That’s Westbound & Down’s story. Already Colorado’s most-awarded craft brewery, they opened their doors to investors for the first time to help open a flagship Denver-metro-area location.
With 2,800% distribution growth since 2019 and a retail partnership with Whole Foods, it’s no shock investors maxed out that campaign in less than 60 days.
But it’s what comes next that’s even more exciting. Fresh off Brewery of the Year honors at the 2025 Great American Beer Festival, W&D is scaling toward 4X distribution growth by 2028.
This is a paid advertisement for Westbound & Down’s Regulation CF Offering. Please read the offering circular at https://invest.westboundanddown.com/
FOCUSED STOCK
AMD: The Point of Maximum Asymmetry

AMD VRVP Daily & Weekly Chart
ADR%: 3.54% | Off 52-week high: -19.3% | Above 52-week low: +181.9%
AMD remains one of the highest-conviction stocks we are tracking right now, even though it has not been widely discussed over the past few sessions.
Yesterday’s session was quietly impressive. AMD sold off with the broader market at the open, but that weakness was fully absorbed, and price was pushed back higher into the close.
The stock finished just above the daily point of control, and more importantly, it is now compressing extremely tightly around that level. The 10-day, 20-day, and 50-day moving averages are all converging directly around 214.65, which also lines up with the 10-week moving average on the weekly chart.
This type of multi-timeframe confluence is exactly what we look for when identifying high-quality setups. It reflects balance, compression, and a market that is storing energy rather than distributing.
From a relative performance standpoint, AMD continues to stand out. It currently carries a 99 relative strength rating, which is the highest in the market.
Semiconductors remain one of the strongest growth groups, and that context matters. The strongest growth stock in the market right now is Micron, and AMD sits firmly within that same leadership complex.
On the weekly chart, AMD has respected the 20-week moving average perfectly. We have now seen three clean retests of that level since early November, all of which were met with strong demand.
From where we are positioned, AMD is not just a stock to watch casually. It is one of the highest-priority names that should remain on your watchlist as we move into the next expansion phase.
FOCUSED GROUP
XLK: Technology is Getting Tight
XLK VRVP Daily & Weekly Chart
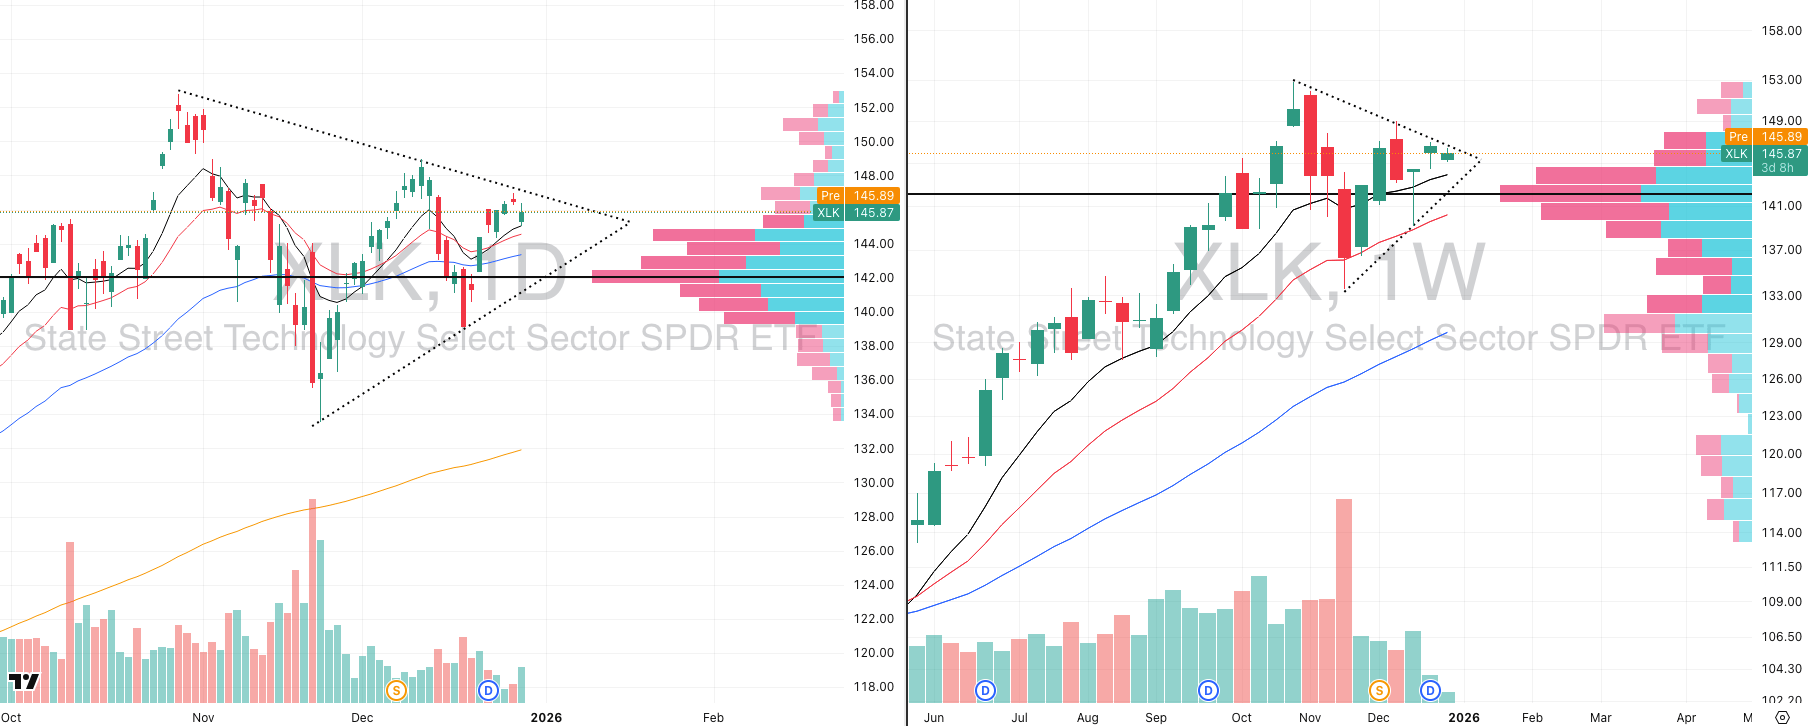
Technology continues to mirror the broader NASDAQ structure, which is not surprising given how heavily weighted the index is toward the sector.
Since peaking at all-time highs on October 29th, technology has been in a steady contraction phase. At this point, that consolidation has lasted just over 60 trading days.
This is the part of the market cycle that most traders struggle with. There is very little immediate gratification, breakouts fail quickly, and patience becomes the primary edge.
Despite the frustration, the structure itself is constructive. Technology has continued to form higher lows, and demand has consistently shown up at the 20-week moving average going back to early November.
Price is now contracting above the 10-week moving average in a manner that closely resembles the NASDAQ’s structure. This is not a sign of weakness, but rather a sign of absorption and balance.
The only missing ingredient at this stage is time. The market is doing the work required to reset positioning and rebuild energy.

Did you find value in today's publication?This helps us better design our content for our readers |
Reply