- Swingly
- Posts
- Why This Bounce Looks Tradable
Why This Bounce Looks Tradable


MARKET ANALYSIS
All You Need To Know Today

Futures are opening the week with a modest relief bid, but the move is still entirely headline-driven rather than structurally convincing.
The immediate driver this morning is renewed optimism that some form of temporary ceasefire framework may emerge between the U.S. and Iran, with multiple reports pointing to a possible 45-day halt in hostilities and partial reopening of the Strait of Hormuz.
That matters because the market is still trading energy first, equities second.
Oil remains the dominant macro transmission mechanism. Even with Brent crude easing slightly back toward $108, price is still sitting at historically elevated levels, which means the inflation pressure has not disappeared — it has simply paused from last week’s extreme acceleration.
The key point here is that lower oil this morning should not be interpreted as oil being low. It is still extremely elevated relative to where global equities were priced only a few weeks ago.
That is why equity futures are positive, but only cautiously so: the market is pricing less immediate escalation, not a clean return to risk-on conditions.
This is also why bond markets remain highly relevant here. The macro problem has not changed: if oil stays elevated, inflation expectations remain sticky, and that keeps pressure on the Federal Reserve to stay restrictive far longer than equities would prefer.
Jamie Dimon made that exact point again this morning — warning that prolonged energy shocks risk recreating the same inflation persistence that historically pushed economies into much deeper slowdowns.
In practical terms, that means every relief rally in equities is still vulnerable unless energy materially breaks lower.
The stronger-than-expected payrolls print from Friday adds another layer: the economy is not weak enough yet to force policy easing, which leaves markets trapped between resilient data and an inflation shock.
For now, that creates a difficult environment where rallies can continue intraday, but conviction remains shallow because the macro backdrop still lacks genuine clarity.
Bitcoin’s move back toward $70,000 reinforces that short-term risk appetite is returning at the margin, but crypto is currently responding more to falling oil and ceasefire headlines than to any broader macro improvement.
Until oil decisively loses momentum or we get confirmed de-escalation rather than negotiation headlines, expect volatility to stay elevated and intraday reversals to remain common and should be expected.
S&P 500
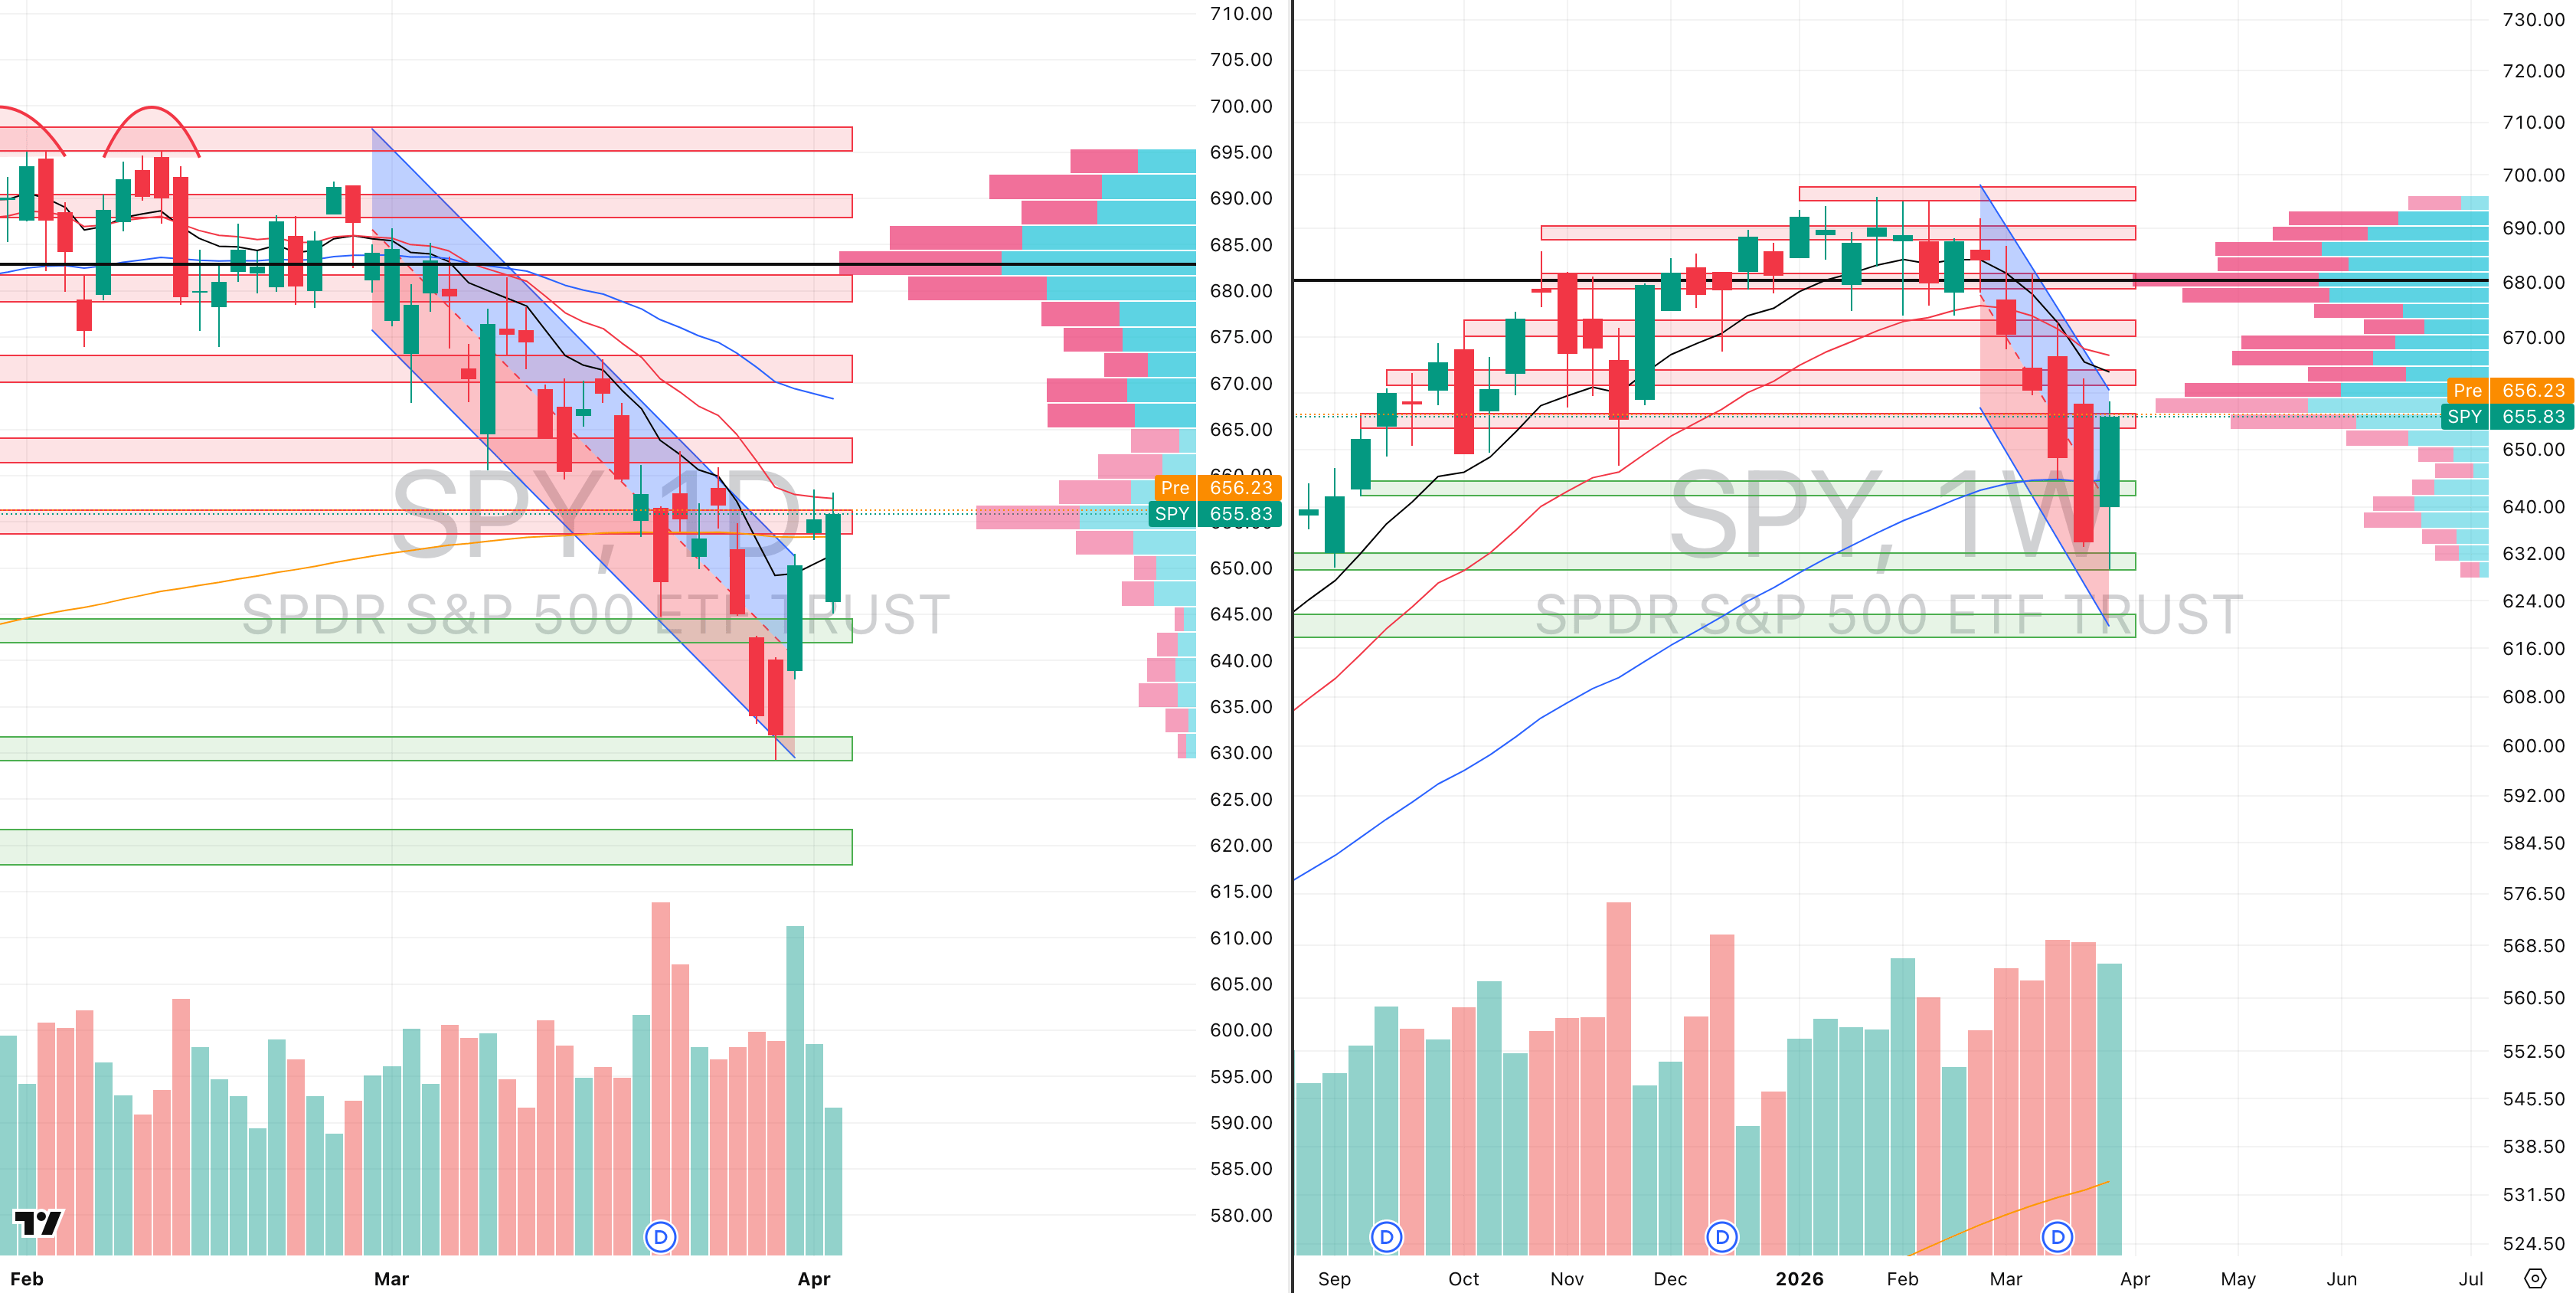
SPY VRVP Daily & Weekly Chart
52.48%: over 20 EMA | 28.62%: over 50 EMA | 48.31%: over 200 EMA
The S&P 500 did achieve an important short-term character shift into the end of last week. After trading inside the same descending regression trend that had been in place since 27 February, price finally broke cleanly above that structure on Wednesday, with confirmation extending into Thursday.
That gave us the first genuine three-day trend change we have seen in several weeks, with price reclaiming $656 and, importantly, holding above it.
Thursday’s final session of the week added credibility because price pulled back intraday, tested the prior regression breakout line near $653, found support exactly where prior resistance should have flipped, and then closed near the top of the daily range.
That is the kind of post-breakout behaviour you want to see if a move has genuine near-term continuation potential.
The immediate level now is $657, because this is where supply becomes very visible.
The visible range volume profile shows roughly 7.6 million shares traded on red candles against only 6 million shares traded on green candles, which tells us supply still outweighs demand at this exact area.
In practical terms, that means this level should not be assumed to clear easily as sellers are likely to defend it initially.
The reason it matters so much is because if SPY can absorb that supply, the structure above opens materially.
Beyond $657, there is a relatively clean low-volume pocket extending toward $670, where price would then move into the declining 10-week EMA, 20-week EMA, and declining 50-day EMA.
That entire zone becomes highly relevant because low-volume pockets often allow for faster directional travel once overhead supply is absorbed.
So if $657 breaks and holds, the probability increases materially for a 1–3 day momentum burst higher, purely as a tradable short-term extension rather than a confirmed larger trend reversal.
The bigger point is that this is the first time in weeks SPY is forcing supply to defend rather than simply collapsing into lower demand zones, and that alone is an improvement in short-term market character
Nasdaq
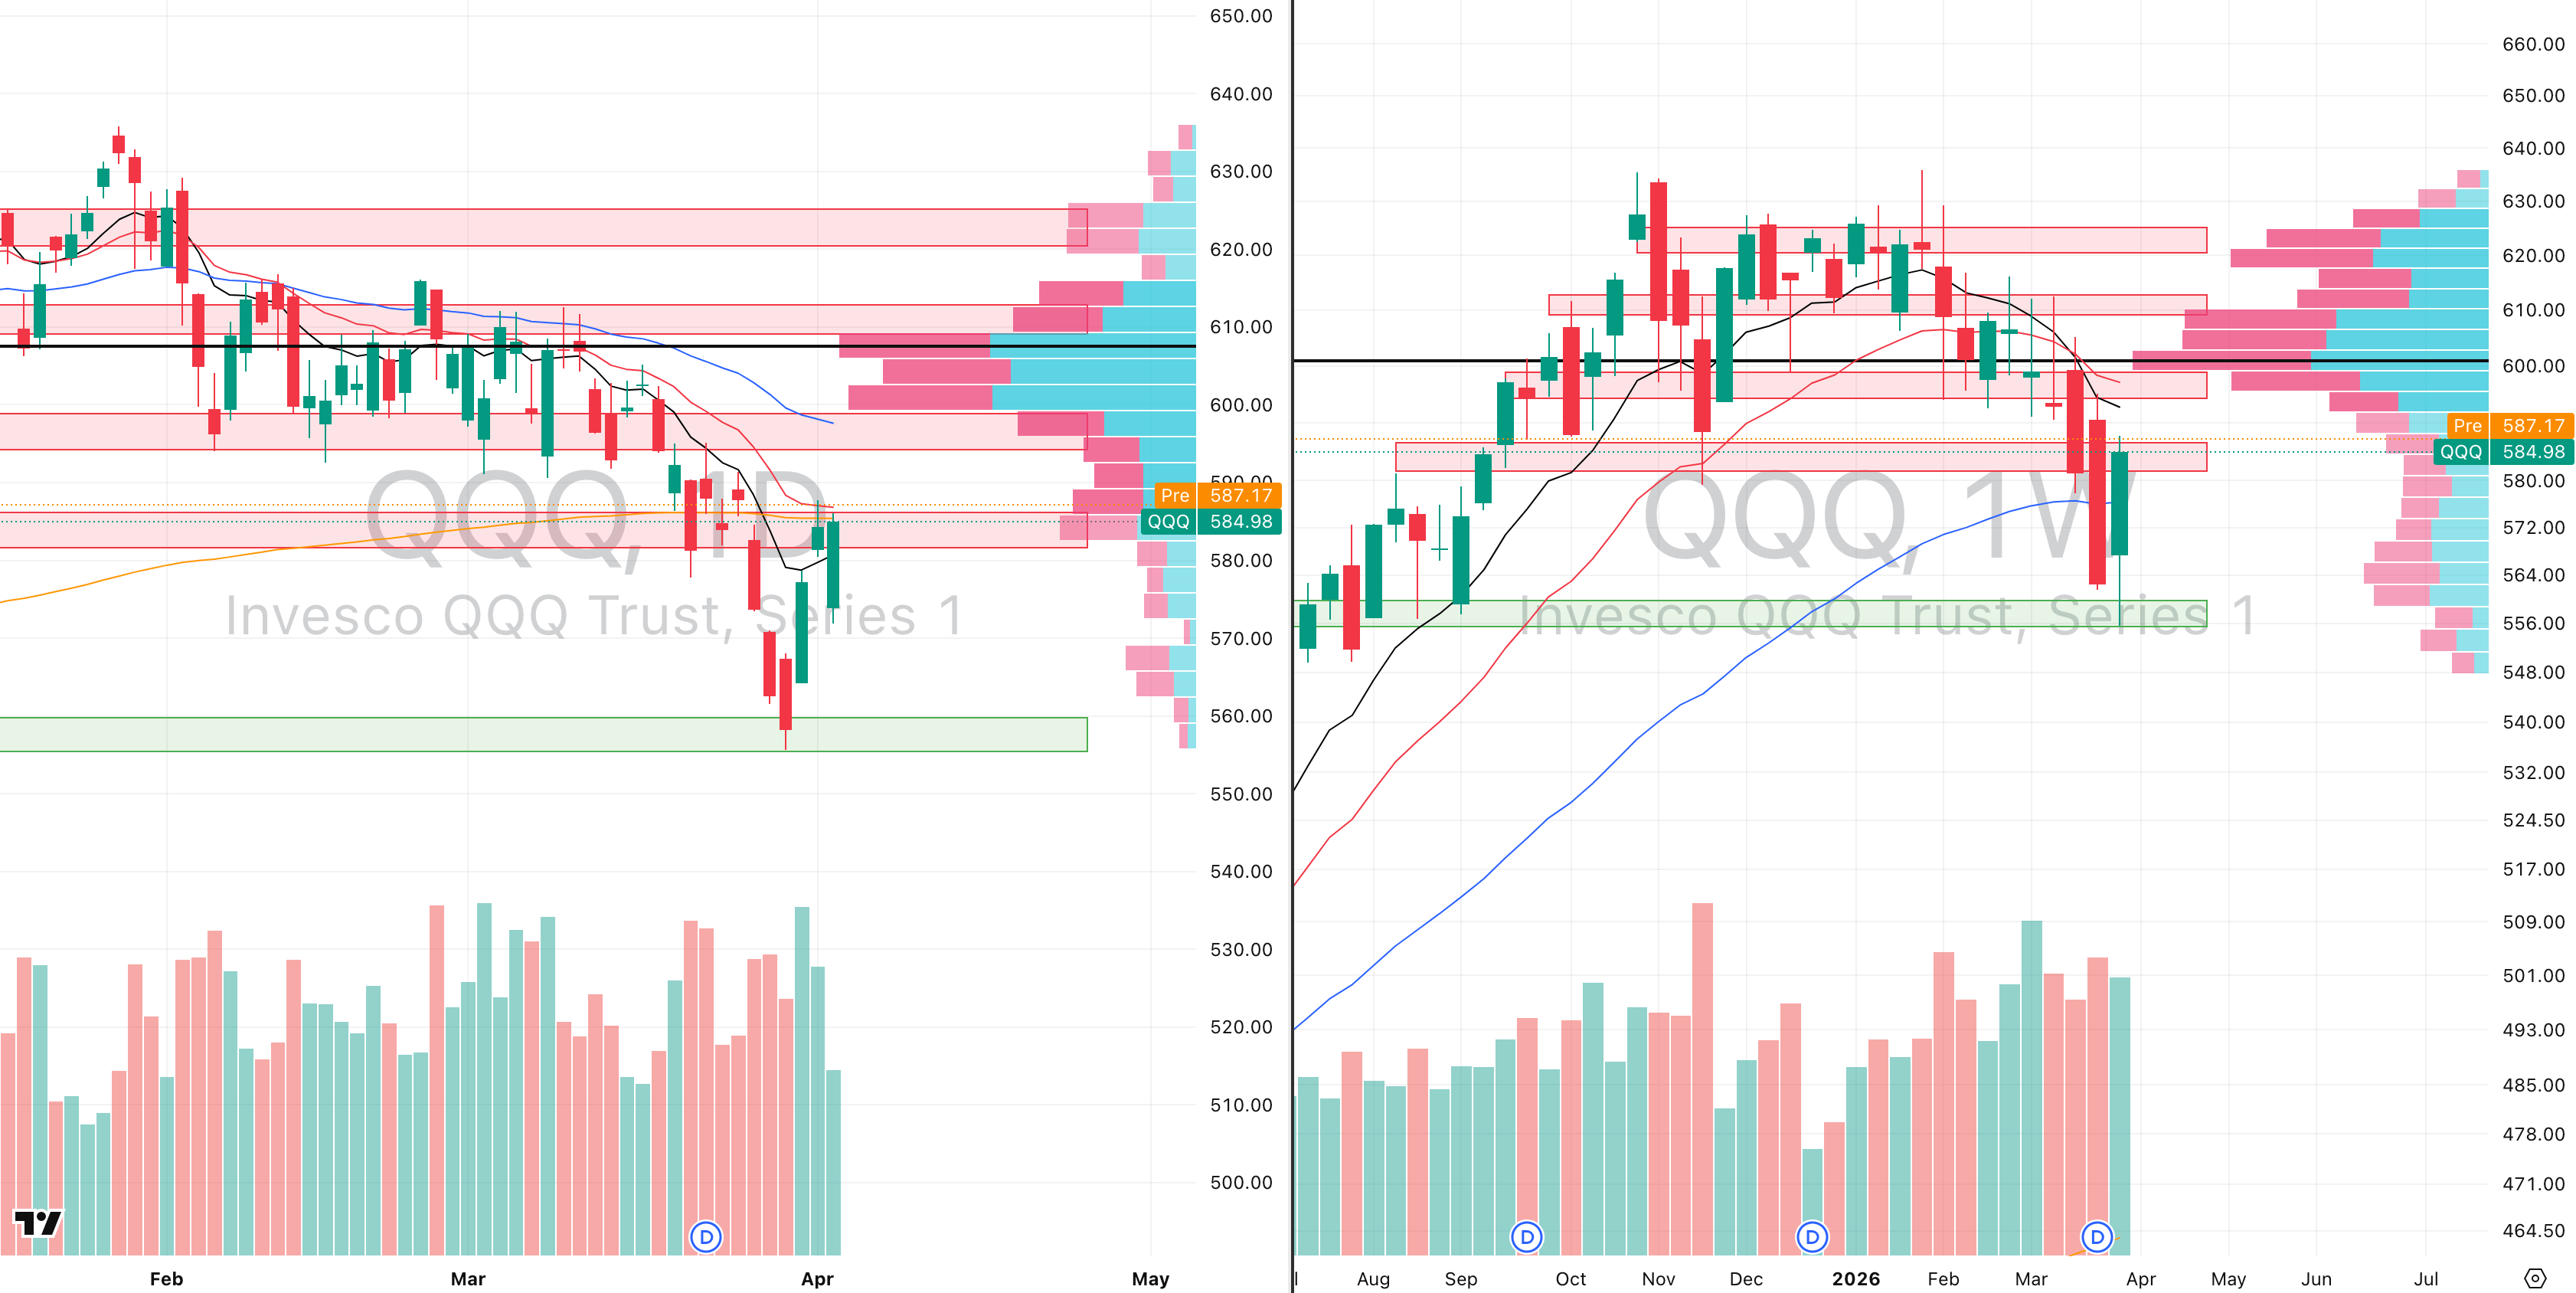
QQQ VRVP Daily & Weekly Chart
44.55%: over 20 EMA | 27.72%: over 50 EMA | 43.56%: over 200 EMA
The Nasdaq is beginning to show the early shape of a possible inverse head and shoulders, and that matters because it would represent the first meaningful reversal structure since the selloff accelerated in March.
The regression trend from 10 March into the $555 low defined a very clean 9.4% downside leg, and importantly that move came during an abnormally volatile volume environment.
Across that 20-day decline, roughly 1.02 billion shares traded, which is around 114% above expected relative volume, confirming that the selloff was not passive — it was a highly participated liquidation phase.
The bounce from $555 is significant because that level also aligns with the 20-month moving average, which makes it a far more important support zone than just a daily reaction low.
Since then, we have had roughly one week of upside, but volume remains the caution point.
Thursday’s session came in at only 74% relative volume, and the prior three sessions also showed declining participation, meaning the bounce currently lacks strong sponsorship.
That is why, for now, the structure still carries some bull trap risk unless participation improves.
Structurally though, the inverse head and shoulders is beginning to form:
left shoulder: 20–25 March
head: sharp flush to $555
right shoulder: current consolidation
For that to mature properly, QQQ likely needs a few more sessions holding below $588 rather than immediately breaking higher.
At $588, the visible range volume profile shows a dense supply cluster — roughly 6.96 million shares traded red versus 6.6 million green, so unlike SPY, supply and demand are relatively balanced there.
That balance is important because it means price can still absorb this zone if momentum improves.
If QQQ clears $589, there is a very clean low-volume pocket up to $600, where the declining 50-day EMA and declining 20-week EMA both converge.
That creates a clear short-term momentum burst target, tradable over 1–3 sessions, if the breakout confirms.
Separately, the increase in broader market open interest we highlighted in the weekend report remains important — participation is beginning to return in a way we were not seeing through January and early February.
S&P 400 Midcap
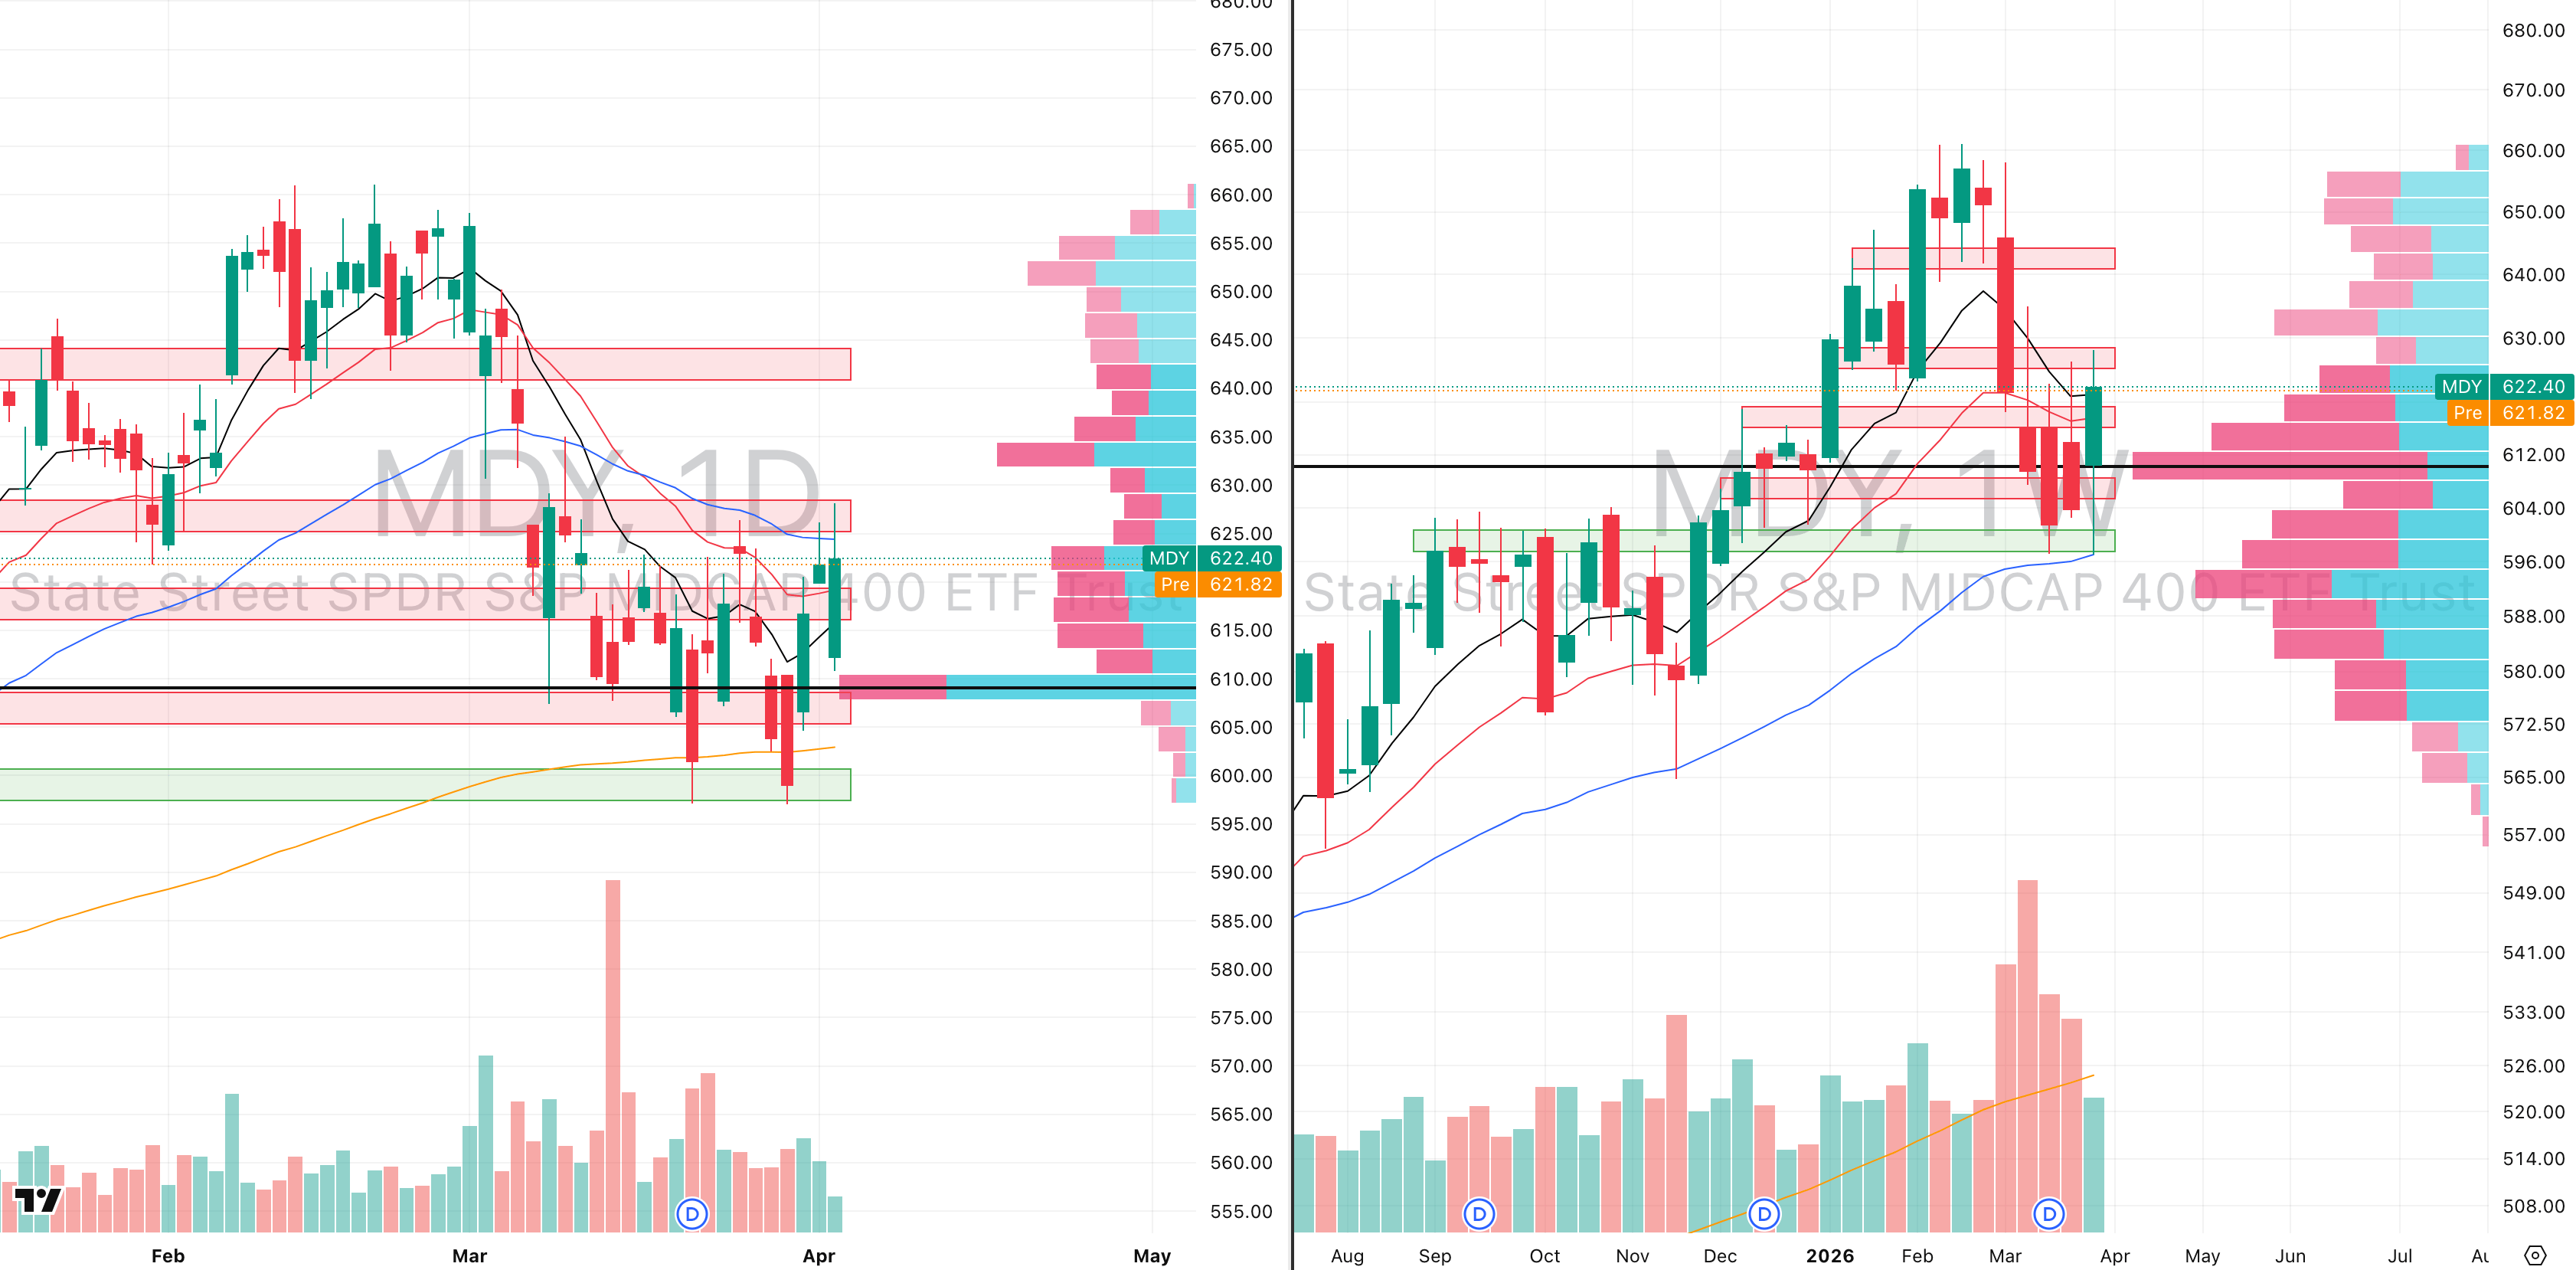
MDY VRVP Daily & Weekly Chart
55.75%: over 20 EMA | 29.00%: over 50 EMA | 47.50%: over 200 EMA
Mid-caps continue to show stronger behaviour than both SPY and QQQ, which remains one of the most constructive relative strength signals in the market right now.
We now clearly have an Adam and Adam double bottom:
first low: 20 March
second low: 30 March
That structure matters because historically, according to Thomas Bulkowski’s database, Adam-and-Adam double bottoms reach their projected target around 73% of the time, based on over 1,100 historical examples.
That makes this one of the higher-quality reversal structures currently visible across the major indices.
The immediate resistance remains $629.
Between $629 and $633, there is clear trapped supply:
roughly 650,000 shares traded green
roughly 600,000 shares traded red
That slight long-side overhang means sellers at breakeven are likely to appear into that zone.
Near term, a pullback toward $617 would actually be constructive.
That level aligns with the 20-week EMA, and some consolidation here would improve the quality of any later breakout attempt.
Importantly, despite the bounce, we are still aware that a larger head and shoulders top remains visible on the weekly timeframe:
left shoulder: December into early January
right shoulder: March into now
But because the double bottom is statistically strong, mid-caps deserve the benefit of the doubt until proven otherwise.
Russell 2000
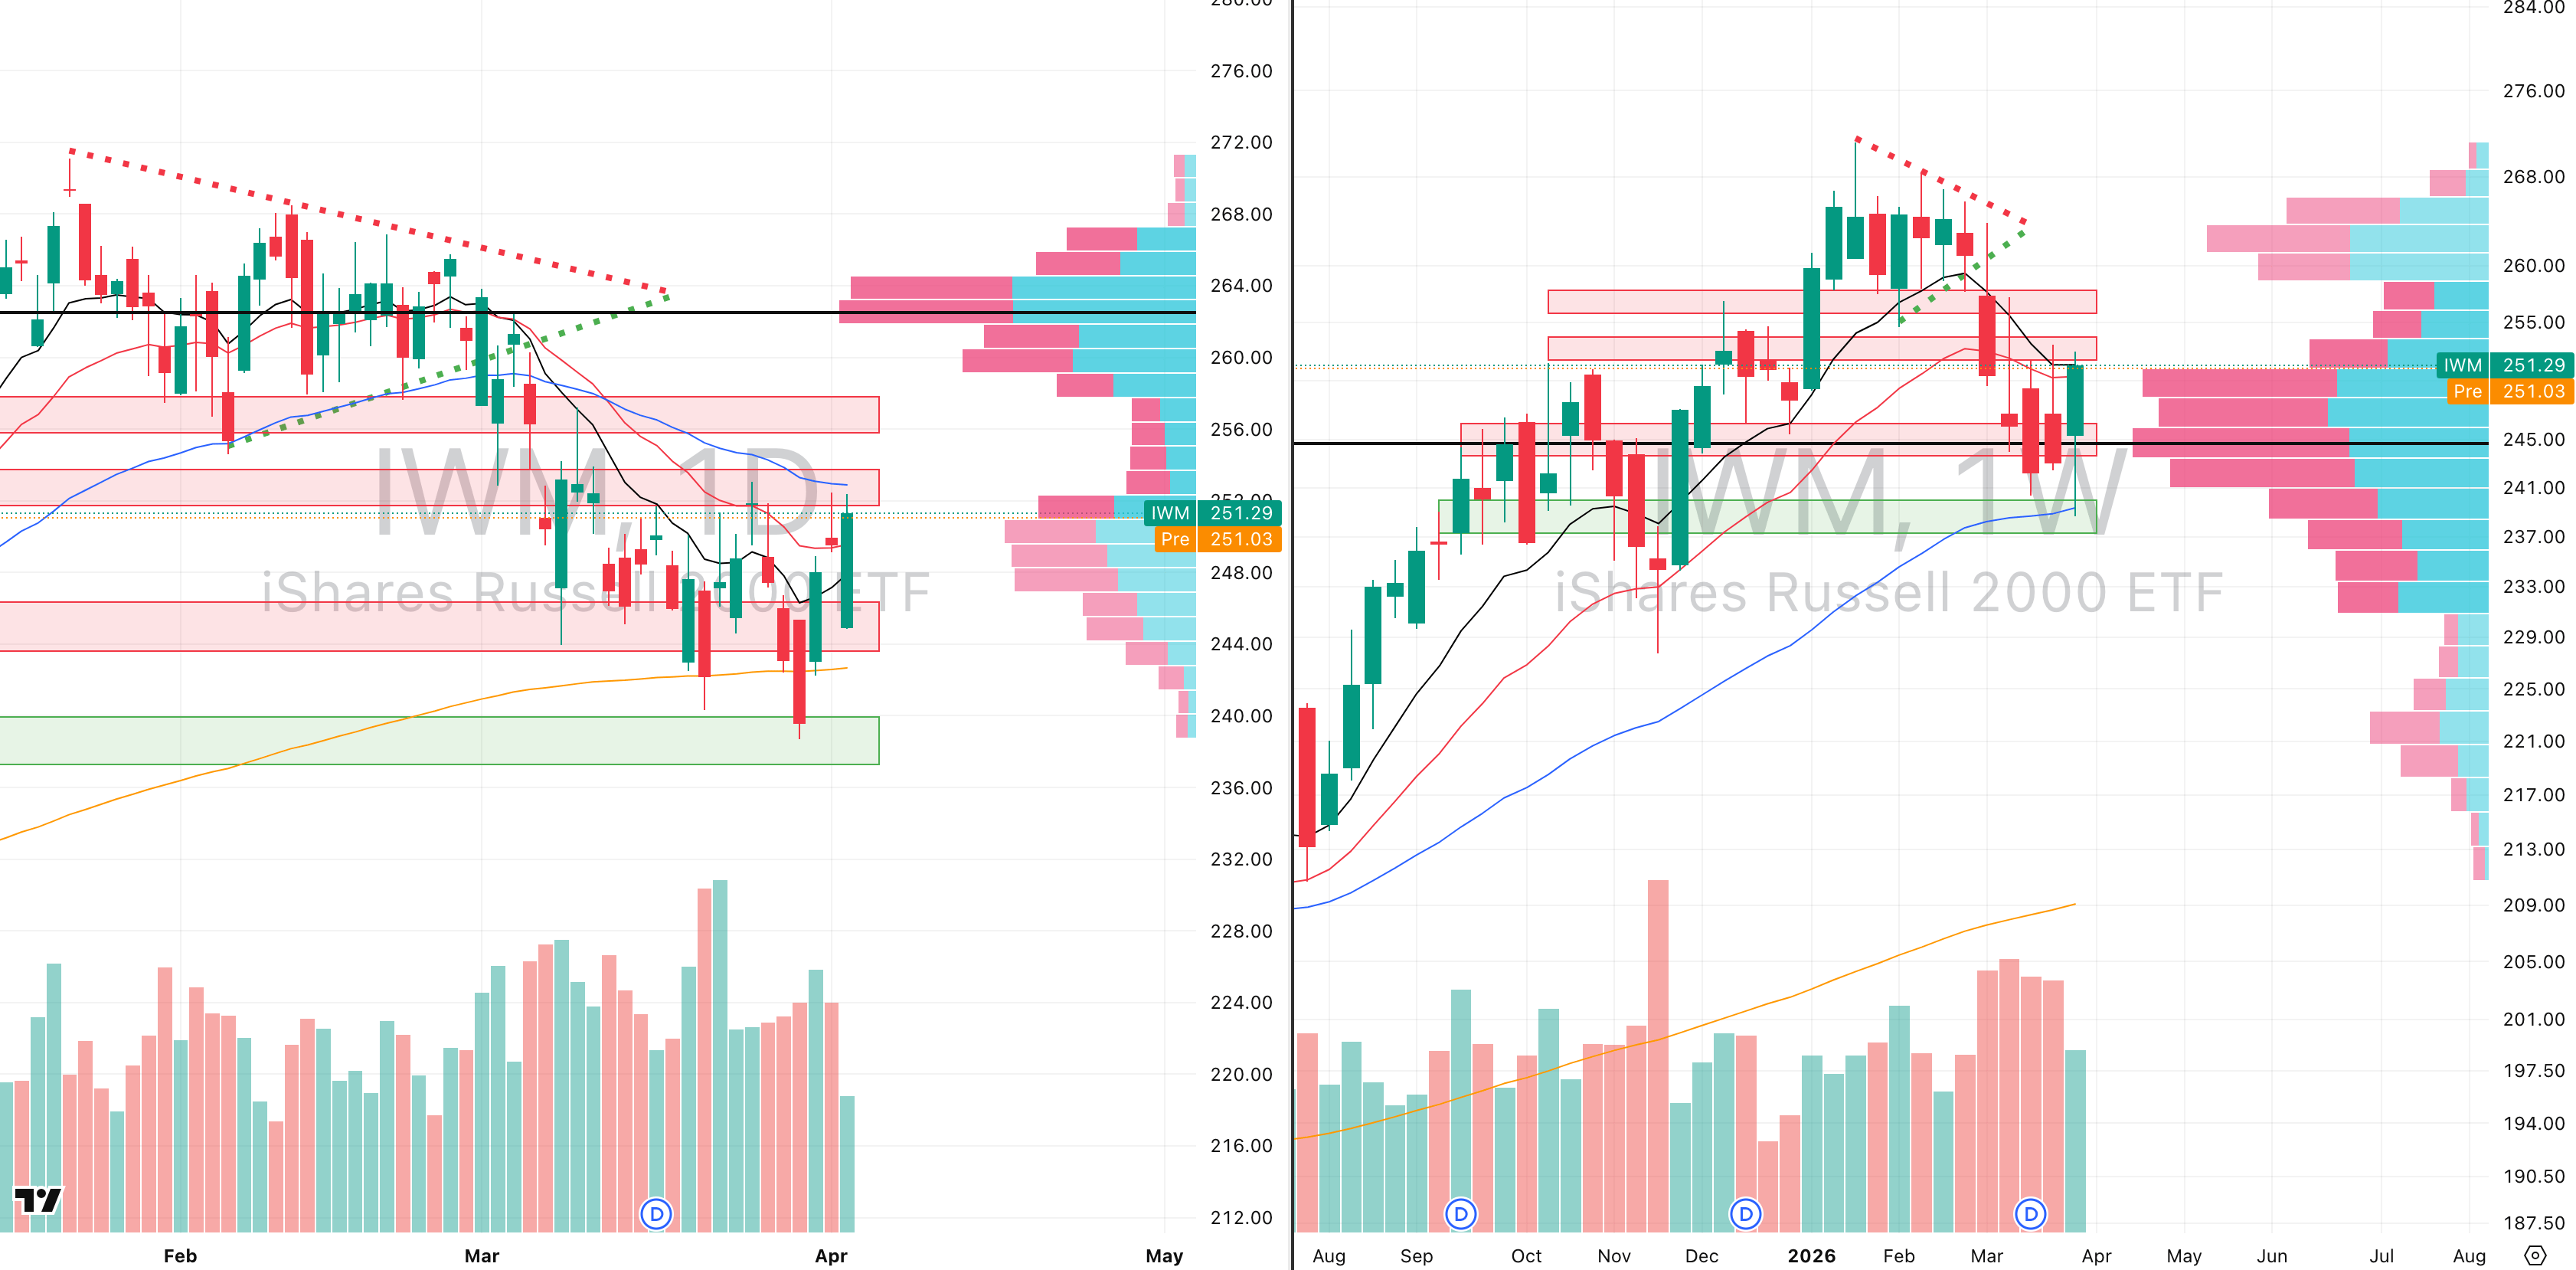
IWM VRVP Daily & Weekly Chart
59.13%: over 20 EMA | 35.89%: over 50 EMA | 49.60%: over 200 EMA
Small caps are behaving similarly to mid-caps, but with slightly higher volatility.
Last week’s bounce produced about 5.6% ATR, roughly 1.5x normal weekly range, which confirms genuine movement rather than passive drift.
Like MDY, IWM has also built a double-bottom type structure off the 50-week EMA, while reclaiming the 200-day EMA.
The immediate resistance remains $253, where the 50-day moving average continues to cap upside.
Above that, there is room for roughly 2.9% upside, which equates to around 1.3x average daily range.
Again, that suggests tradable short bursts rather than durable swing continuation.
The broader point remains important: both small caps and mid-caps are still structurally outperforming the large-cap indices, which is not what you typically see if broad market conditions are deteriorating further
FOCUSED STOCK
XBI: Biotechs Number 2 Strongest Group
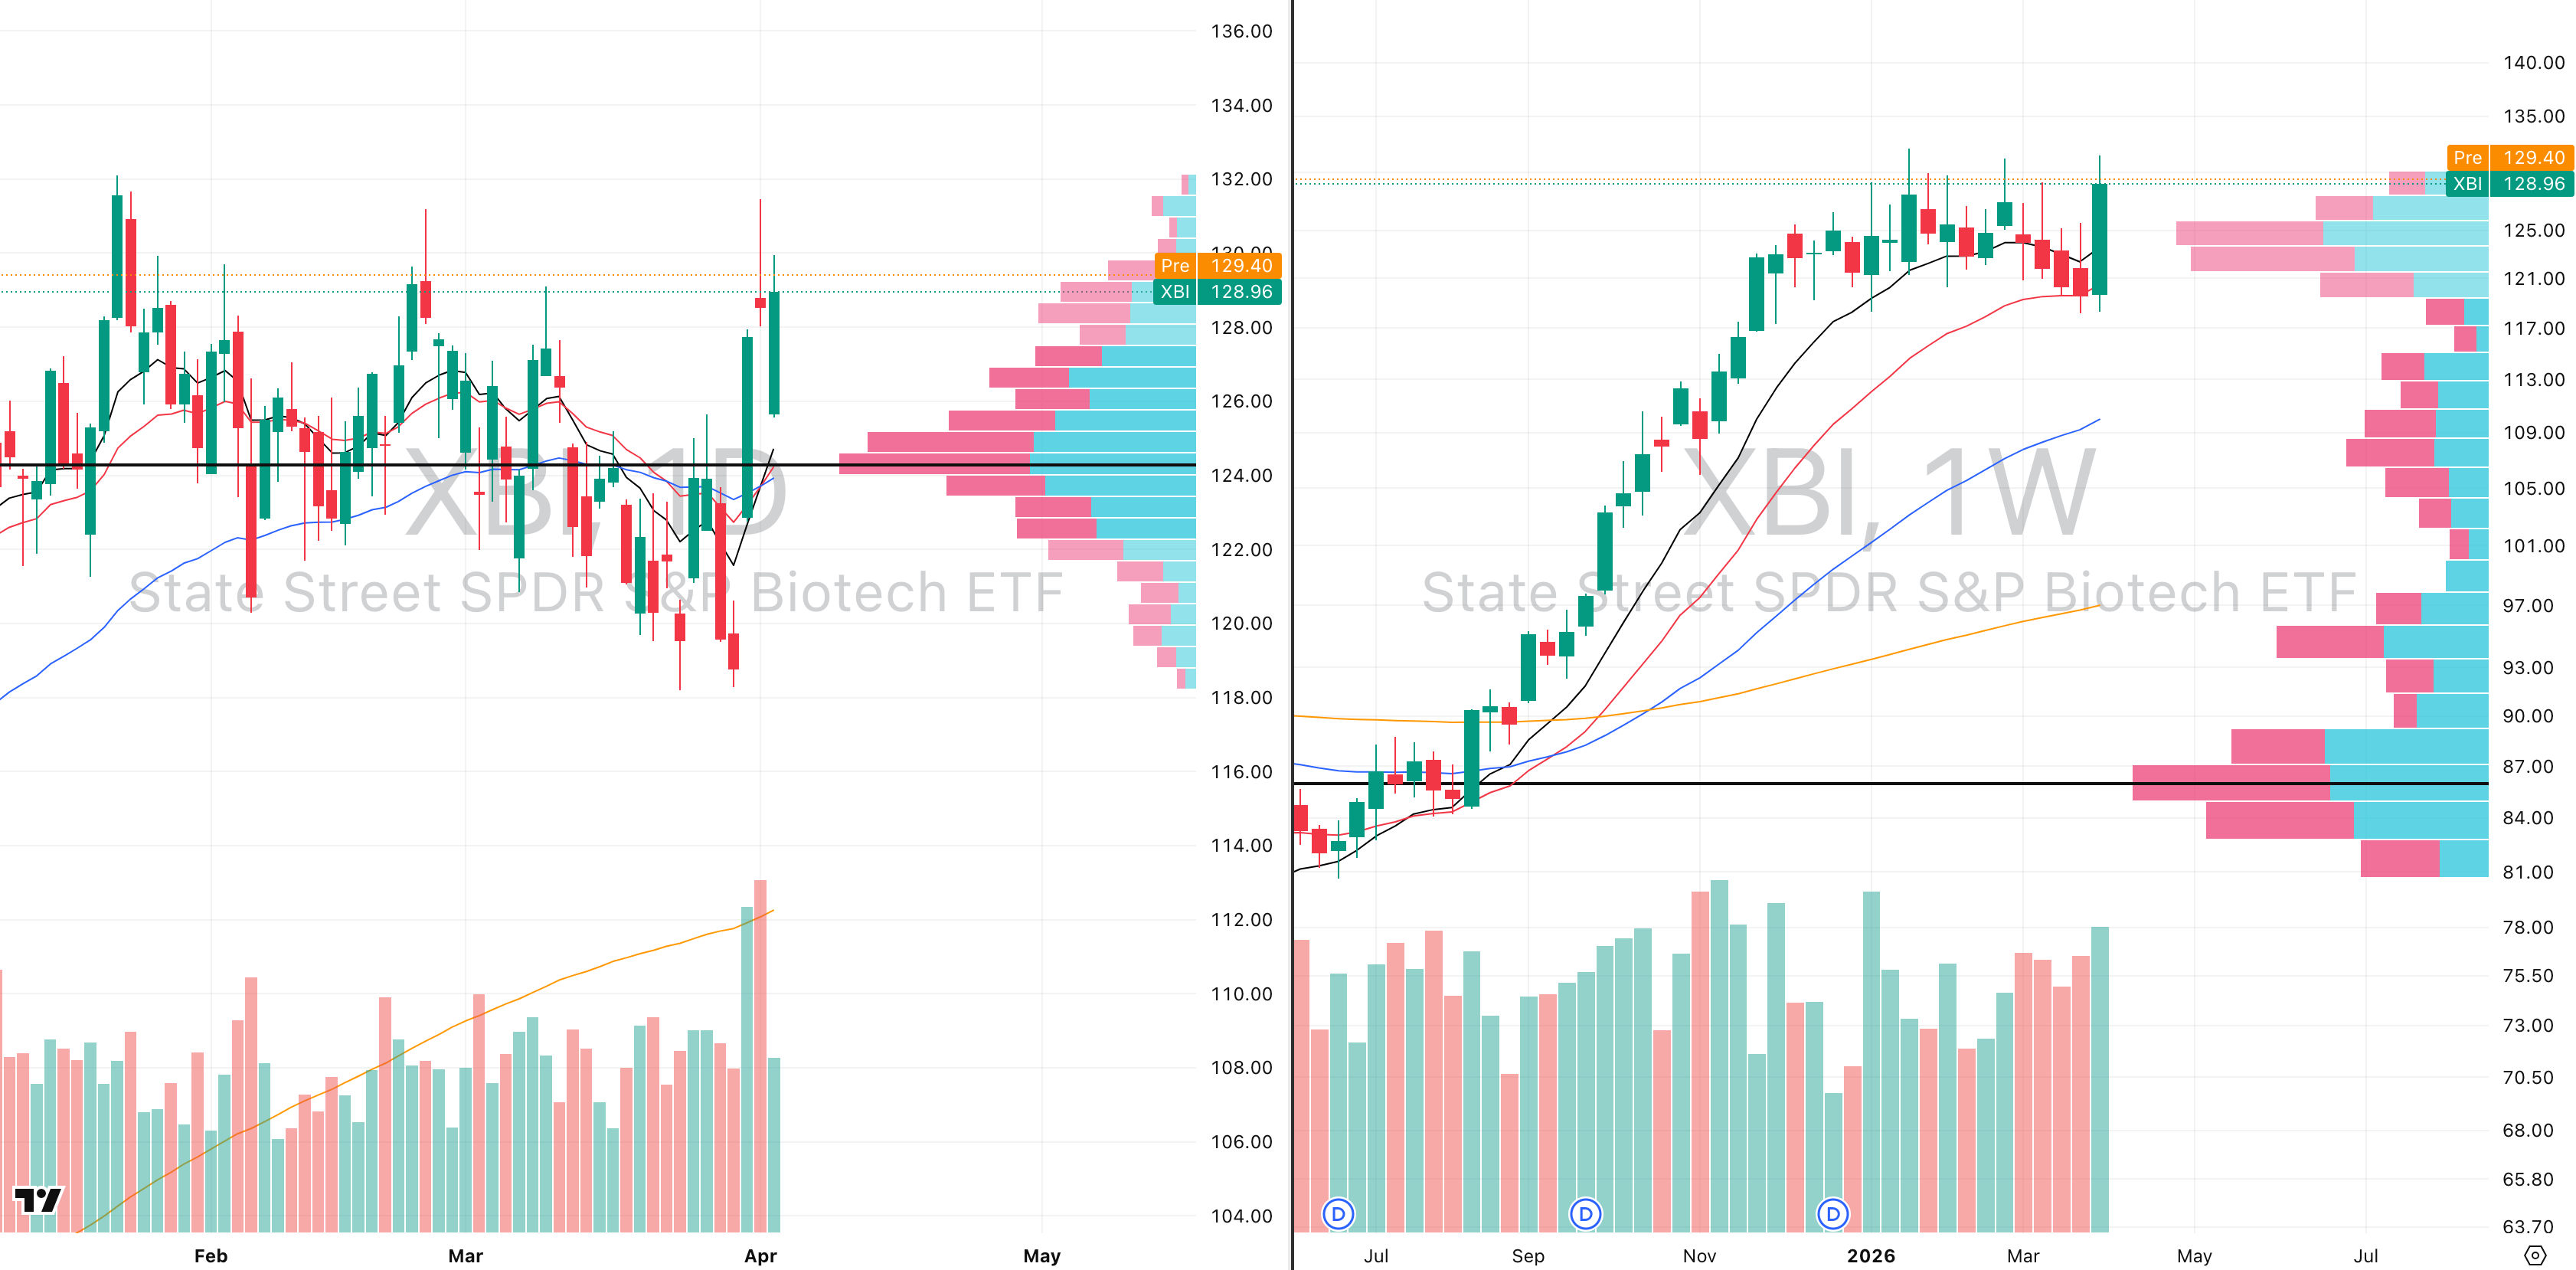
XBI VRVP Daily & Weekly Chart
Biotech was one of the most important relative strength developments last week, because the group delivered one of the cleanest high-conviction rebounds anywhere in the U.S. market.
The move came off the rising 20-week EMA, which is exactly the type of higher-timeframe support you want to see hold if a sector is still structurally in a Stage 2 trend.
What made the bounce stand out was the participation behind it: weekly relative volume reached 117% of the 20-week average, which is the highest weekly relative volume the group has printed anywhere in 2026.
When a sector produces its highest relative volume of the year directly off a rising weekly moving average, it usually signals that buyers were actively defending that level rather than simply reacting to broad market beta.
Relative strength confirms that view and biotech is now running at roughly 89 relative strength versus the S&P 500, which currently makes it the second strongest major group in the U.S. market, behind only Energy Select Sector SPDR Fund.
That is a very notable rotation because biotech is not leading due to oil, geopolitics, or commodity shock, it is leading on its own internal bid and Thursday’s session completely filled the prior downside gap, and it did so on 101% relative volume, which is another strong signal because gap fills often fail when momentum is weak.
From our perspective, if biotech is genuinely transitioning into leadership, this week should ideally produce full continuation rather than immediate hesitation.
A group showing this type of weekly volume expansion, this level of relative strength, and successful gap recovery should normally continue pressing higher if sponsorship is real.

Did you find value in today's publication?This helps us better design our content for our readers |
Reply