- Swingly
- Posts
- Why The Sell-Off is Getting Worse
Why The Sell-Off is Getting Worse
In partnership with


MARKET ANALYSIS
Here’s All You Need To Know
Markets are reacting to a genuine regime shift rather than a single headline, with risk being repriced across equities, rates, FX, and commodities simultaneously.
The recent sell-off marks a transition from rotational, index-masking weakness to broader, correlated pressure, which materially changes the risk profile.
Volatility has expanded while yields are rising and the dollar is weakening which is a dangerous combination that historically compresses equity multiples rather than supports dip-buying.
Small and mid-caps continue to show relative resilience, but they are no longer insulated, and gap-down opens across these segments signal that liquidity is being pulled back, not rotated.
After months of choppy, two-day momentum cycles, the market is now vulnerable to acceleration, as positioning has not fully adjusted to downside risk.
This is not an environment that rewards anticipation or trading strength; it rewards patience, discipline, and confirmation at the close.
Until volatility contracts and downside pressure stabilizes, risk-off positioning is the higher-probability decision.
Do not overcomplicate this. The tape is warning that conditions have changed. Stand aside, protect capital, and wait for the market to re-earn risk exposure
Nasdaq
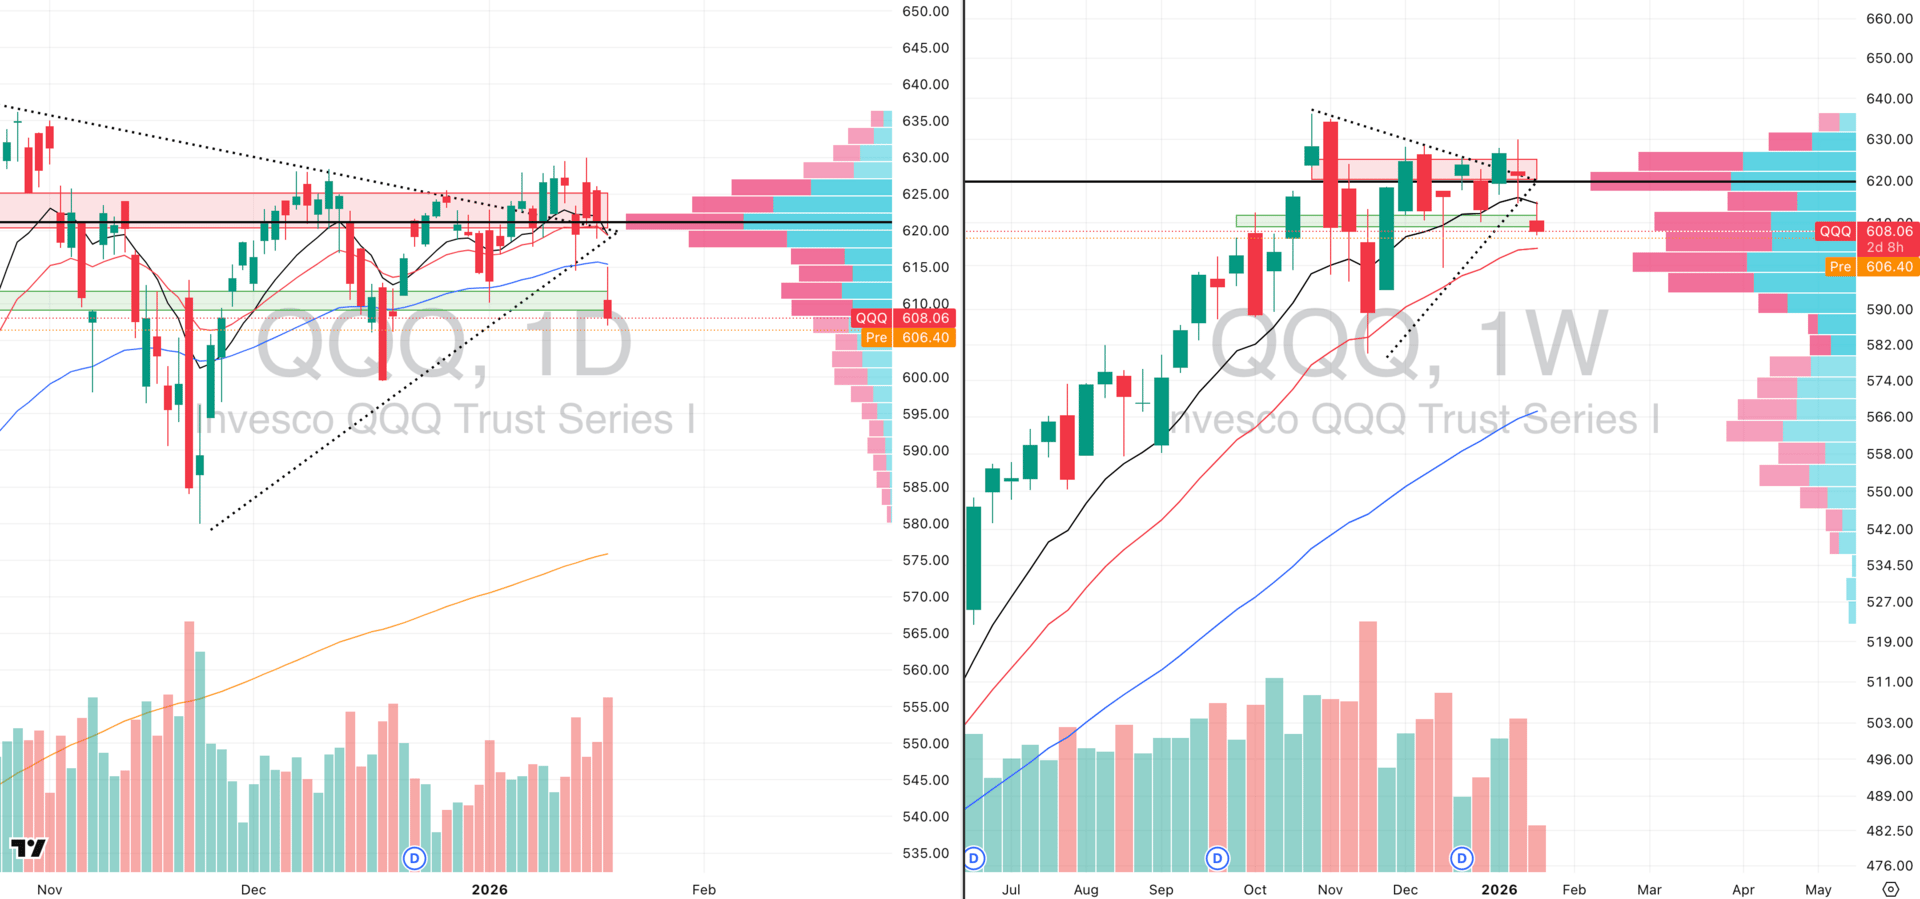
QQQ VRVP Daily & Weekly Chart
41.17%: over 20 EMA | 45.09%: over 50 EMA | 56.86%: over 200 EMA
The NASDAQ experienced a decisive breakdown yesterday, and the severity of this move should not be understated.
QQQ gapped down approximately 1.8% and attempted an intraday mean reversion that carried price back to the 50-day EMA near 615.45, equal to one full average daily range.
That level had previously acted as demand on January 2 and January 14, but yesterday’s rejection confirms a clear failure of that support zone.
The session printed the highest relative volume since the November 20 capitulation, occurring during a rejection of both the 50-day and 10-week EMAs.
High-volume rejection at a former demand level is one of the weakest structural signals possible and typically precedes accelerated downside.
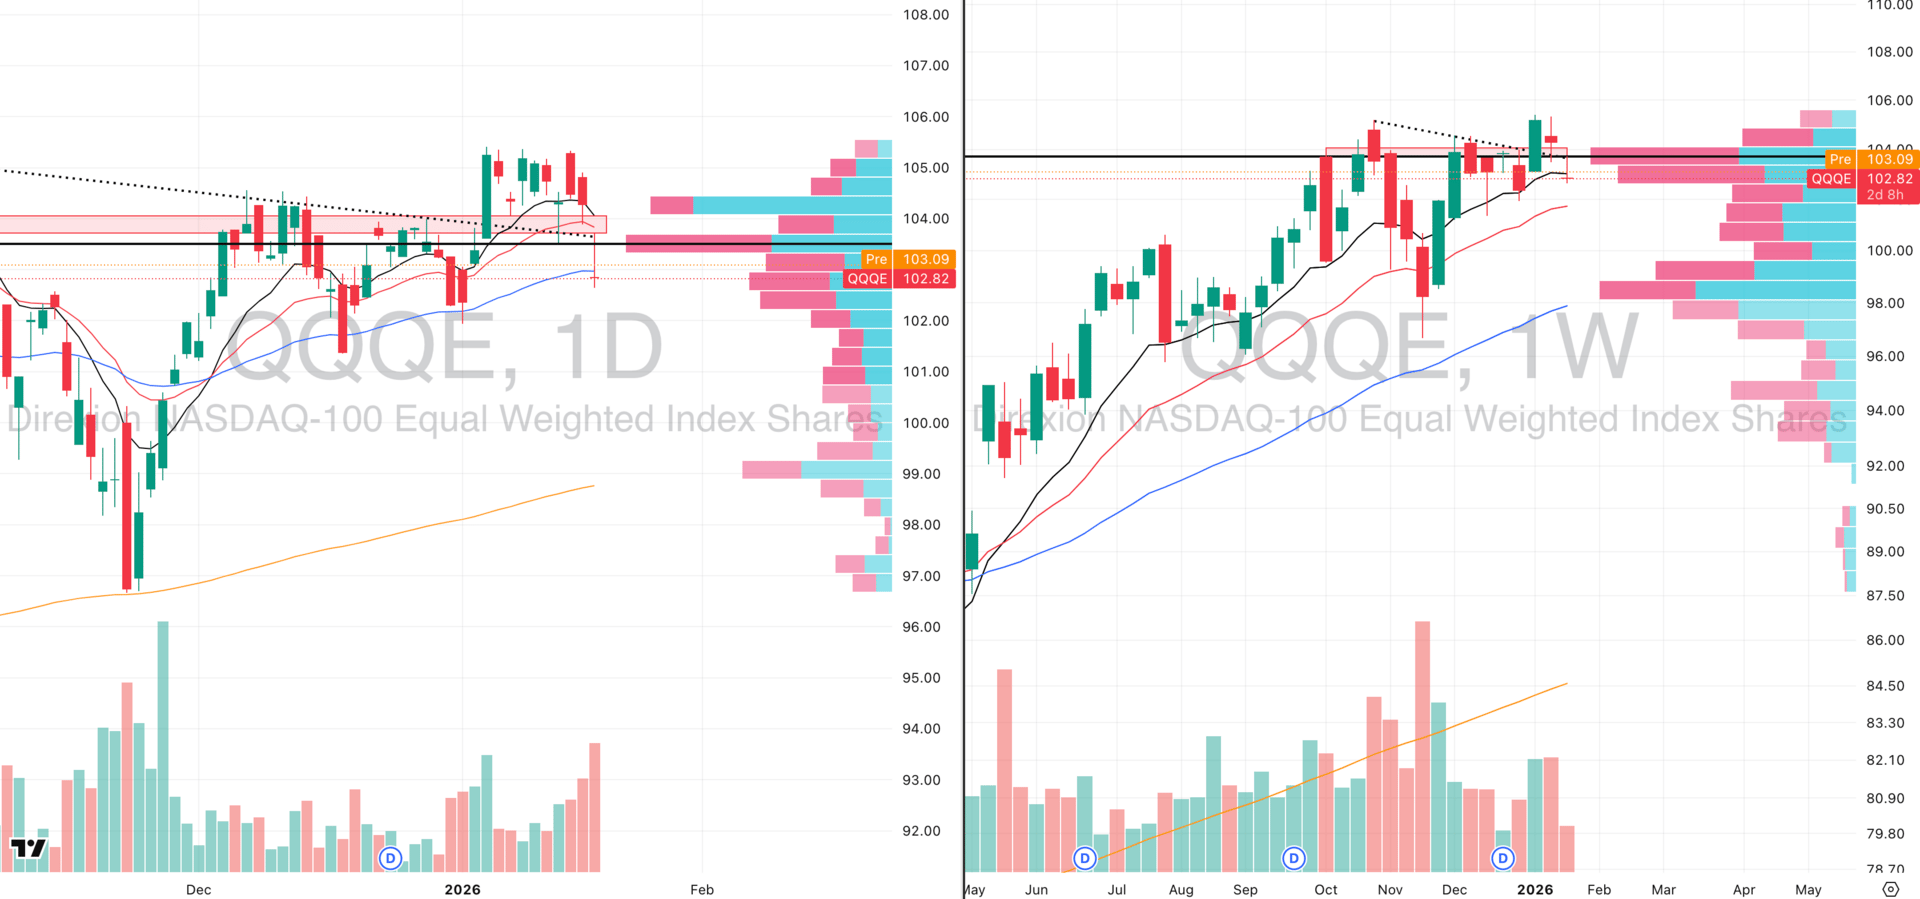
QQQE VRVP Daily & Weekly Chart
The equally weighted NASDAQ confirmed the weakness rather than diverging from it.
QQQE gapped down ~1.45%, rallied nearly 1% intraday (exceeding its average daily range), and then fully rejected the move.
The reversal occurred on extreme volume — roughly 185% of the 20-day average — also the highest since November capitulation.
The failure of both cap-weighted and equal-weighted NASDAQ removes the last internal support argument for this index.
From our standpoint, this is a clear risk-off signal and not a market to be trading from the long side within large-cap growth or tech.
S&P 400 Midcap
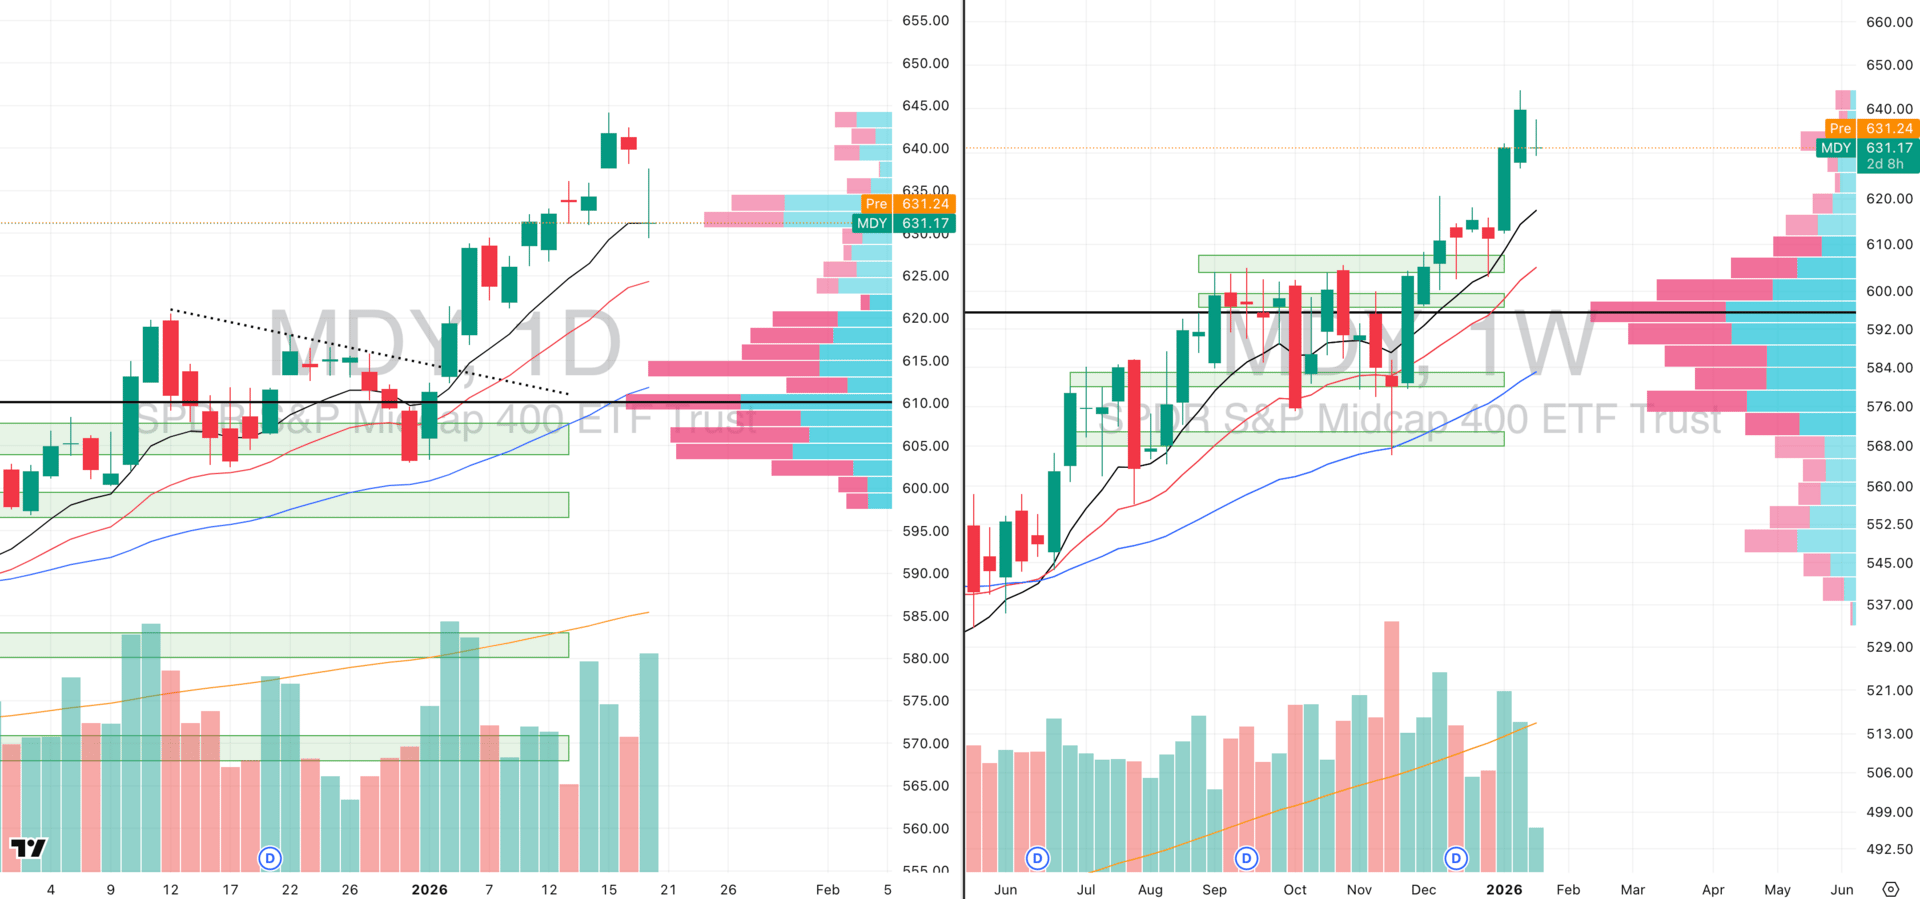
MDY VRVP Daily & Weekly Chart
61.15%: over 20 EMA | 70.67%: over 50 EMA | 66.16%: over 200 EMA
Mid-caps continue to outperform on a relative basis and remain in a confirmed Stage 2 advance.
Yesterday’s session saw an intraday rally of ~1.1% from the gap-down open, but price rejected into a dense supply zone near 638–640.
Volume at those highs suggests trapped long exposure, increasing the probability of near-term pressure.
A gravestone-style rejection formed at the highs; while not statistically decisive on its own, it adds to the broader risk context.
Failure to hold the 10-day EMA would open a path toward the 20-day EMA near 622, effectively retracing roughly 10 sessions of progress.
Deeper downside risk expands toward the December–early January base if selling pressure broadens further.
Russell 2000
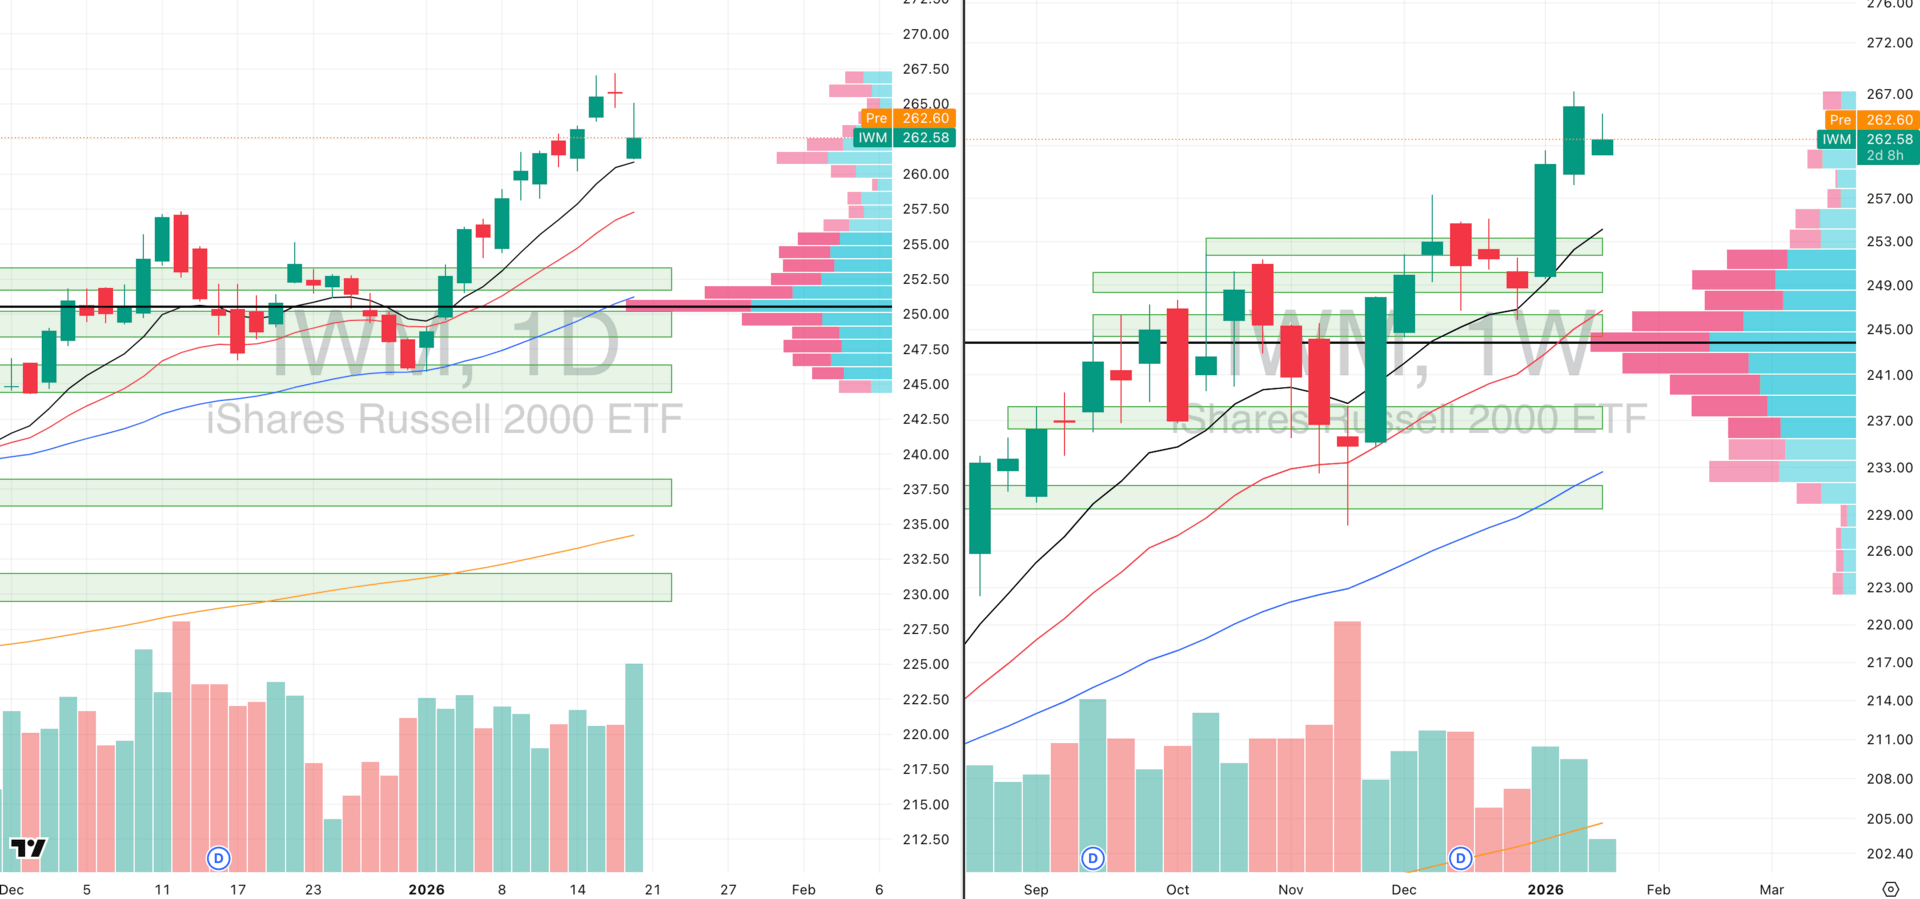
IWM VRVP Daily & Weekly Chart
57.71%: over 20 EMA | 64.62%: over 50 EMA | 65.13%: over 200 EMA
Small caps saw a sharp gap down yesterday of roughly 1.5%, followed by an immediate reaction off the 10-day EMA near 261.
Volume at that level showed a favorable demand skew, with approximately 3.3 million shares traded on upticks versus 2.7 million on downticks.
However, the session also produced a long upper wick after a full gap fill, signaling meaningful supply overhead.
At the highs, selling pressure intensified, with downside volume materially exceeding upside volume.
The resulting candle formed on elevated relative volume (~120% of average), marking the highest turnover since mid-December.
From a trend perspective, the Russell remains the relative strength leader and we are not positioned to fade it.
The key level remains the 10-day EMA near 260.9; consolidation above this level would be a healthy continuation within a Stage 2 advance.
A period of contraction and digestion at highs would be constructive and preferable to further immediate upside.
Vibe code with your voice

Vibe code by voice. Wispr Flow lets you dictate prompts, PRDs, bug reproductions, and code review notes directly in Cursor, Warp, or your editor of choice. Speak instructions and Flow will auto-tag file names, preserve variable names and inline identifiers, and format lists and steps for immediate pasting into GitHub, Jira, or Docs. That means less retyping, fewer copy and paste errors, and faster triage. Use voice to dictate prompts and directions inside Cursor or Warp and get developer-ready text with file name recognition and variable recognition built in. For deeper context and examples, see our Vibe Coding article on wisprflow.ai. Try Wispr Flow for engineers.
FOCUSED STOCK
VIST: Tightness in Leading A Group
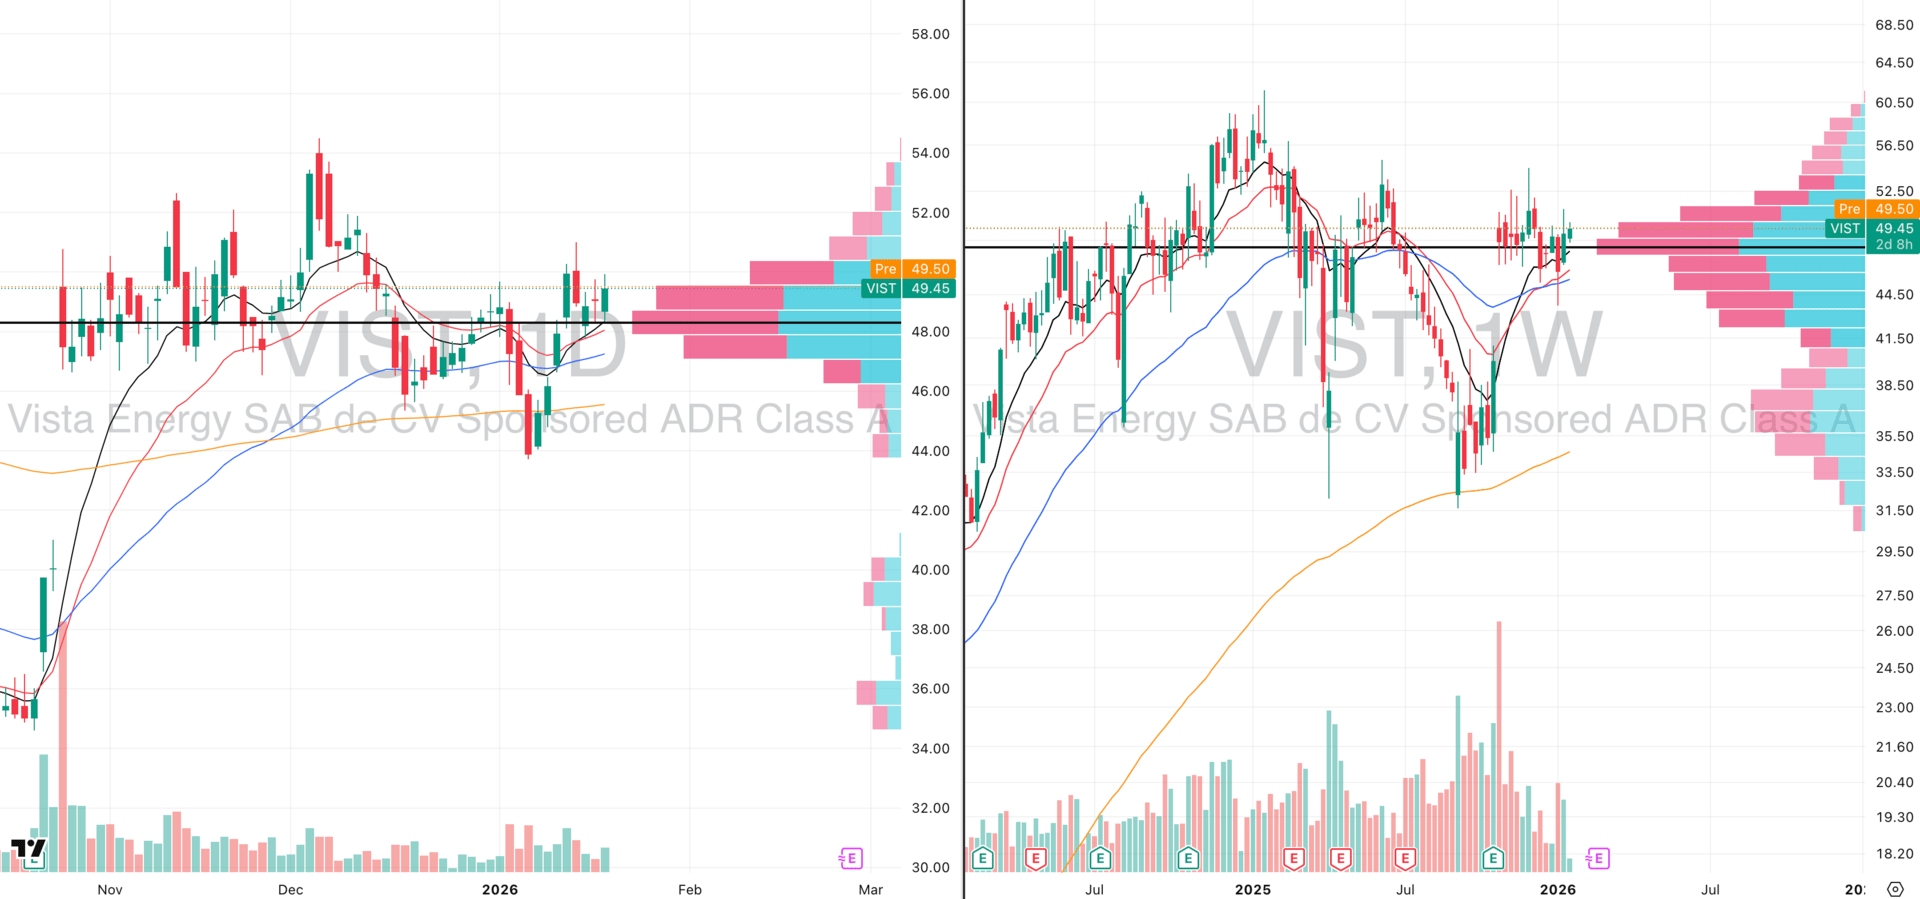
VIST VRVP Daily & Weekly Chart
ADR%: 3.48% | Off 52-week high: -19.8% | Above 52-week low: +56.3%
Vista Energy remains one of the strongest non-U.S. energy names we track, with operations concentrated in Argentina and Mexico and exposure to one of the largest shale developments outside North America.
Relative strength has been persistent since the post-earnings gap on October 27, with price consistently holding above rising 10- and 20-week EMAs.
After a sharp pullback in early January, VIST rebounded aggressively, rallying roughly 15% in four sessions before topping near 51.13 on January 14.
Since that peak, price has transitioned into a clean bull flag, with volatility compressing and range tightening since January 13.
Yesterday’s session was constructive: price undercut the open, tagged the 10-day EMA near 48.24, and reversed higher on expanding relative volume (~93% of the 20-day average).
Importantly, volume has been expanding on upside moves while contracting on pullbacks since the January 8 low which is a good demand signature.
Energy remains a relative outperformer, but VIST stands out due to its limited correlation to U.S. macro risk and its positioning within critical oil and gas infrastructure.
A decisive push through the 50–51 zone would open the door to further upside, but we are not interested in chasing opening-range or breakout highs.
Optimal entries remain pullbacks into rising moving averages, similar to the January 7 and January 15 tests, rather than momentum entries.

Did you find value in today's publication?This helps us better design our content for our readers |
Reply