- Swingly
- Posts
- Why Tech is Breaking Out Today
Why Tech is Breaking Out Today


MARKET ANALYSIS
Here’s What You Need To Know
Markets are pausing this morning, but the pause itself is constructive after the strength seen over the last two sessions.
The key difference now is that the market is no longer trading pure panic around the Strait of Hormuz, but it is also not yet pricing a clean resolution.
Oil remains the main macro variable to watch. Although crude is well below the panic highs from earlier in the week, it is still elevated enough to keep inflation concerns alive, especially with parts of regional energy infrastructure still under pressure and shipping flows through Hormuz remaining thin.
That matters because the market is now trying to balance two conflicting forces at once: easing worst-case war risk on one side, and still-uncomfortable energy pricing on the other.
Futures being little changed this morning reflects exactly that tension. Yesterday’s relief rally was powerful, but after a move of that size the market now needs fresh confirmation rather than just another headline-driven squeeze.
Today’s inflation print is therefore critical. If CPI comes in hot, it will reinforce the idea that the energy shock is already feeding into broader pricing pressure. If it is more contained, it gives the market more room to believe the recent rebound can continue.
In other words, macro focus is starting to shift from pure geopolitics back toward the normal transmission channel: oil into inflation, inflation into rates, and rates into equities.
The bond market is worth watching here as well. Yields are stable to slightly lower this morning, which suggests markets are not yet aggressively repricing another inflation shock, even though energy remains elevated.
Beneath the surface, we are also starting to see the technology complex push back more meaningfully than many would have expected, with semiconductors standing out in particular.
That matters because semis are usually one of the cleaner tells on whether risk appetite is returning in a genuine way or whether a move is just broad short covering.
We have also started to see stronger moves in names like GOOG, and more broadly across the chip complex, which suggests capital is beginning to re-enter some of the prior leadership areas rather than staying entirely defensive.
The caveat is that a lot of this rebound is still happening on relatively light volume, so while the price action is encouraging, it is not yet the kind of high-conviction participation you would want to see to call it a fully confirmed trend change.
That point is especially important in tech, because low-volume rebounds can look impressive for a few sessions and still fail if macro pressure reasserts itself.
We will say more on that in the focused stock section, because the semiconductor response is one of the more important developments in the market right now.
S&P 500
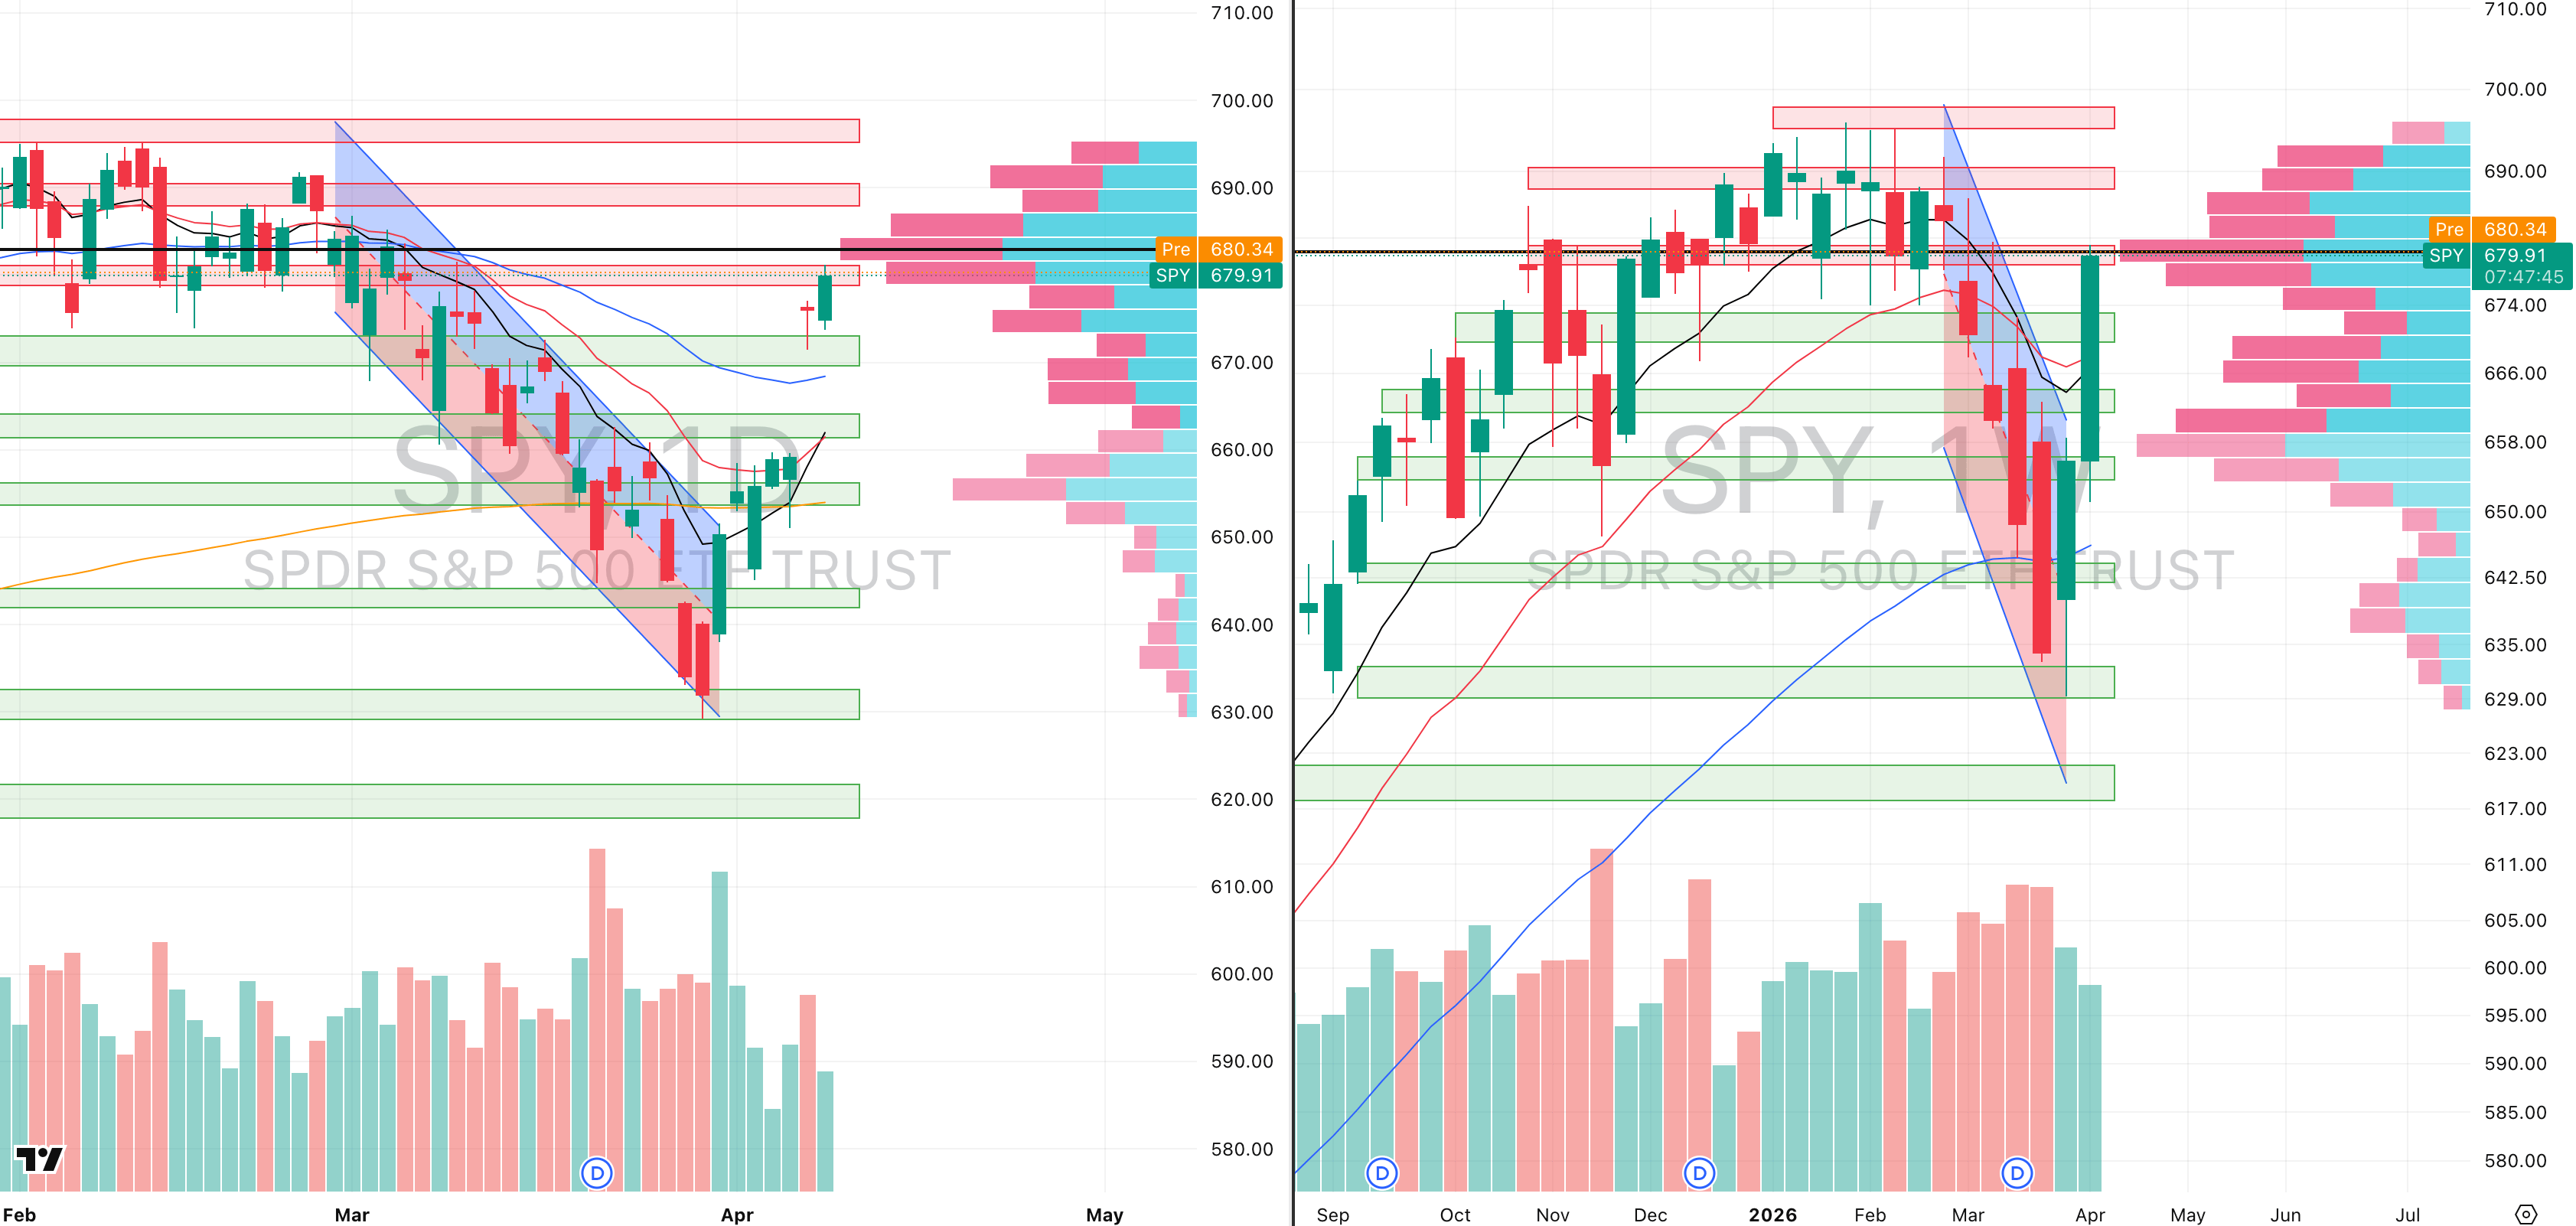
SPY VRVP Daily & Weekly Chart
73.50%: over 20 EMA | 48.20%: over 50 EMA | 55.37%: over 200 EMA
The SPY is still continuing to rally, but it is doing so on very low participation, with yesterday’s session coming in at only 63% of 20-day relative volume, which is exceptionally light for a move of this size.
That low participation suggests much of the current strength is still being driven by selective technical buying rather than broad institutional conviction.
A large part of that is coming from the growth complex, which is important because growth-heavy areas now account for roughly 38% of the SPY weighting, meaning even a narrow rebound in large-cap tech can materially lift the index.
That said, one important phenomenon worth tracking is that in rebounds like this, relative volume does sometimes appear after the initial move, once confidence improves and more participants begin accepting higher prices.
So while low volume remains a concern, it does not automatically invalidate the bounce at this stage.
What matters is that price has now managed to hold above the gap-up lows from Wednesday rather than undercutting them, and from a pure technical perspective that is constructive.
We are also seeing genuine strength emerge from several heavily beaten-down areas that bounced directly off their 50-week EMAs, with names like GOOG and broader tech through XLK standing out.
That means the market is no longer just holding — it is beginning to show selective demand in leadership areas.
We would still remain cautious on opening-range breakout entries because the market has repeatedly punished late momentum buying over recent months.
But equally, the short thesis is clearly proving weaker than expected as price continues to hold and build above the key reclaimed levels.
Nasdaq
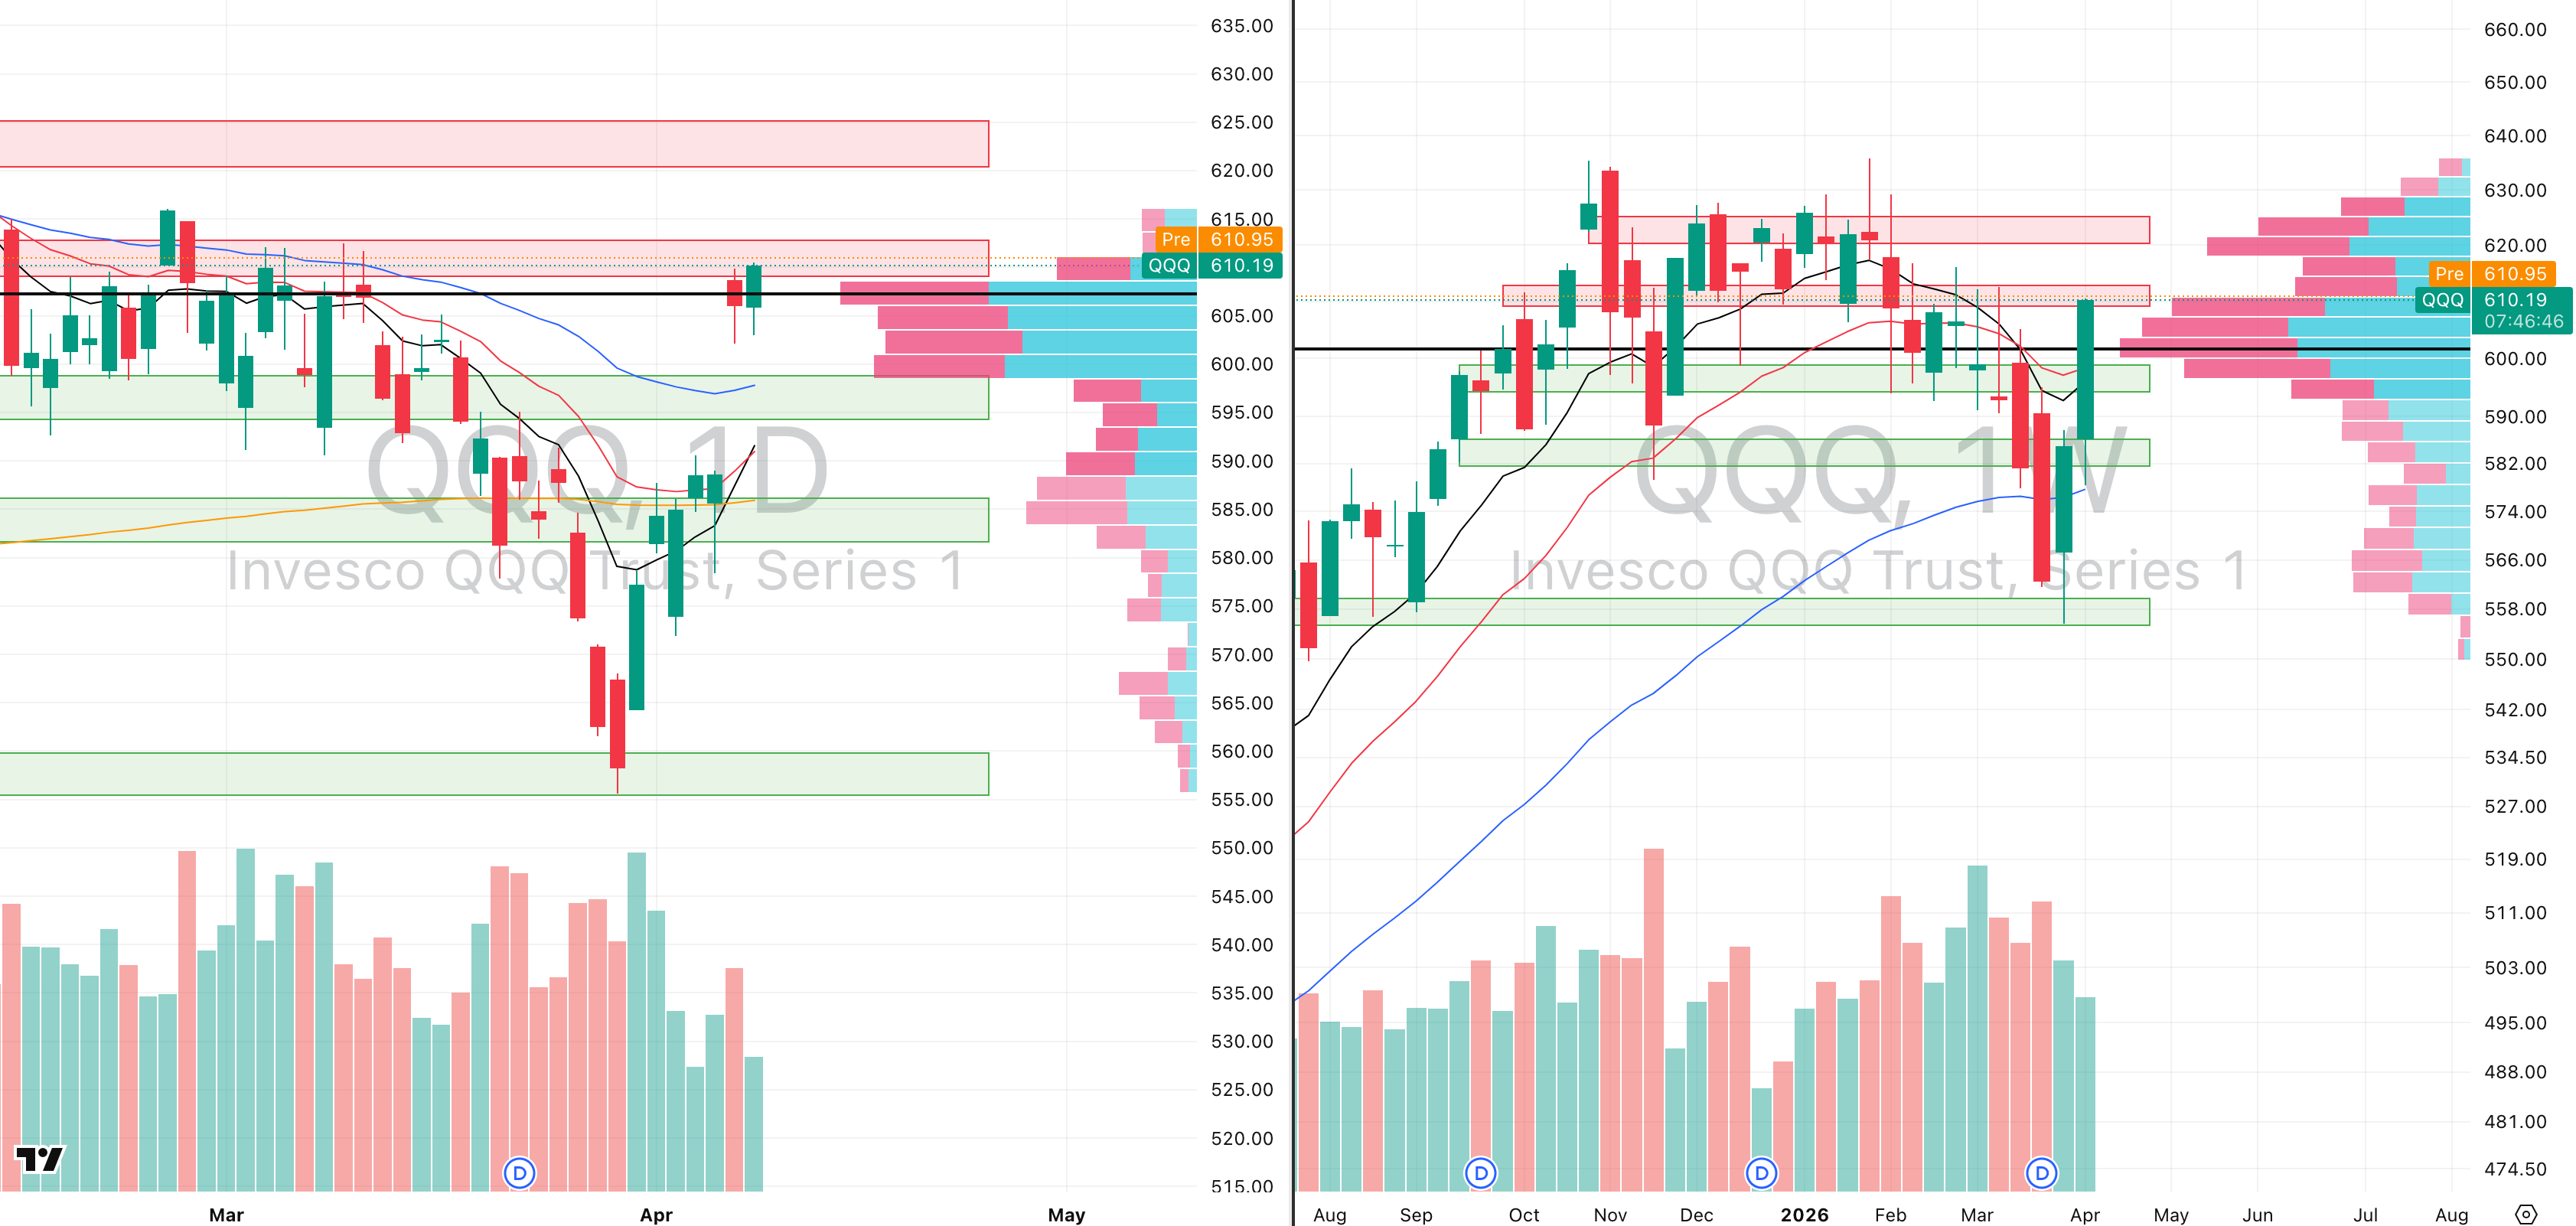
QQQ VRVP Daily & Weekly Chart
62.37%: over 20 EMA | 48.51%: over 50 EMA | 49.50%: over 200 EMA
The Nasdaq printed an even weaker participation profile than the SPY, with yesterday’s session closing at only 55% relative volume, which is extremely low by any normal standard.
However, exactly as we outlined with the SPY, price itself is doing the heavy lifting right now.
We are seeing the important recovery mechanism where lows are being lifted session by session, and two consecutive candles have now shown buyers stepping in at lower levels.
That matters because it tells you demand is appearing where it should.
Relative volume remains critical to monitor here because the Nasdaq is now trading directly into a very dense overhead supply zone on the visible range volume profile.
There is still significant trapped inventory above current price, which means upside continuation becomes harder unless participation improves.
Structurally, all the clean entries that existed in this move were the pullback longs off the 20-month EMA / 50-week EMA zone near $560.
That area offered the best asymmetry because it aligned with long-term support and panic extension.
At current levels, we would now be more cautious on breakout entries because the market has repeatedly shown a tendency since summer 2025 to shake out late buyers once price reaches visible supply.
That remains the key near-term risk here: a pullback that punishes late momentum while preserving the broader bounce.
S&P 400 Midcap
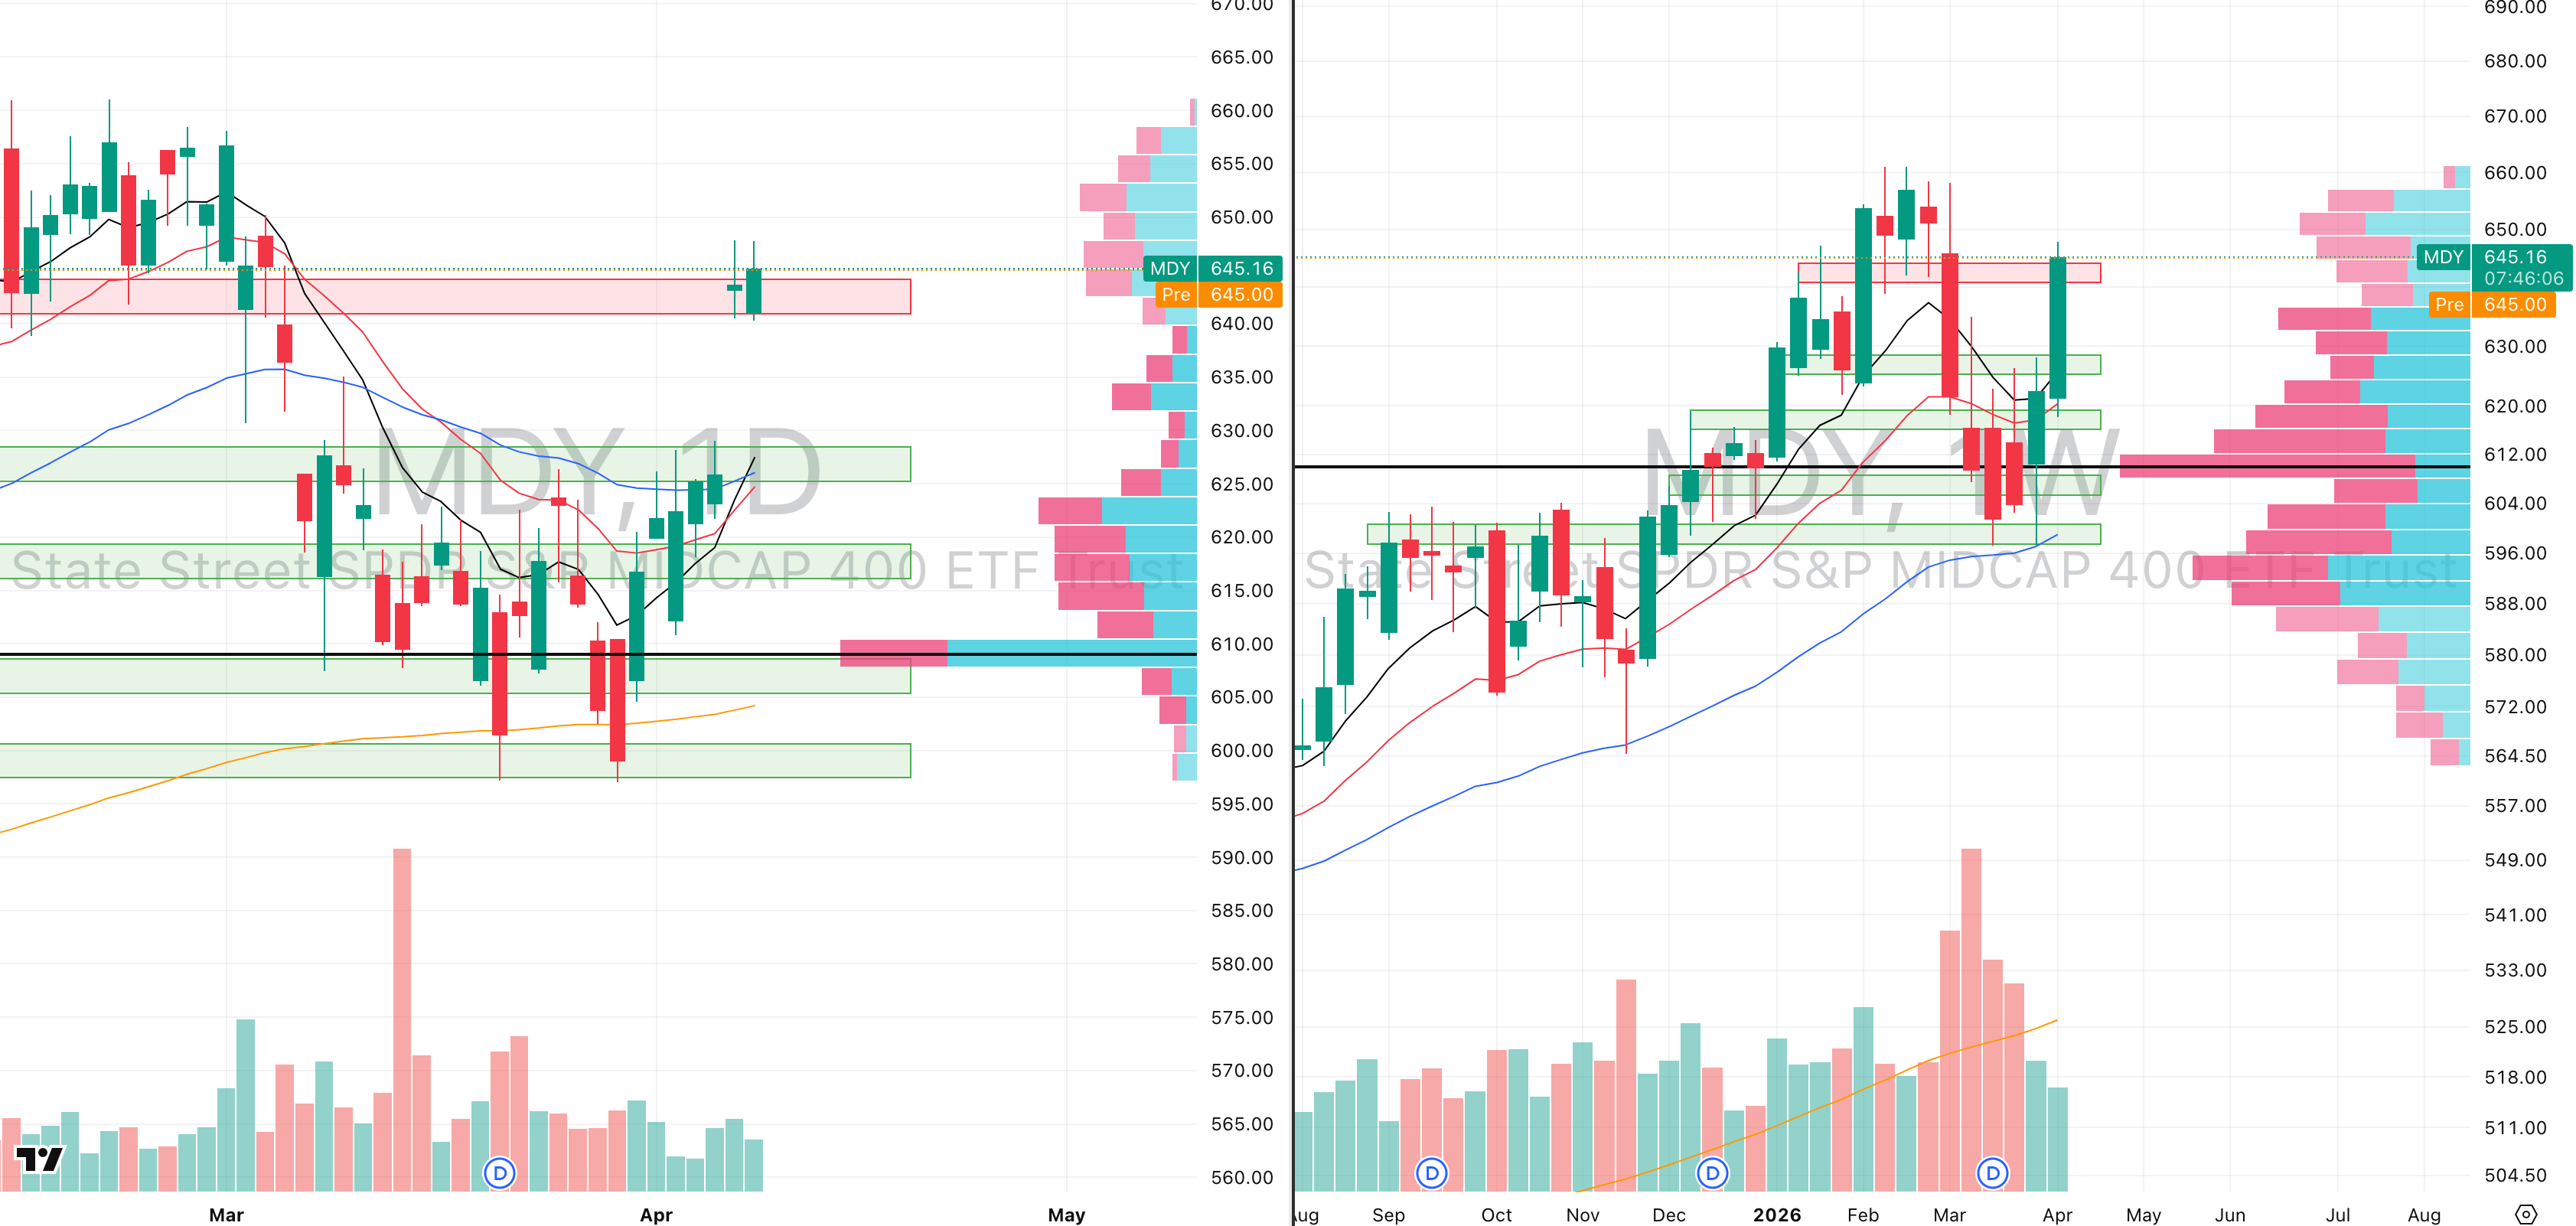
MDY VRVP Daily & Weekly Chart
80.00%: over 20 EMA | 52.00%: over 50 EMA | 59.50%: over 200 EMA
Mid-caps are showing the same declining relative volume profile as the other indices, but breadth remains one of the strongest supportive factors here.
More than 80% of MDY constituents are still trading above their 20-day EMA, which is an extremely elevated breadth reading.
Normally, readings like that imply the market is becoming stretched short term, but they also confirm that participation beneath the surface remains broad.
What was especially notable yesterday is that MDY came extremely close to breaking the gap-up lows, yet ultimately held.
That is a strong technical signal because it means sellers had the opportunity to force a deeper retracement and failed.
The most likely near-term path still remains sideways consolidation, because breadth is already elevated and the market needs time to digest the move.
But at the same time, this degree of strength should not be ignored simply because sentiment remains cautious.
Broadly across the market, both 20-day and 50-day EMA breadth are rising, which tells you underlying participation is improving even if headline volume remains soft.
Russell 2000
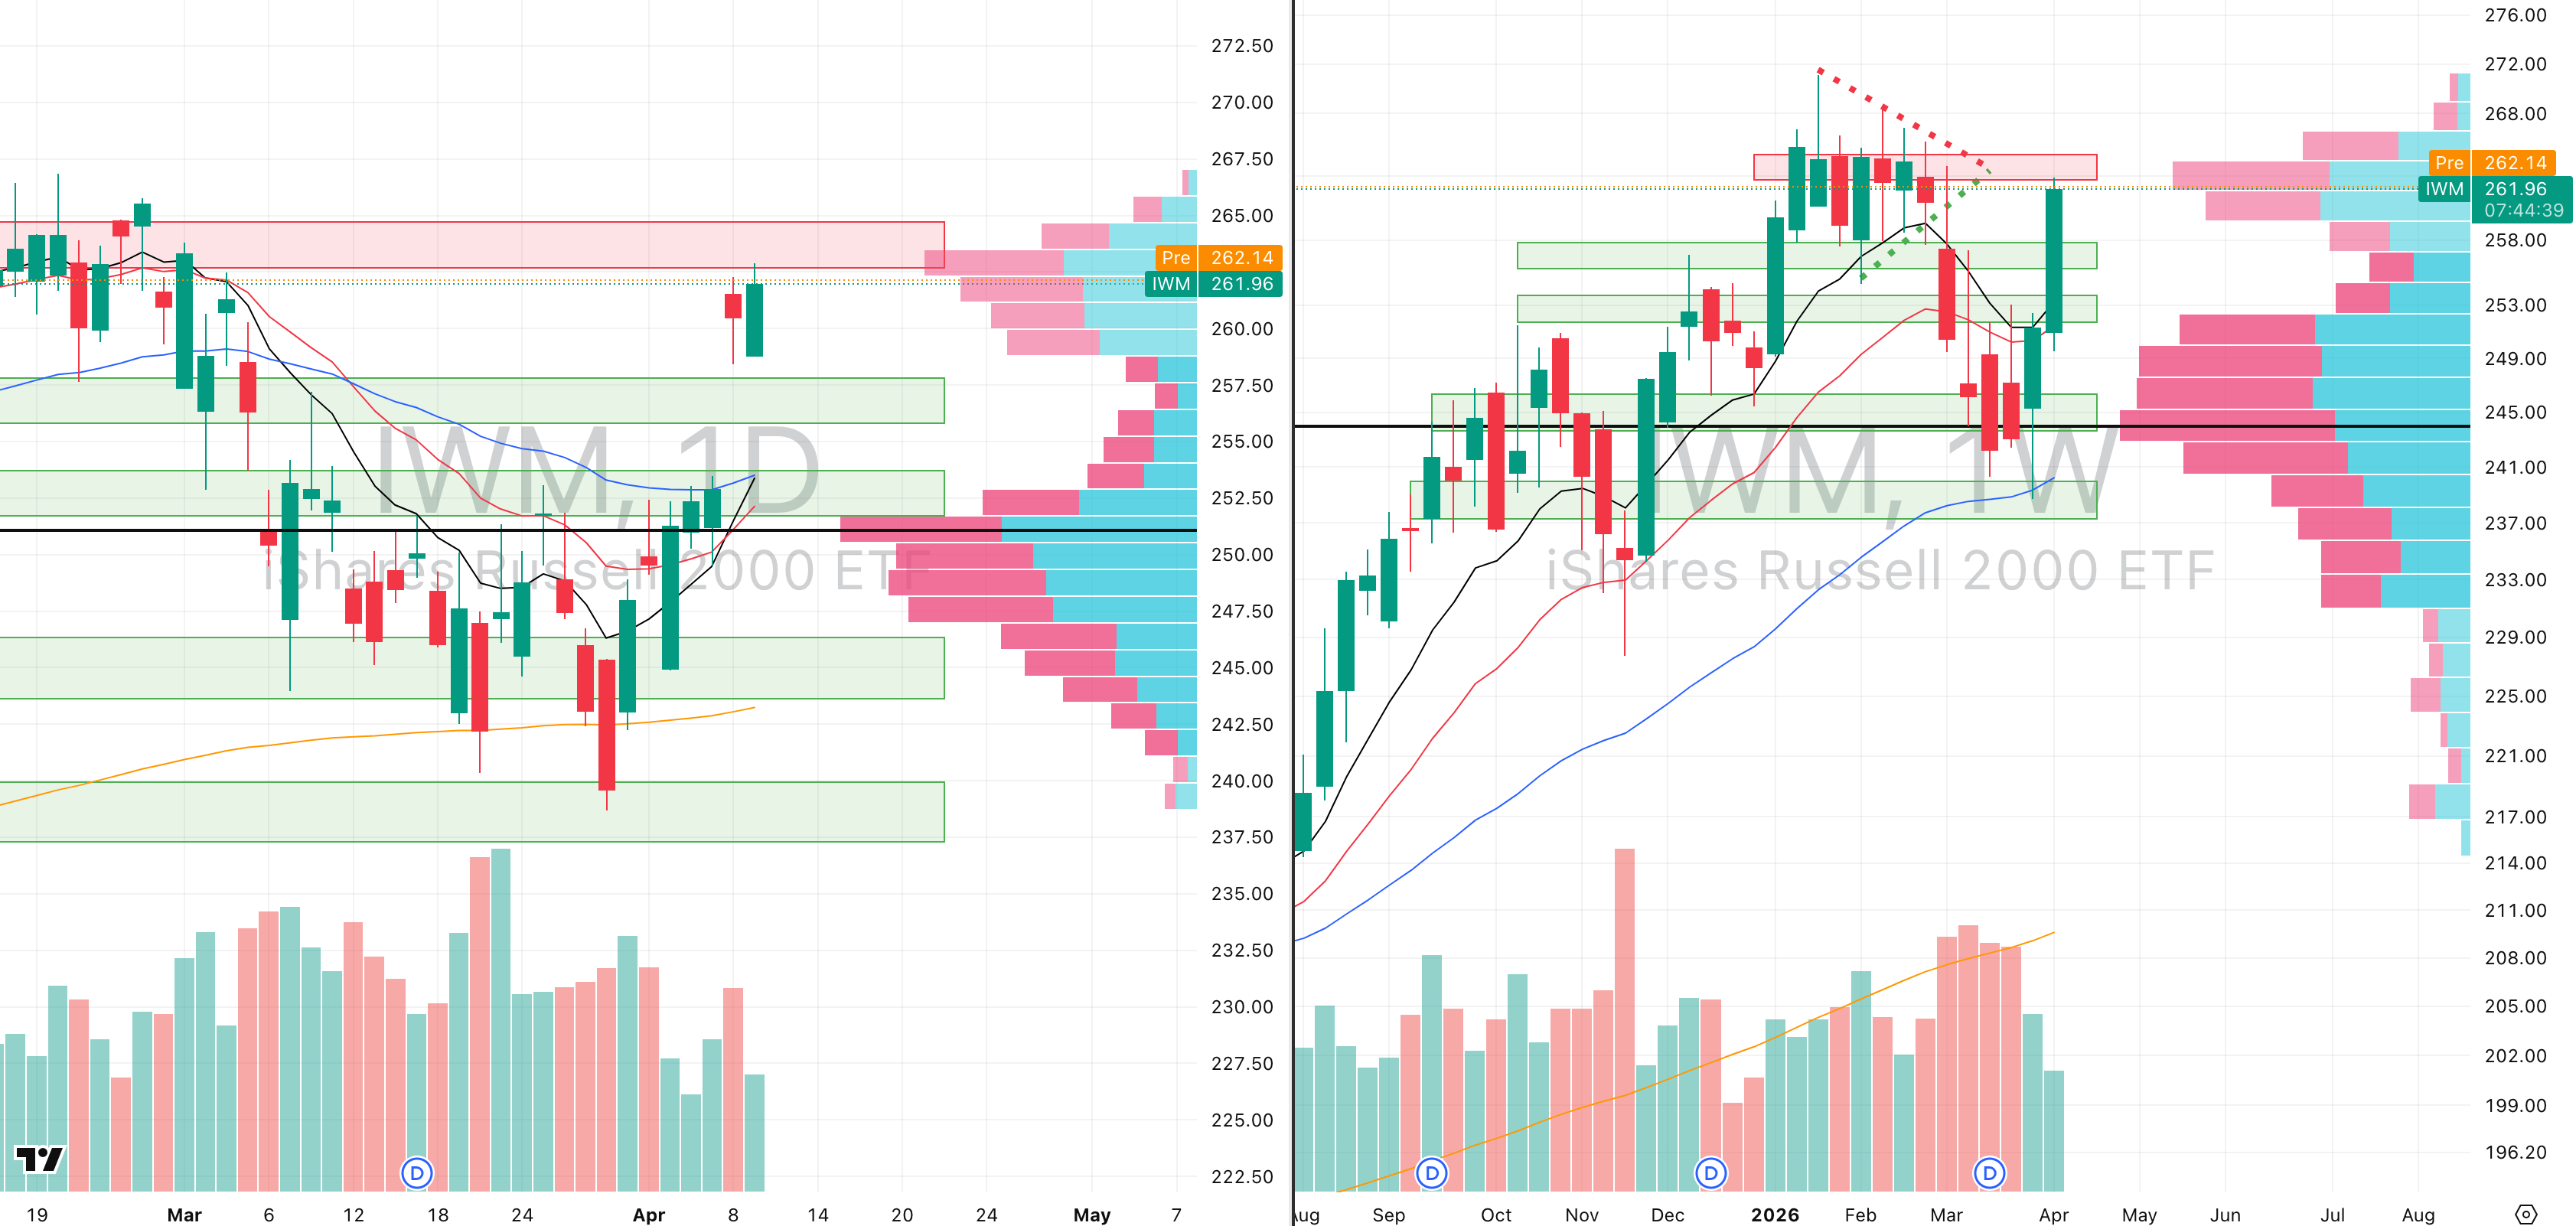
IWM VRVP Daily & Weekly Chart
76.13%: over 20 EMA | 57.56%: over 50 EMA | 57.61%: over 200 EMA
The Russell 2000 continues to stand out as one of the strongest segments of the market right now.
It is now sitting only around 3% below its 52-week highs, which is remarkable considering how volatile the broader macro backdrop remains.
This week’s candle range is already near 5%, which is roughly 20% greater than the Russell’s normal weekly range, so the magnitude of the move itself is statistically significant.
Relative volume remains the major caveat, with yesterday’s session only printing around 58% of the 20-day average, which again is very light.
But despite that, what matters is relative response.
Of all major market segments, the Russell has actually responded best to this rebound.
That tells you capital is rotating into smaller cyclically sensitive names more aggressively than many expected.
The most likely near-term outcome remains sideways consolidation, simply because the move has become short-term extended.
But from a comparative strength perspective, the Russell is still one of the clearest areas showing genuine relative leadership right now.
FOCUSED STOCK
NVDA: Semiconductors Beginning To Push
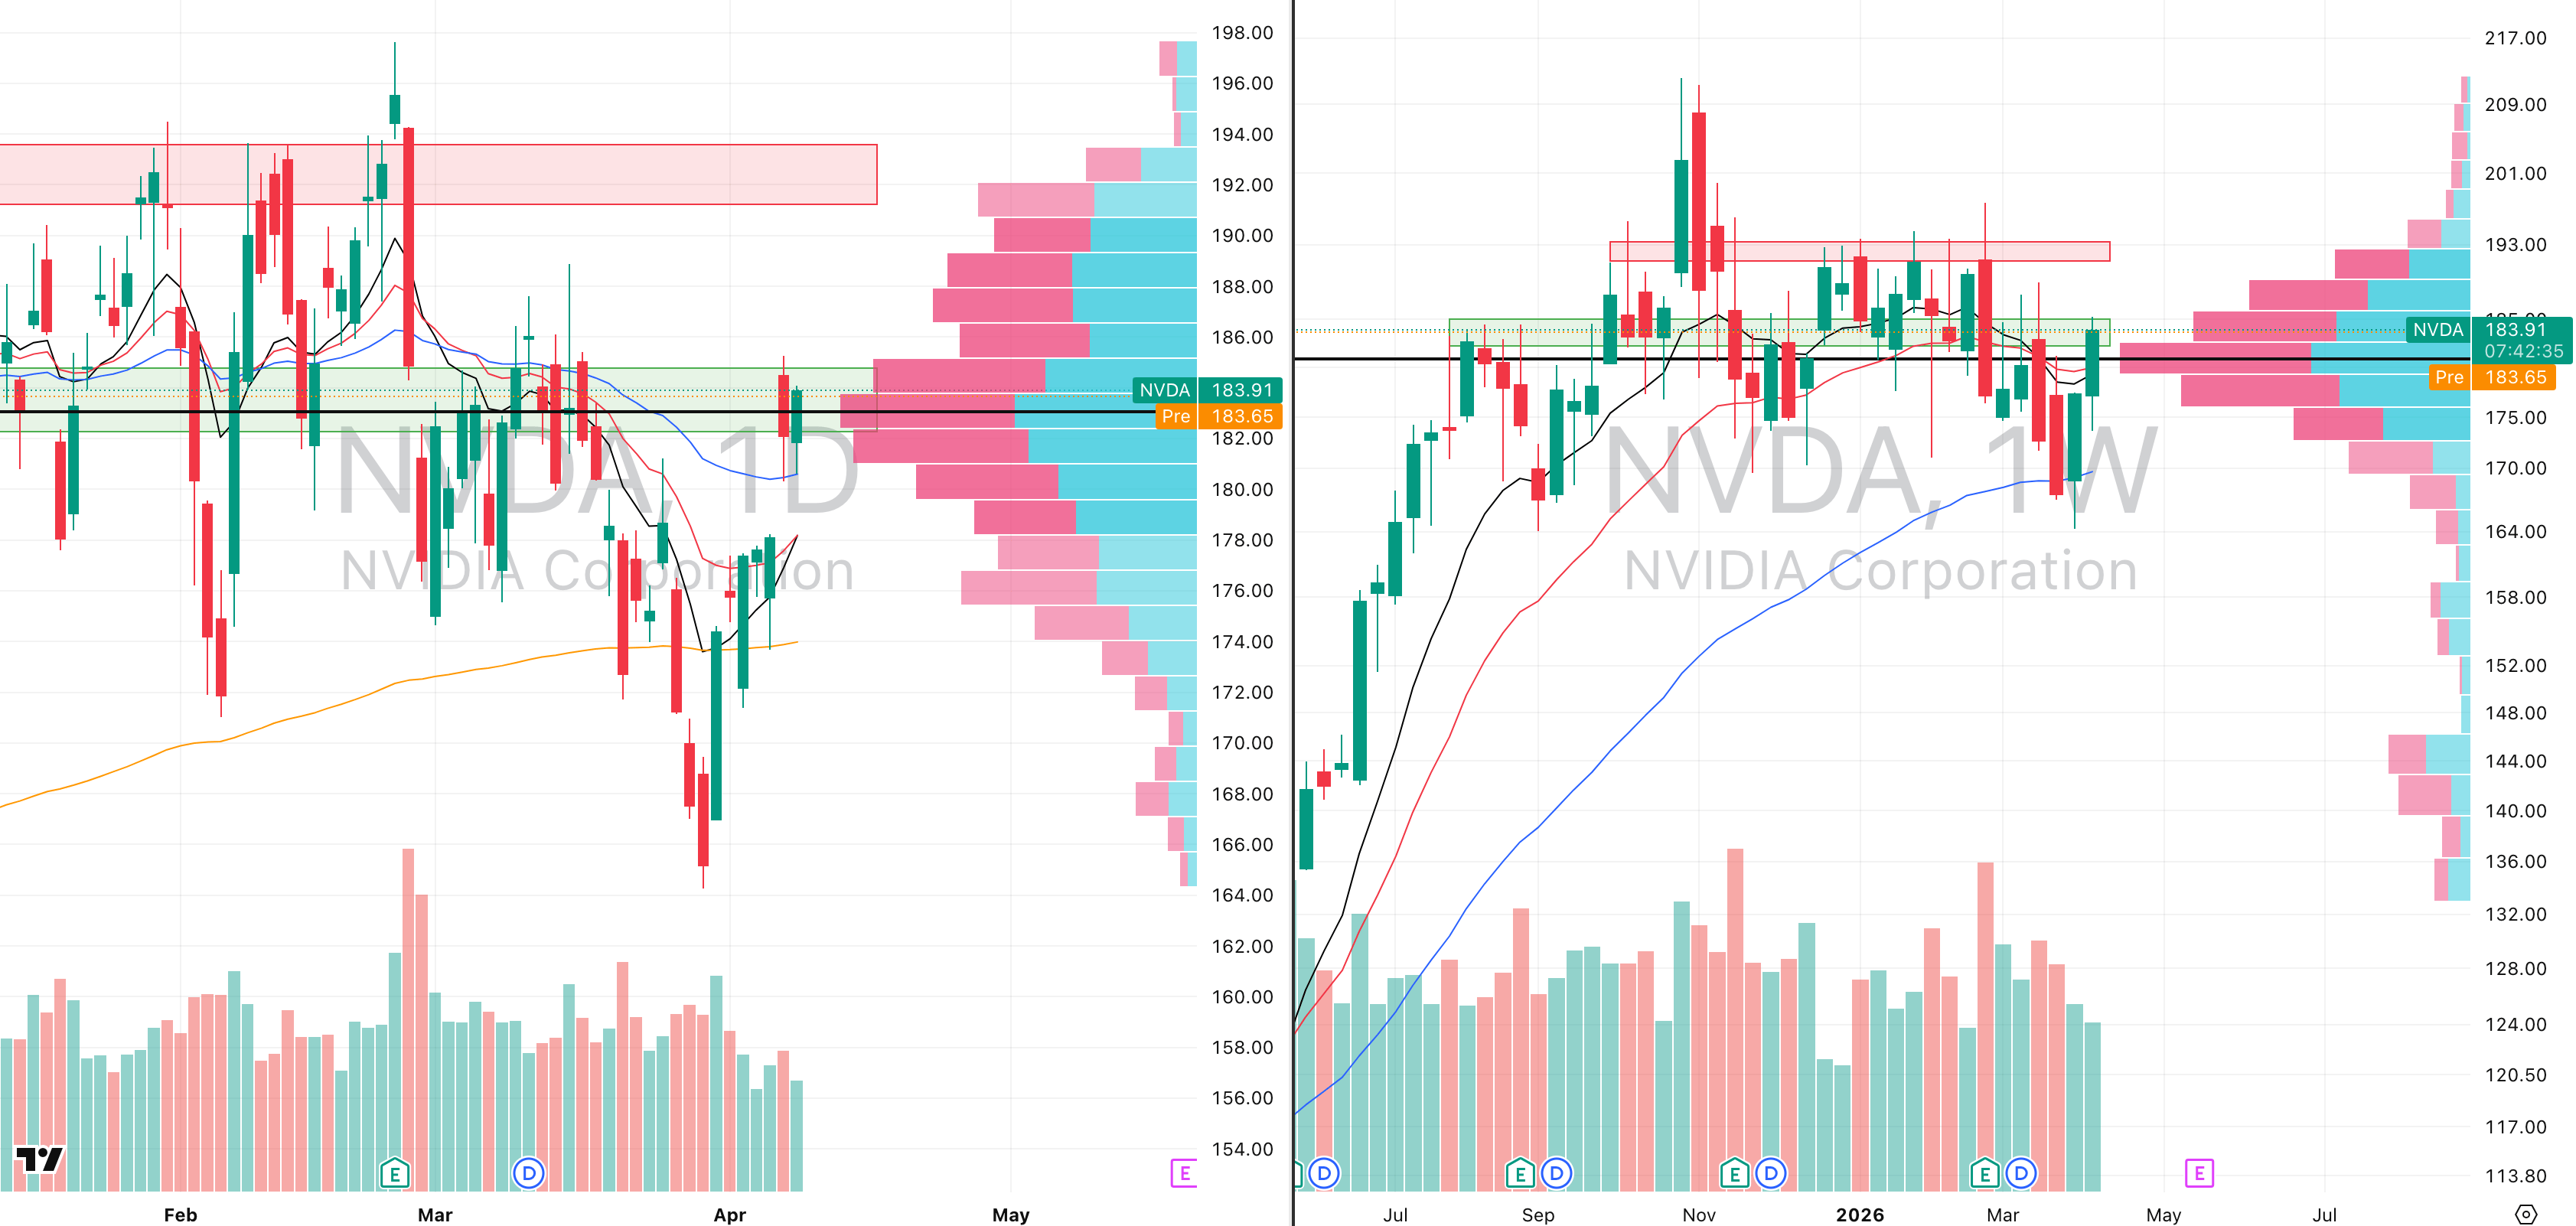
NVDA VRVP Daily & Weekly Chart
ADR%: 2.59% | Off 52-week high: -13.3% | Above 52-week low: +112.4%
NVDA has now been building a Stage 1 base for roughly 245 days, with that structure dating back to 28 July 2025, which means price has spent the better part of nine months absorbing prior supply rather than trending impulsively.
That is important because longer base structures typically create far cleaner asymmetry when they eventually resolve, particularly when they form after major prior leadership.
During this entire period, price has repeatedly tested and held the 50-week EMA, most recently around $170, where the stock held for two consecutive weeks.
That repeated defense of long-term support tells you institutions are still prepared to absorb supply at that level rather than allowing deeper structural damage.
What makes NVDA especially important right now is the visible range volume profile, where there is a clear low-volume pocket between current price near $184 and the next major supply zone around $191.32.
That creates a technically clean upside window of roughly +3.77%, because once price enters low-volume territory it often moves quickly until the next dense seller cluster is reached.
This is developing at the same time that broader semiconductors are beginning to show renewed strength, with several names across the semiconductor complex bouncing constructively alongside broader tech.
In that context, NVDA is arguably showing one of the cleanest large-cap base structures in the entire market right now.
The fact that this base is now approaching almost one full year in duration materially increases its technical significance, because prolonged consolidation often reflects a large transfer of shares from weak hands to stronger longer-term holders.
We are paying very close attention here because if semiconductors continue to expand, NVDA is structurally one of the highest-quality names to monitor for continuation.
We have also attached below the other semiconductor names currently on our radar, because strength is broadening across the group rather than appearing in NVDA alone:
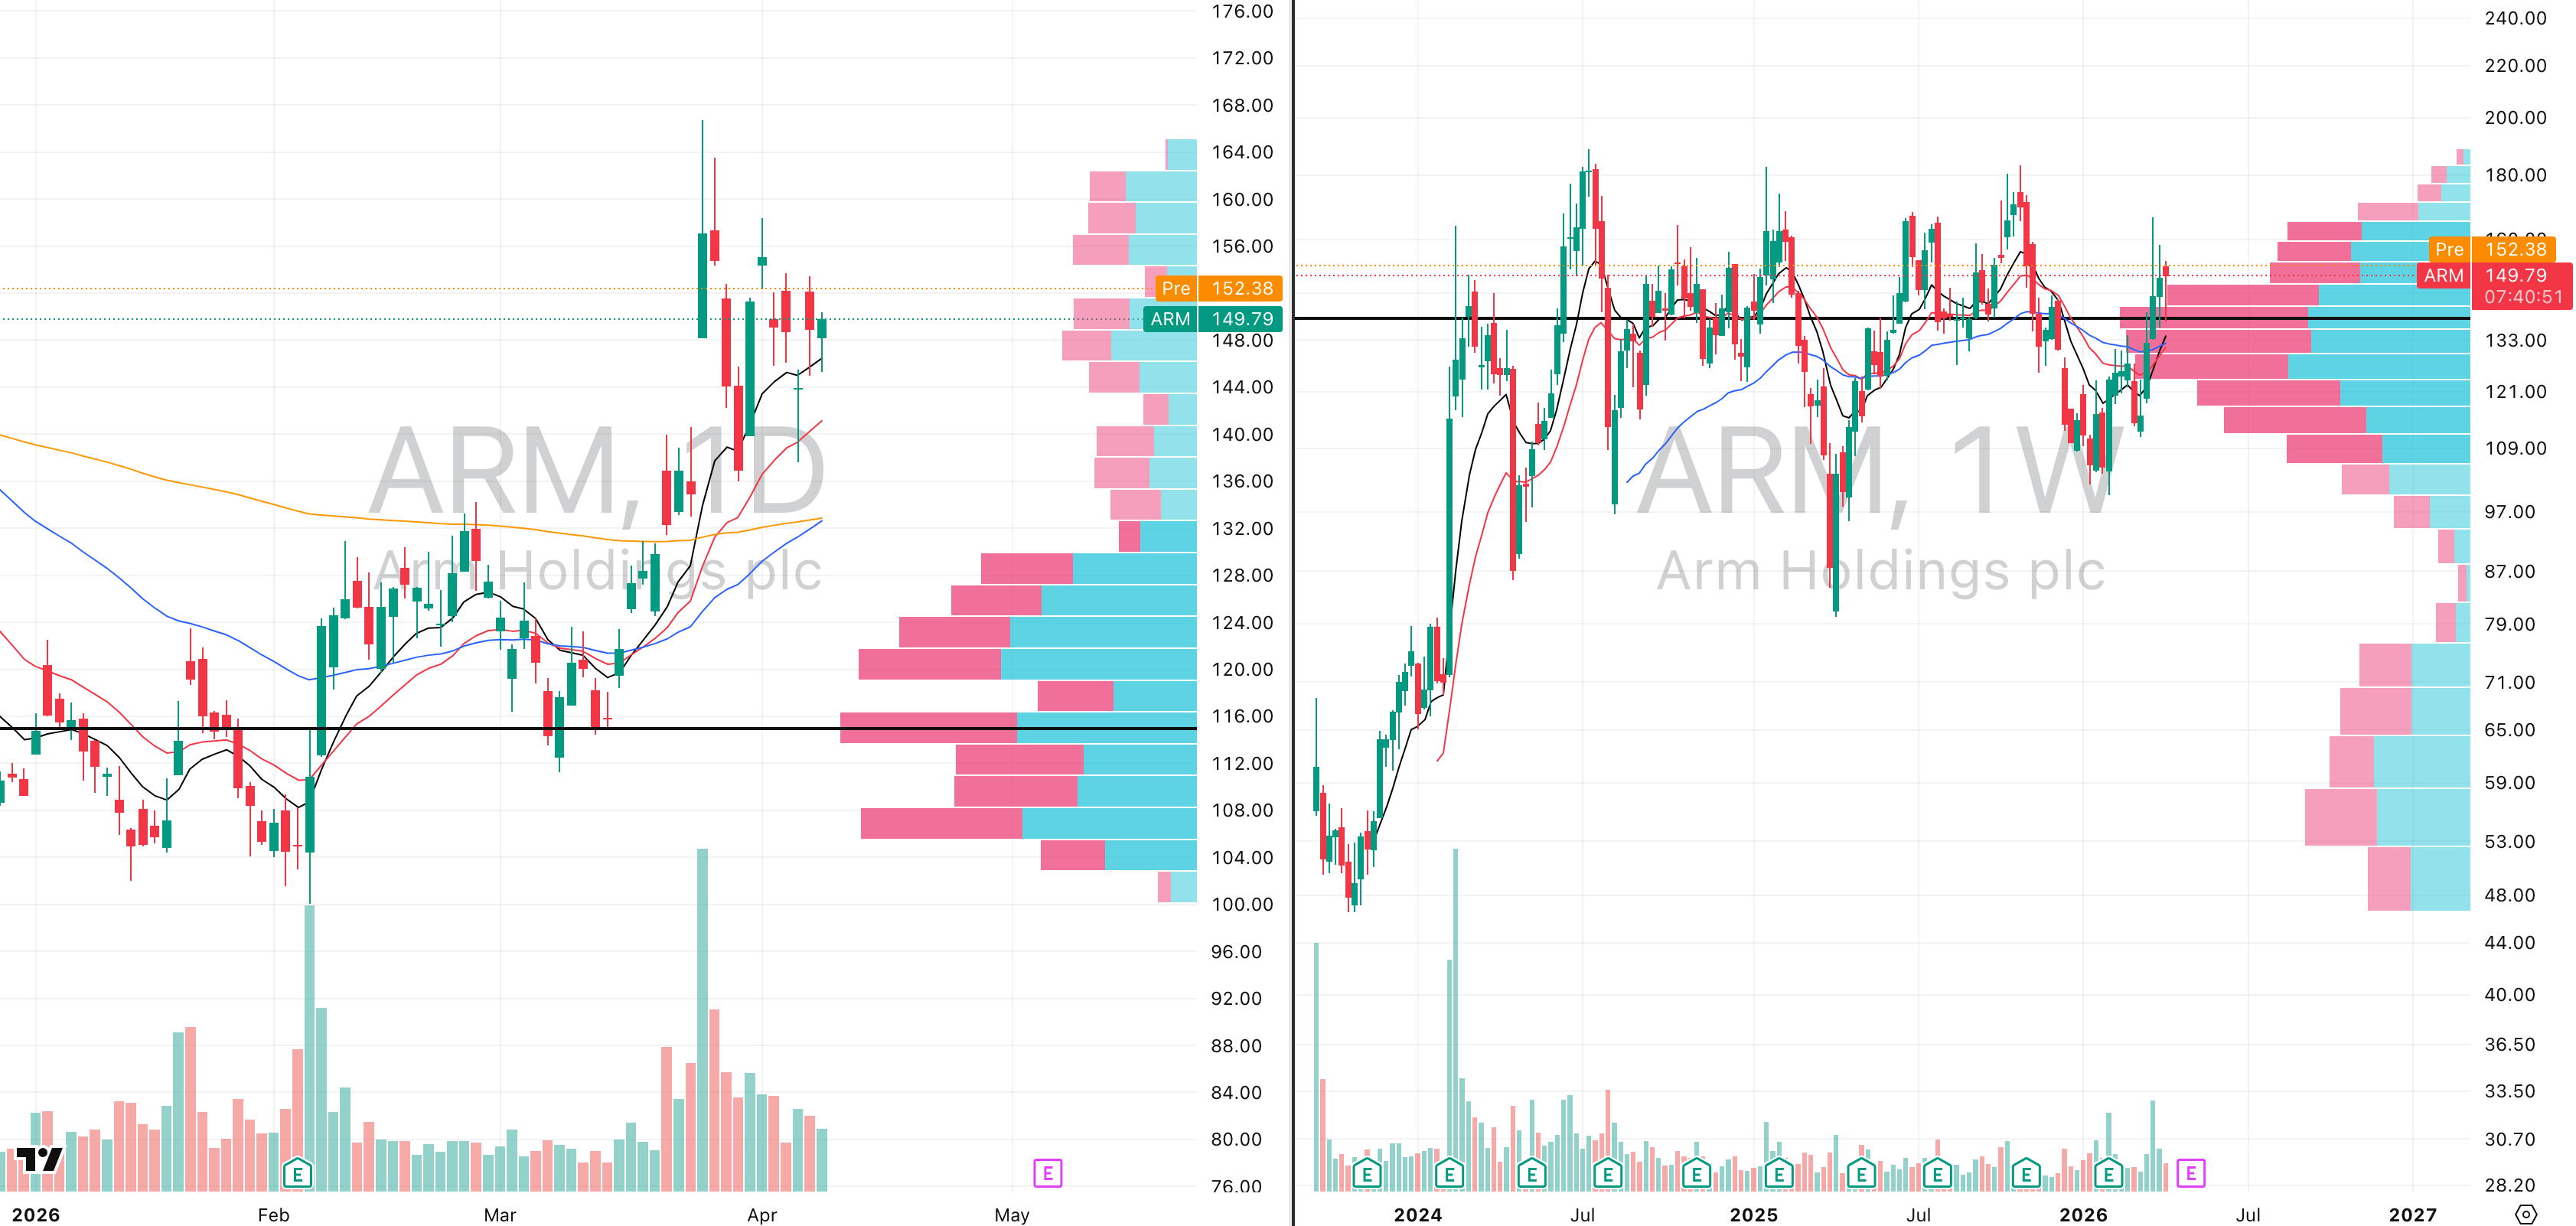
ARM VRVP Daily & Weekly Chart
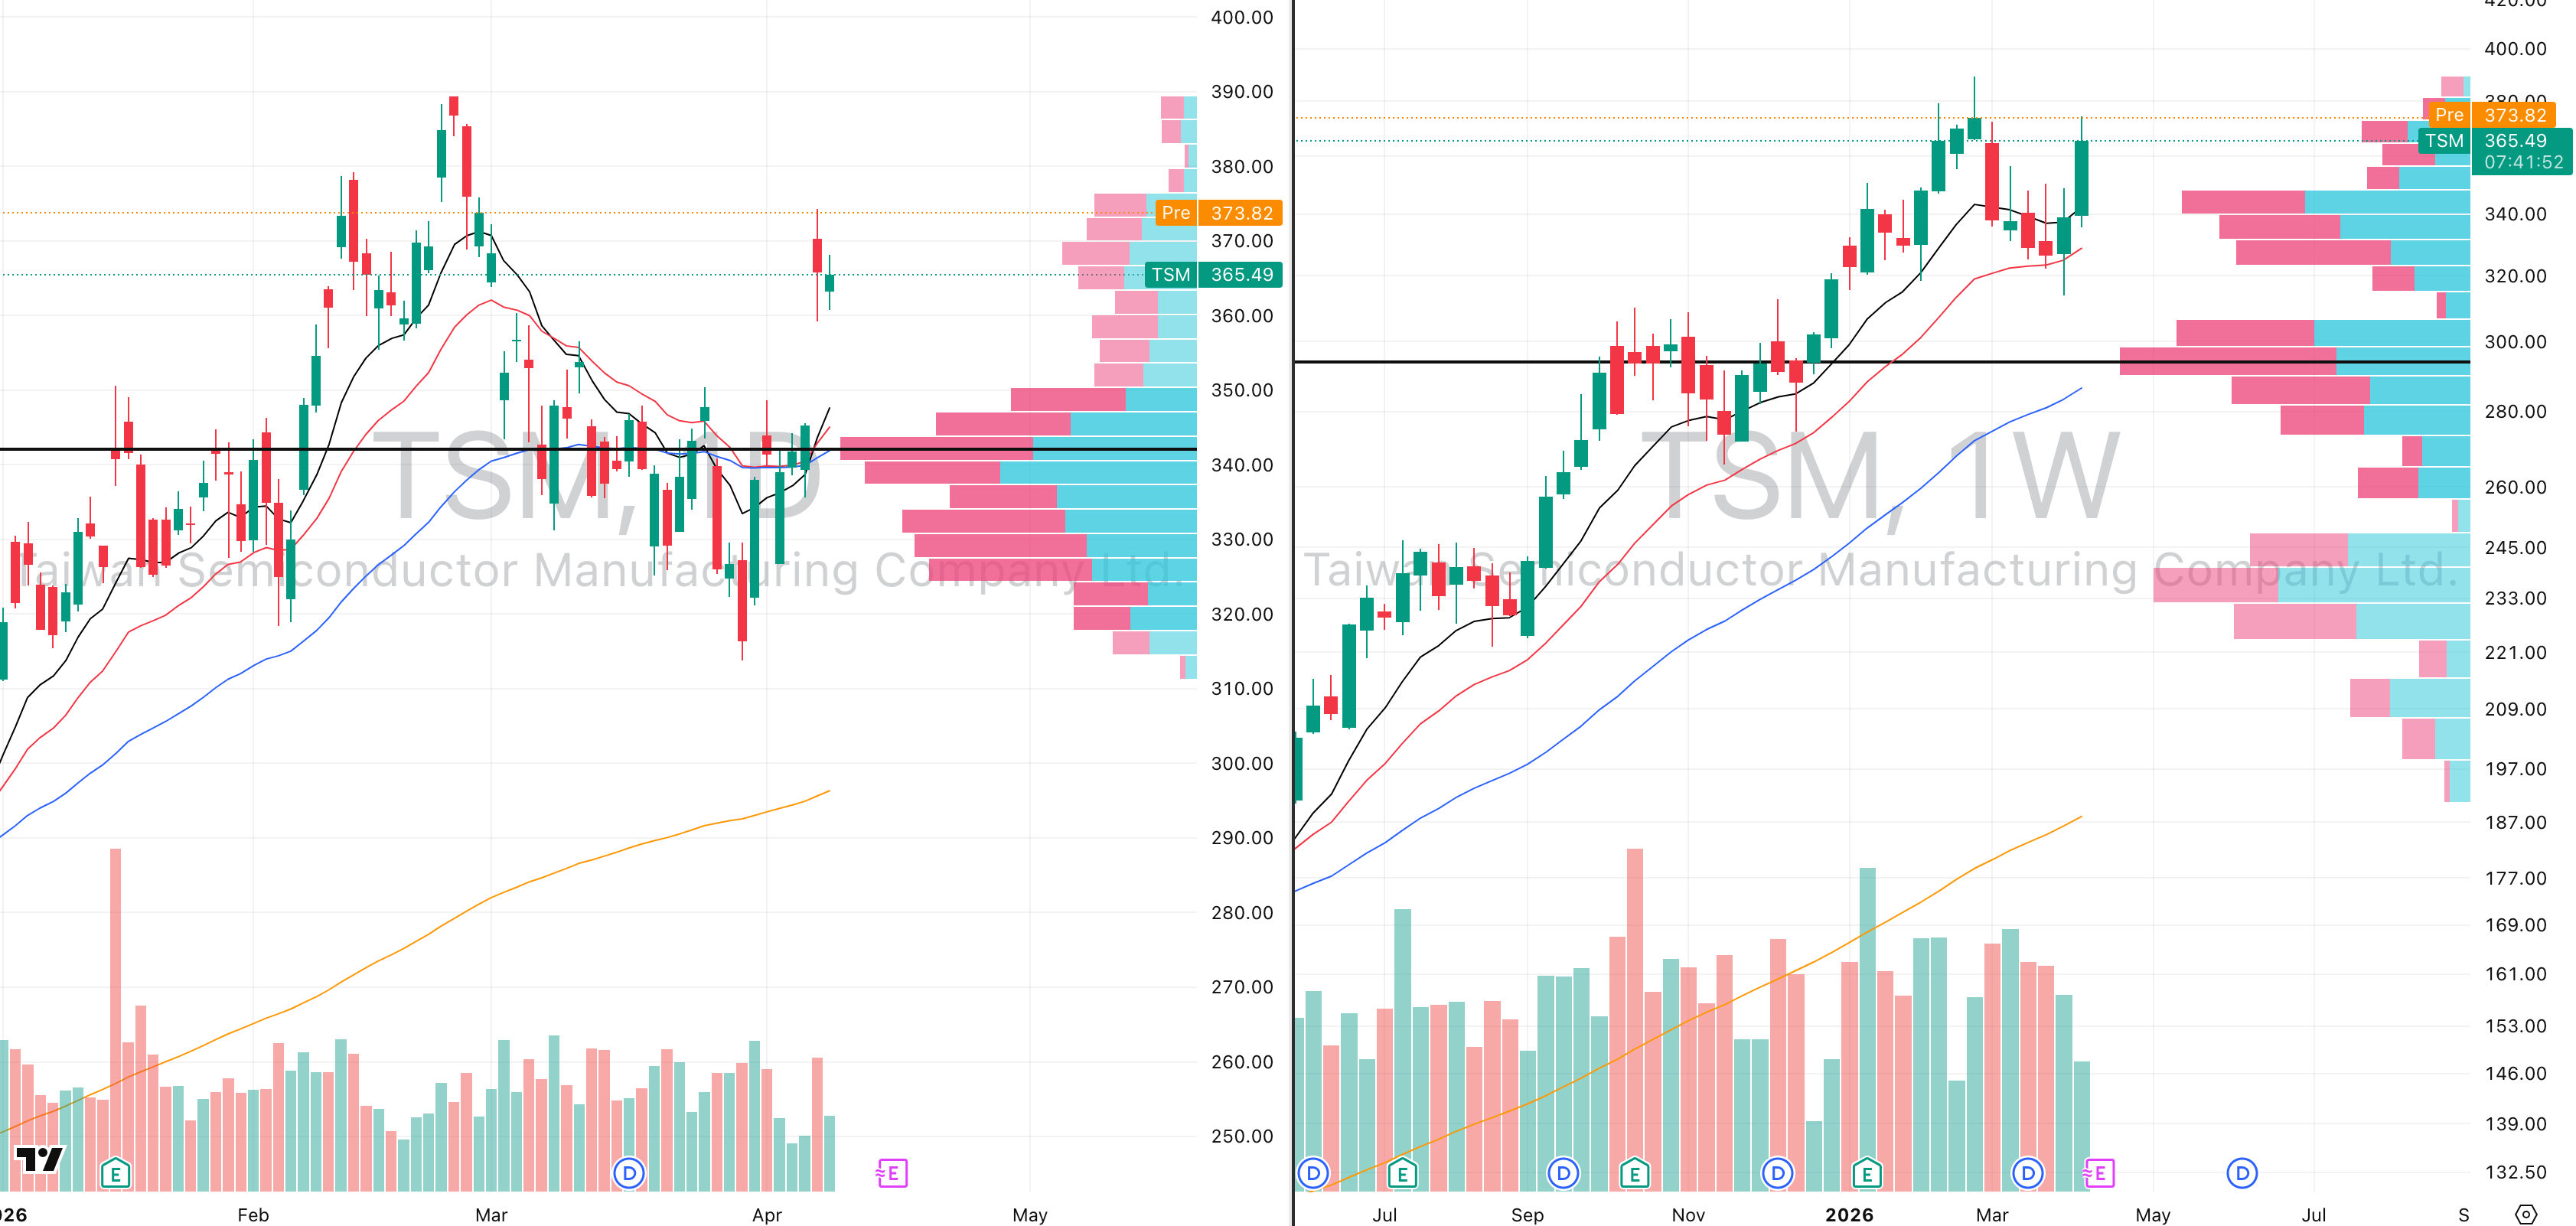
TSM VRVP Daily & Weekly Chart
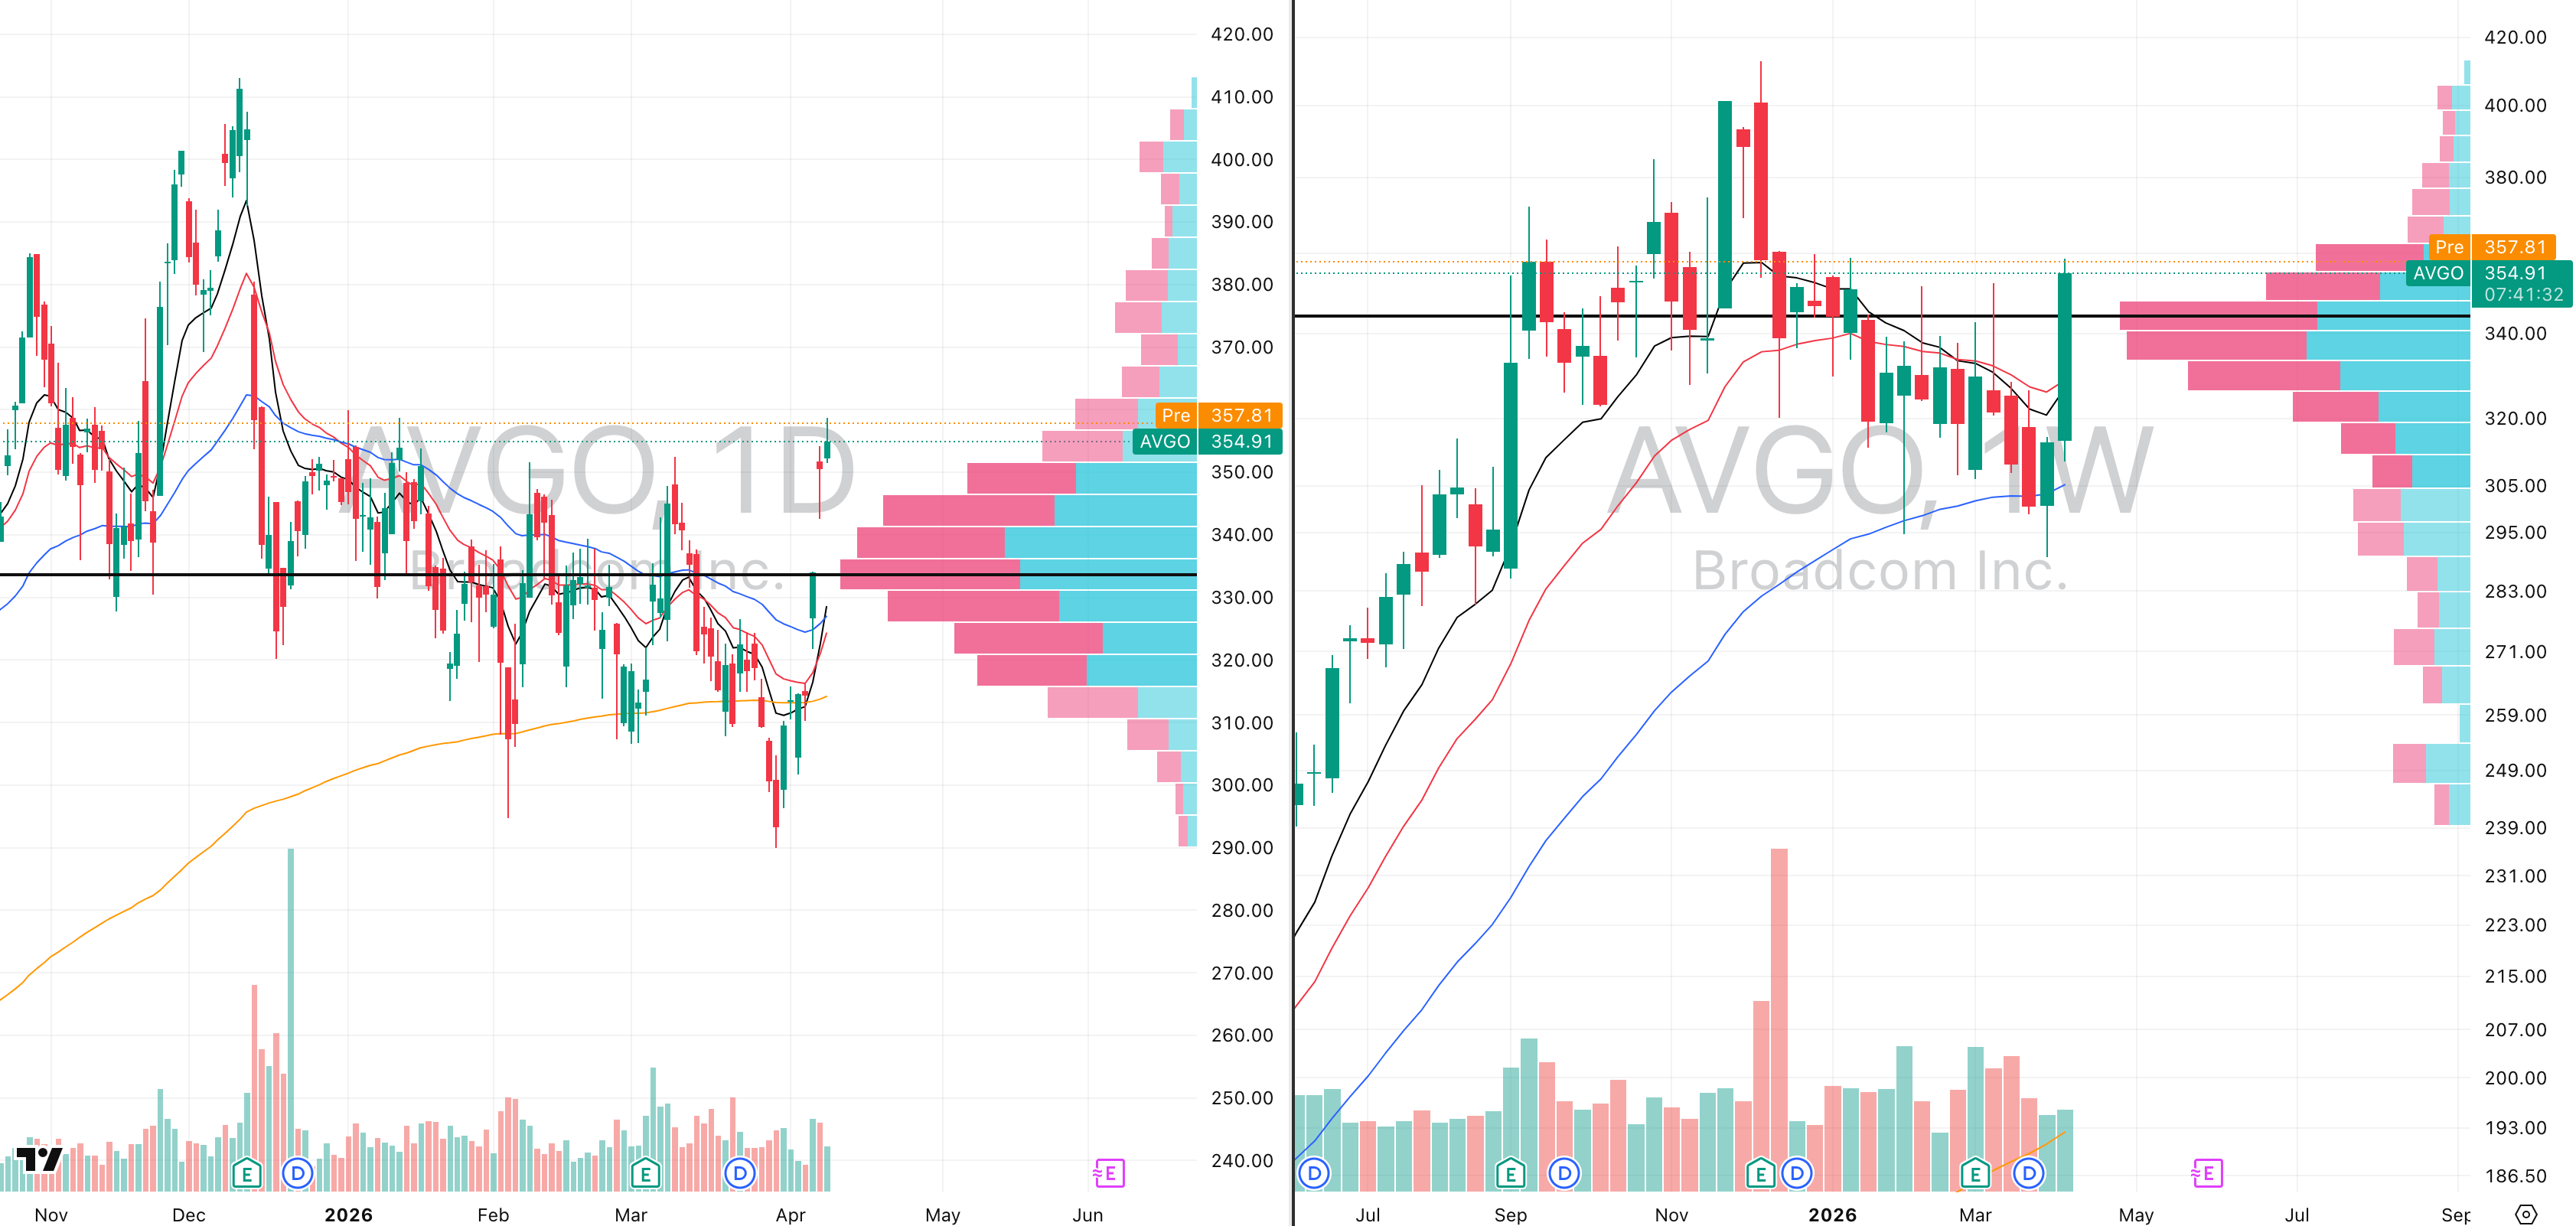
AVGO VRVP Daily & Weekly Chart

Did you find value in today's publication?This helps us better design our content for our readers |
Reply