- Swingly
- Posts
- Why Chasing Highs Keeps Failing Right Now
Why Chasing Highs Keeps Failing Right Now


MARKET ANALYSIS
Here’s What You Need To Know

Thursday was a messy, headline-driven session, but this is not a market that rewards chasing highs or pressing longer-term swing entries.
Early strength was driven by semiconductors and financials, with Taiwan Semiconductor’s earnings and forward capex commentary reaffirming that AI spending is not rolling over, despite recent volatility in mega-cap tech (which from a strictly price action perspective, do look weak).
That said, indexes finished well off their intraday highs, which reinforces the theme we’ve been highlighting: this is not a smooth, trend-day market, but rather one defined by rotations, shakeouts, and selective leadership.
Volatility remains elevated due to persistent headline risk, which increases the probability of shakeouts and false starts, making tight risk management non-negotiable.
Financials provided support early following strong bank earnings, though participation narrowed as the session progressed, adding to the choppy feel.
From a macro perspective, falling oil prices helped stabilize risk, easing some inflation and geopolitical pressure that had weighed on sentiment earlier in the week.
Until we see sustained expansion with follow-through, pullbacks remain the highest-probability setup, and longer-term swing trades should be approached with caution or reduced size.
Nasdaq
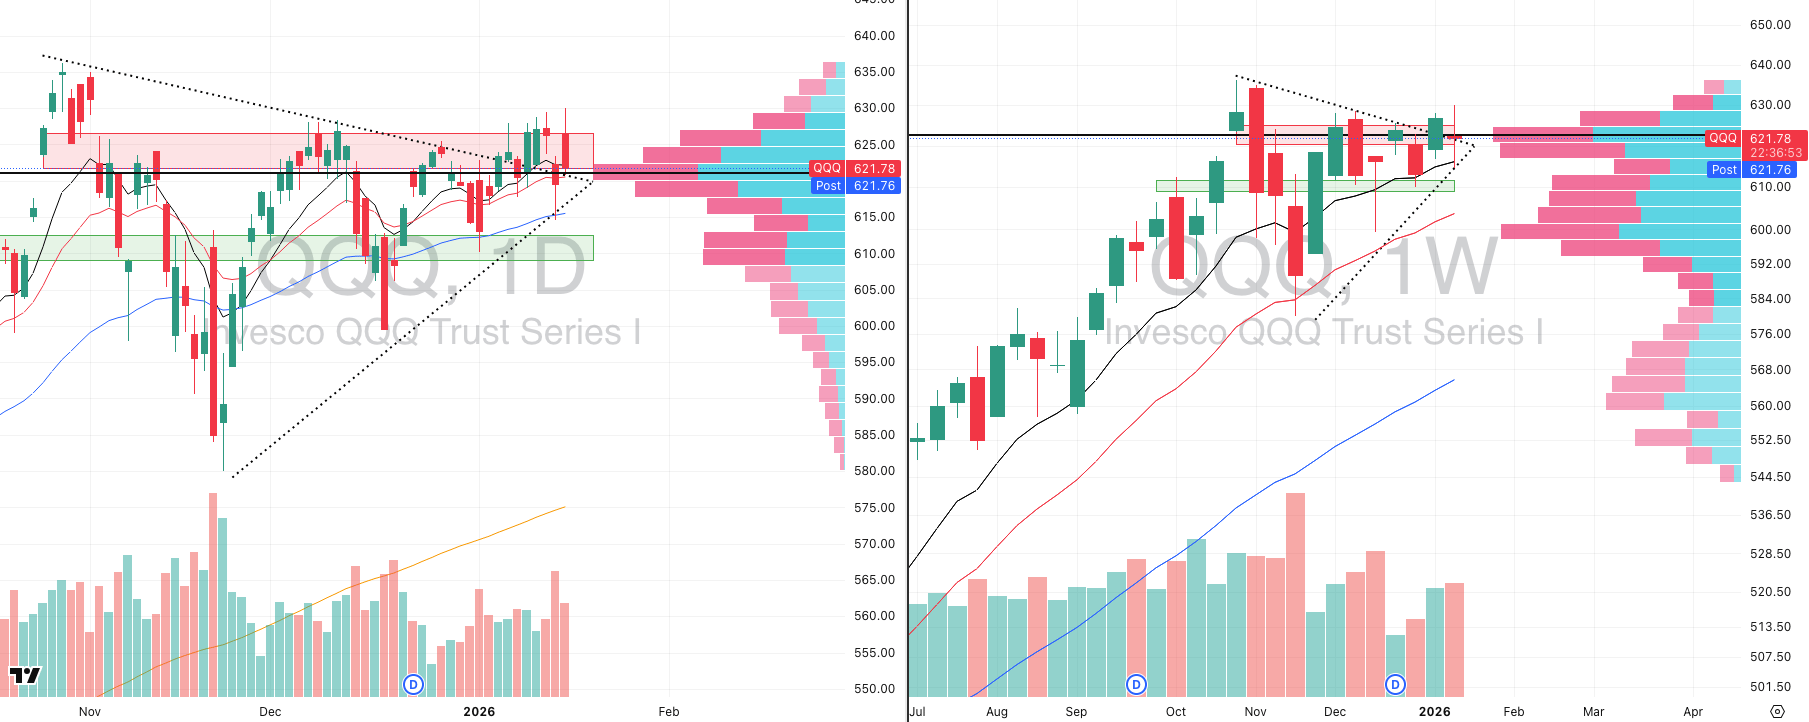
QQQ VRVP Daily & Weekly Chart
53.92%: over 20 EMA | 55.88%: over 50 EMA | 59.80%: over 200 EMA
The QQQ pushed higher off the open and briefly tagged 630, marking a multi-month high not seen since November 3rd.
That level was immediately met with aggressive supply, triggering a sharp reversal on ~100% relative volume.
From high to low, the NASDAQ retraced roughly 1.5%, equating to about 50% of a full average daily range, a meaningful intraday rejection.
Structurally, we continue to see higher highs forming since January 7th, but each attempt has been met with heavy selling pressure between 627–630.
The weekly chart reinforces this point clearly: recent breakout attempts have been rejected outright, with price failing to sustain acceptance above prior supply.
While we did see a constructive bounce earlier this week off the rising 10-week EMA, Thursday’s session once again highlighted a key theme as large and mega-cap technology remains an avoid.
Selling pressure in the big tech complex is persistent, and rallies into highs continue to be sold aggressively.
S&P 400 Midcap

MDY VRVP Daily & Weekly Chart
77.19%: over 20 EMA | 70.54%: over 50 EMA | 70.67%: over 200 EMA
In contrast, mid-caps continue to display material relative strength. Breadth remains significantly stronger than the NASDAQ, with 77% of stocks above the 20-EMA, 71% above the 50-EMA, and 71% above the 200-EMA.
Compare that to the QQQ, where just ~54% of stocks are above the 20-EMA, and the divergence becomes obvious.
Yesterday, MDY gapped higher and pushed up ~1.15%, briefly tagging new all-time highs, with relative volume again coming in near 100% of the 20-day average.
On the weekly chart, this remains a clean continuation of the Stage 2 uptrend that began following the morning star formation in mid-November.
That said, mid-caps are now short-term extended, and while strength remains undeniable, this reinforces that entries must come on pullbacks, not breakouts.
This is still very much a stock-picker’s market, even within the strongest capitalization group.
Russell 2000

IWM VRVP Daily & Weekly Chart
70.85%: over 20 EMA | 70.54%: over 50 EMA | 69.15%: over 200 EMA
Small caps are moving largely in tandem with mid-caps and continue to benefit from the interest rate backdrop. Since bouncing off the 50-day / 10-week EMA and point of control on January 2nd, IWM is now up roughly 8%, marking a very aggressive short-term rally.
Breadth is similarly elevated, with ~71% of stocks above the 20-EMA, 50-EMA, and 200-EMA, which historically increases the probability of near-term consolidation. We are beginning to see signs of short-term exhaustion, particularly into the latter part of the session.
From here, the most likely path is time-based correction or sideways consolidation, rather than immediate continuation. That would be constructive and healthy as ass with mid-caps, chasing strength here is low-probability and pullbacks remain the only sensible area for risk deployment (into rising EMA structure on weekly charts).
FOCUSED STOCK
VIST: Vista Energy Finding Support

VIST VRVP Daily & Weekly Chart
ADR%: 3.60% | Off 52-week high: -20.8% | Above 52-week low: +54.4%
Today’s focus stock is Vista Energy (VIST), an oil and gas producer operating primarily in Argentina and Mexico.
From a structural standpoint, VIST has been building a well-defined contraction since October 27th, spending roughly 77 sessions moving sideways while holding above its rising long-term EMA structure.
Importantly, price has remained supported above the 200-week EMA, which also aligns closely with the 50-week EMA, reinforcing the integrity of the primary trend.
At the $45.80 level, we saw a clear pickup in demand beginning January 8th, accompanied by a noticeable increase in relative volume.
That inflow of demand sparked a ~13% advance over the following five sessions, confirming that buyers are still actively defending this range rather than distributing into strength.
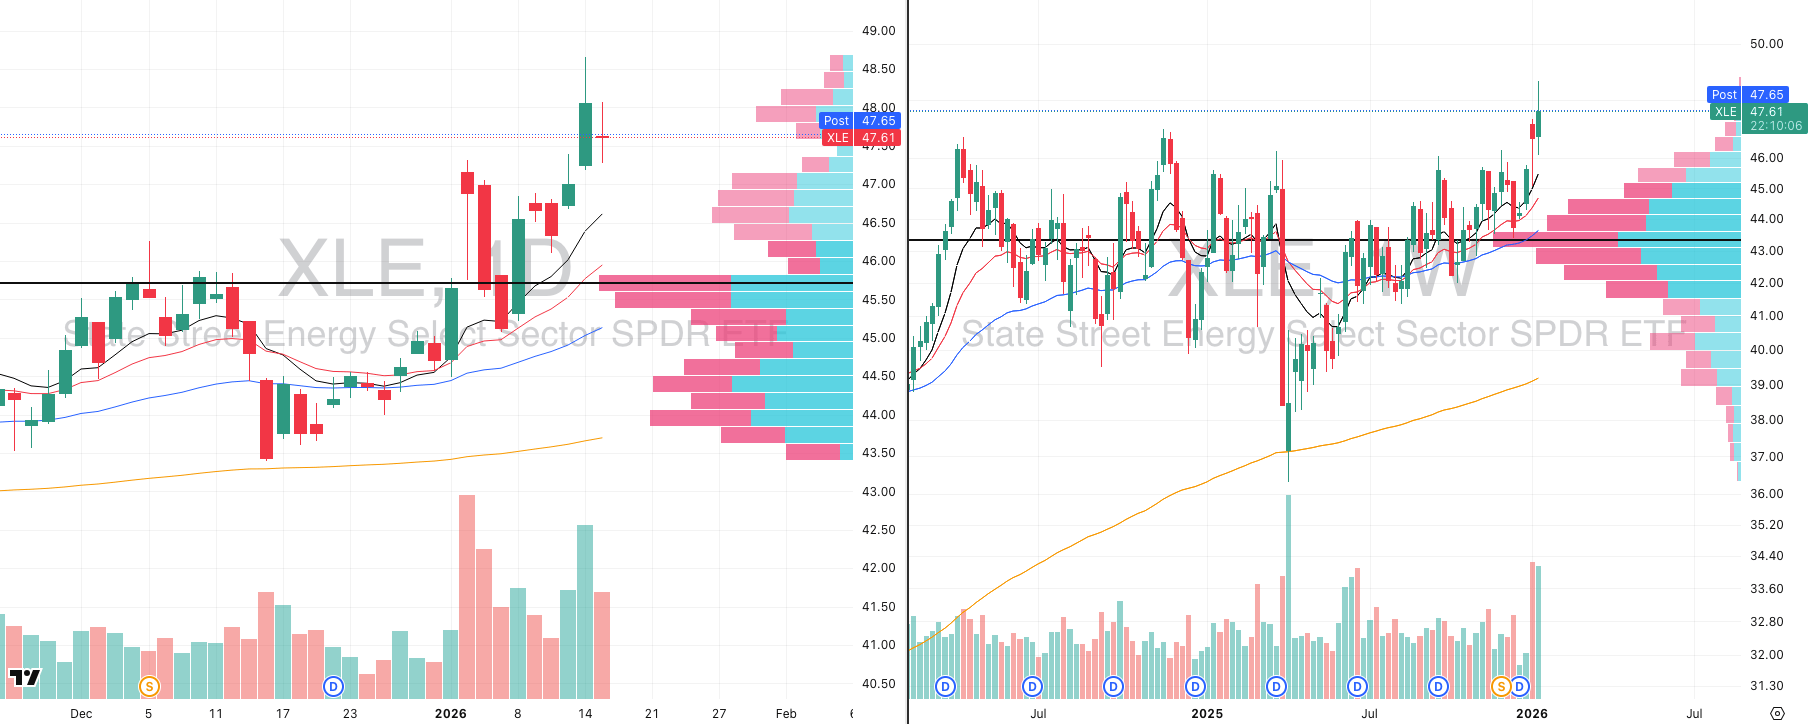
XLE VRVP Daily & Weekly Chart
From a broader context, the energy complex is beginning to reassert itself. XLE saw a sharp upside reaction earlier in the month following geopolitical developments tied to Venezuela, and while it pulled back modestly on Thursday, it remains firmly in an intermediate-term breakout on the weekly chart.
Energy is now trading at its highest levels since November 25th, 2024, clearing over a year of prior price action. That backdrop meaningfully improves the probability of continuation in leading individual names.
VIST stands out within the group as a relative leader, particularly given its clean structure and its insulation from direct U.S. macro policy risk. At present, price is once again finding support along its rising EMA framework, which is exactly what we want to see in a constructive consolidation.
We are not looking for a breakout today. Instead, the ideal scenario is additional tightening, allowing the current pause on the daily chart to resolve into a bull flag.
A controlled expansion from that structure would give us a cleaner entry while aligning with the much larger contraction visible on the weekly timeframe.

Did you find value in today's publication?This helps us better design our content for our readers |
Reply