- Swingly
- Posts
- Where the Next Big Winners Are Hiding
Where the Next Big Winners Are Hiding

OVERVIEW
A Stock Picker’s Market
Macro backdrop stable → PCE in-line keeps September cut odds intact, removing policy risk. Liquidity conditions improving.
Selective strength → Mega-cap tech still sloppy, but mid/small caps, healthcare, and uranium show clean leadership.
Breadth is broadening → Mega-cap tech remains sloppy, but midcaps and small caps are absorbing rotation flow cleanly. Over 80% of IWM and MDY components now sit above their 20-day EMAs vs ~60% for QQQ.
Focused Stock – URGN → Pharma remains a leadership group. URGN is offering a textbook contraction on its 20EMA with volume drying up and a bullish engulfing off demand. Clean watchlist name.
Focused Group – Uranium (URA) → After a parabolic summer move, URA has spent two months digesting. Now pressing into the top of its base with relative volume picking up. Leadership within the group (e.g. CCJ) confirms strength.

MARKET ANALYSIS
PCE Stays Stable: Good News
The July PCE report landed right on consensus: headline +0.2% MoM (+2.6% YoY), core +0.3% MoM (+2.9% YoY.
At first glance, that sounds rather bull but we are actually viewing this in line” as bullish.
Risk scenario removed → Had inflation come in hot, the September rate cut narrative would have been challenged. That could have triggered short term de-risking across equities, particularly in high-beta groups. Instead, policy risk has been neutralized.
Liquidity backdrop improving → Rate-cut expectations alongside steady inflation are real catalysts for small/mid-cap and cyclical outperformance, particularly because these segments carry more leverage to financing conditions.
Historical cycles show small caps often lead after rate cuts. However, the link with the dollar is more mixed sometimes a strong dollar precedes small-cap strength when global flows chase yield, and a soft dollar favors cyclicals more than small domestics
Market structure shift → It’s been difficult to gain traction on broad index longs the past month. The Nasdaq has chopped sideways, mega-cap tech looks sloppy, and only tactical pullback trades have worked.
But now with policy risk removed, breadth can continue to expand without macro headwinds and we believe we are going to continue to see conditions improving.
Expect volatility pockets → Improving macro doesn’t mean straight up. It means the distribution of outcomes skews bullish, but entries still matter. Pullbacks into rising EMAs remain higher probability than chasing extended candles.

Nasdaq
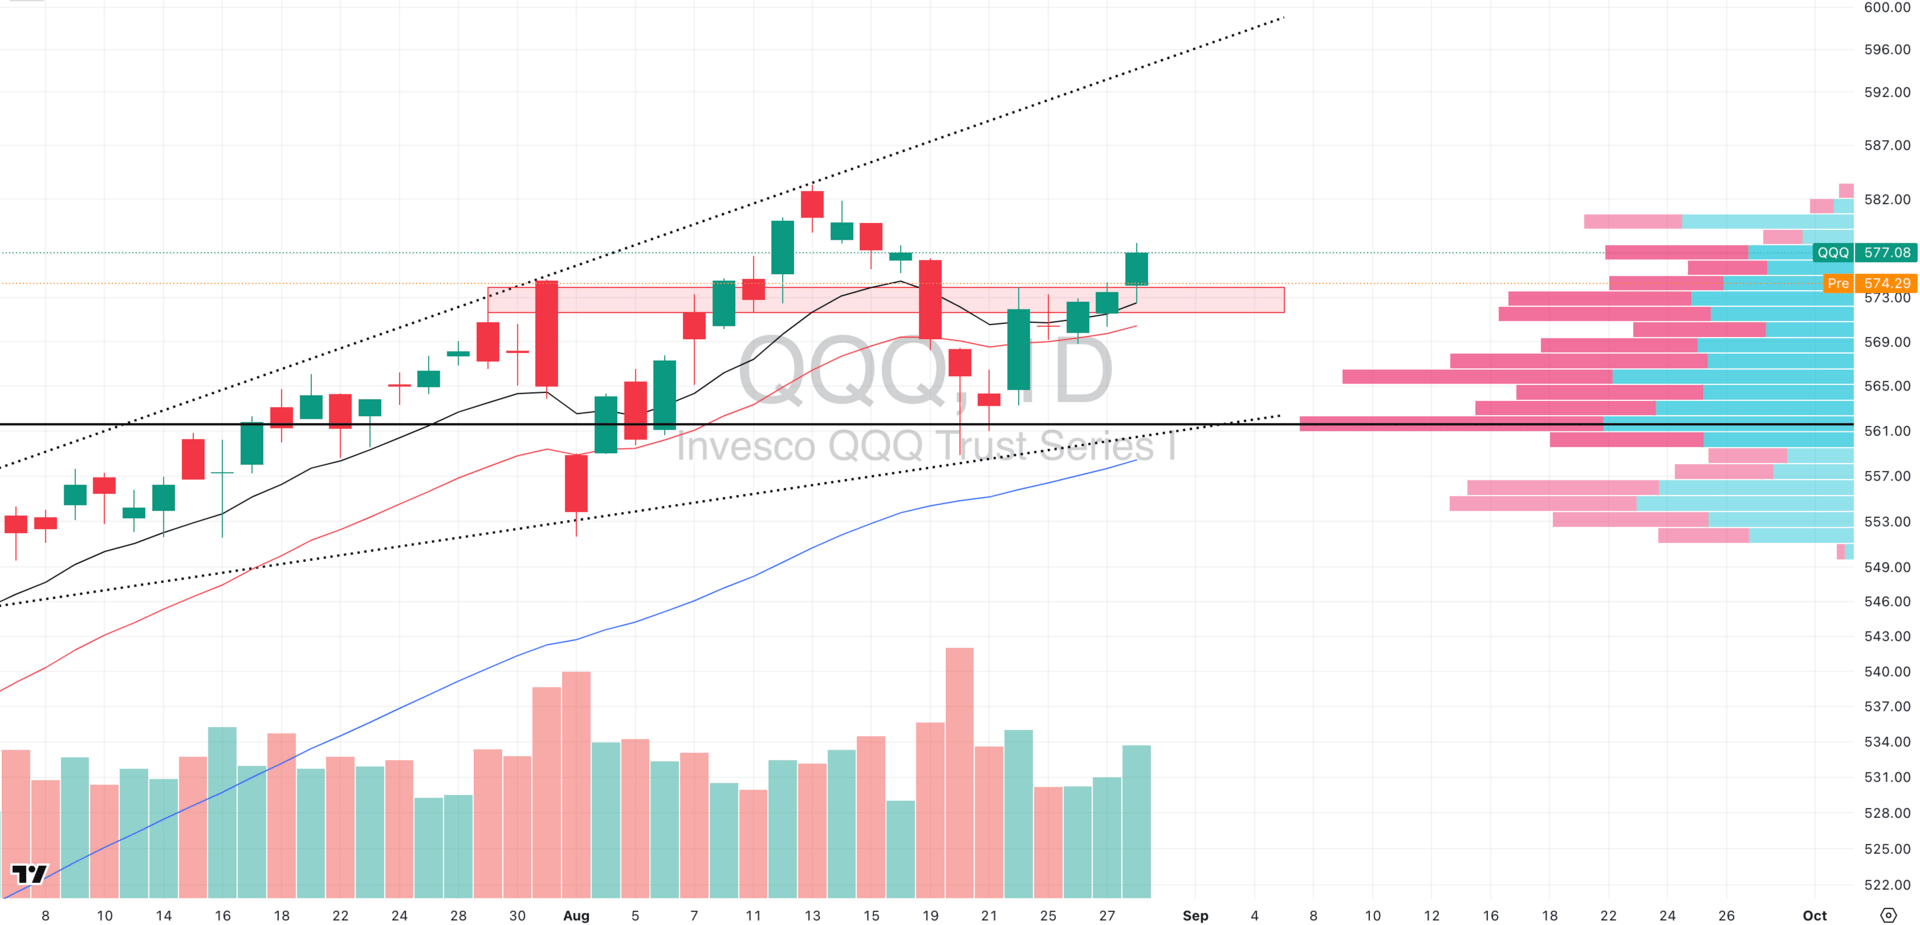
QQQ VRVP Daily Chart
% over 20 EMA: 60.39% | % over 50 EMA: 55.44% | % over 200 EMA: 61.38%
Yesterday we saw a high relative-volume breakout over $574 supply, but in premarket that move has already been retraced back into a retest.
This is the recurring theme with Nasdaq (and broader market) right now: breakouts are not sticking, while pullback entries into rising structure remain the highest-probability plays.
The optimal long strategy was anchored on:
$561 POC (defended August 19), or
the lower bound of the ascending broadening wedge, where risk can be defined tightly.
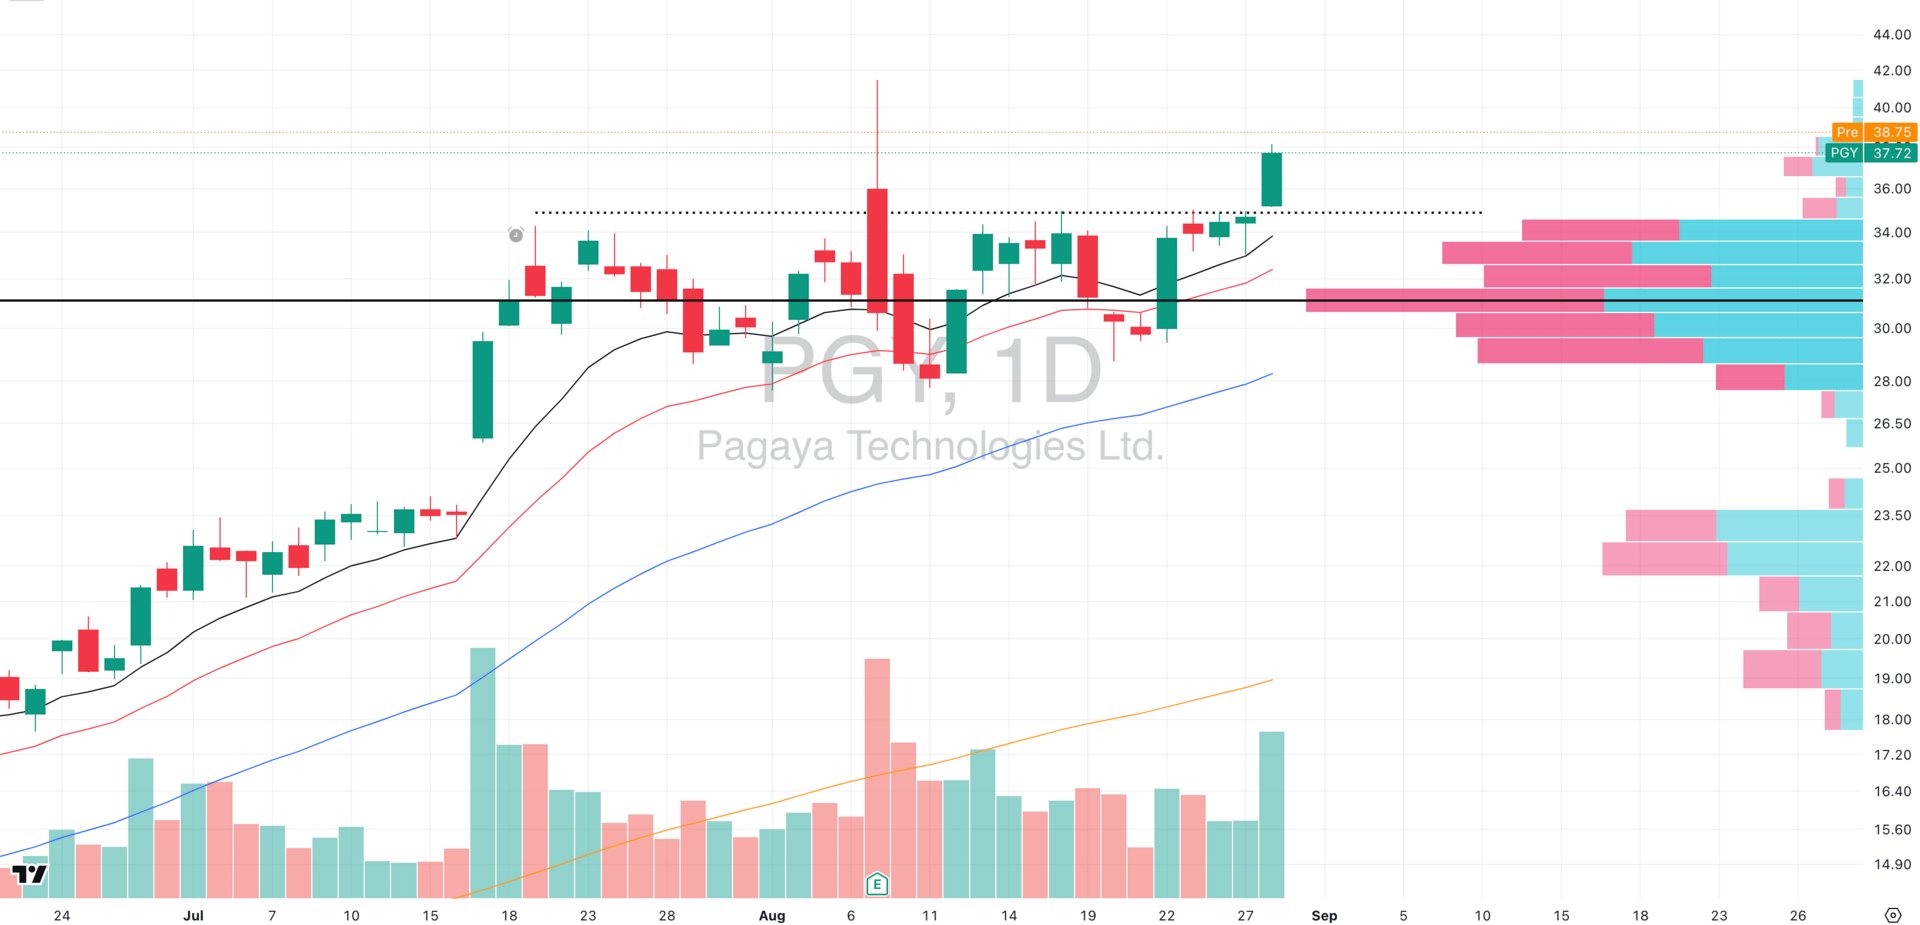
PGY VRVP Daily Chart
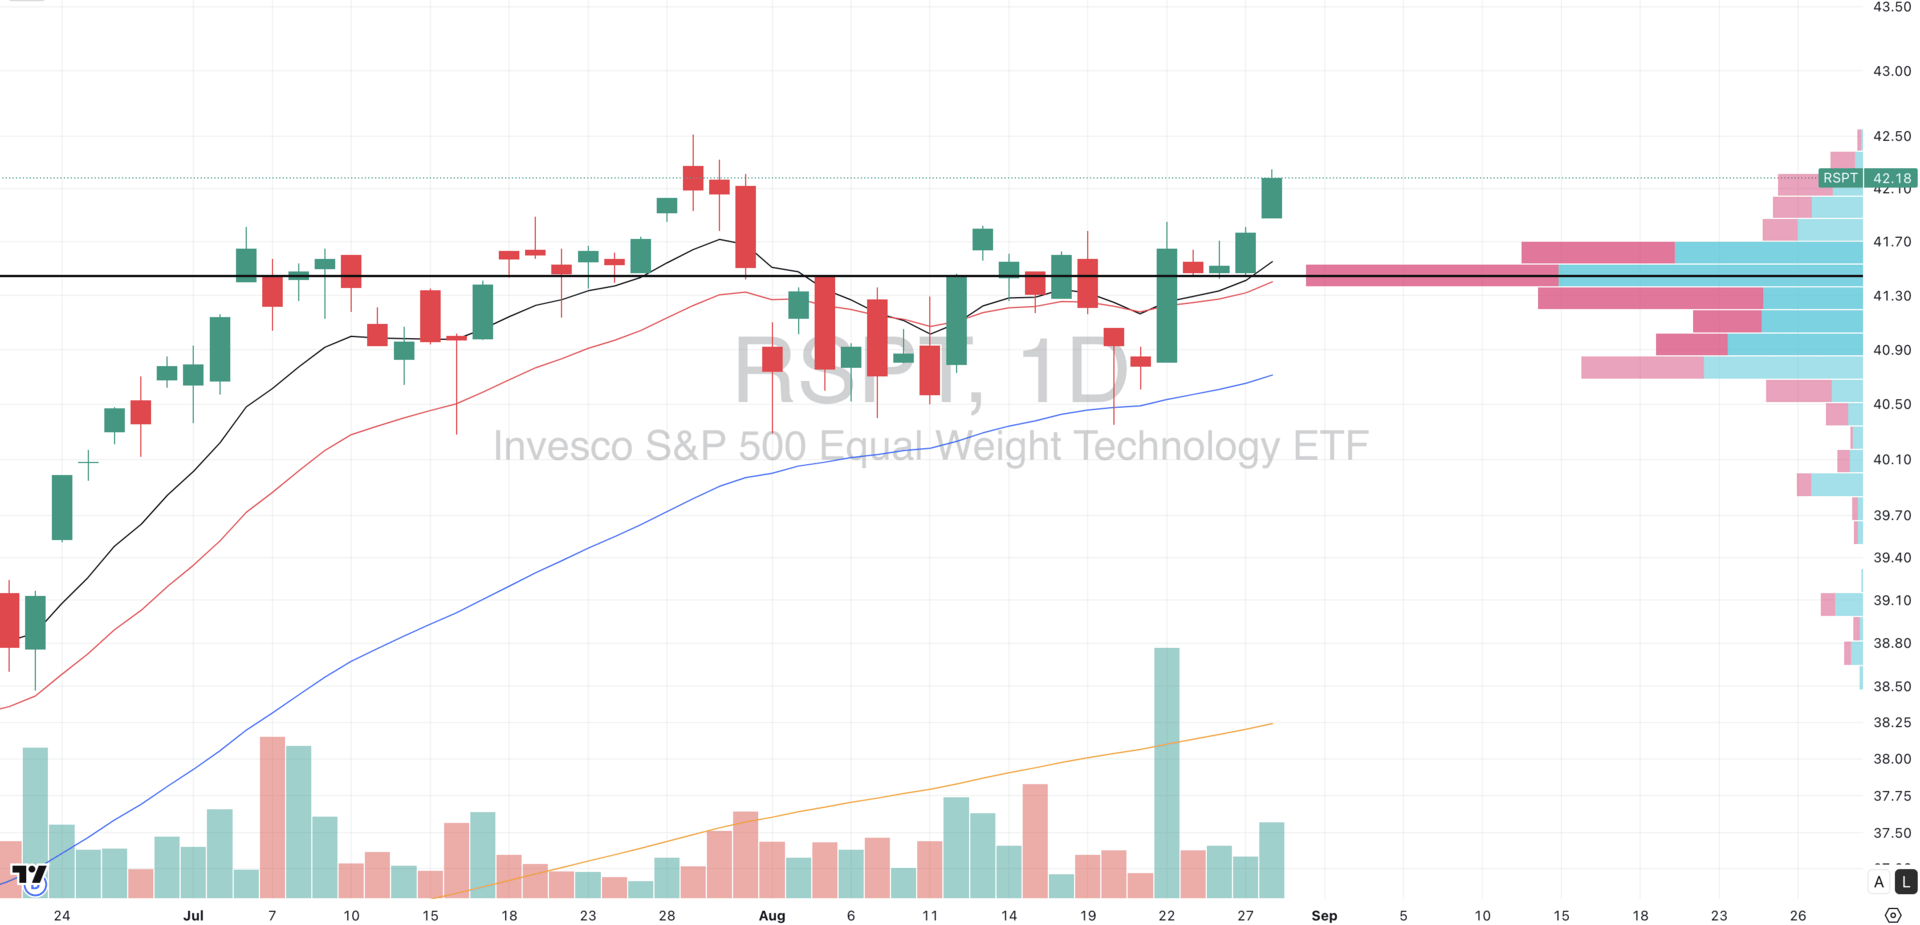
RSPT VRVP Daily Chart
That said, we wouldn’t ignore the complex altogether. Selective longs are working e.g. PGY yesterday being a clear example, and that’s confirmed by RSPT (equal-weight tech), which shows improving breadth within the technology complex.
While the Nasdaq’s mega-cap heavyweights remain sloppy, the equal-weight view tells us that participation across tech is broadening, and that’s constructive.

S&P 400 Midcap
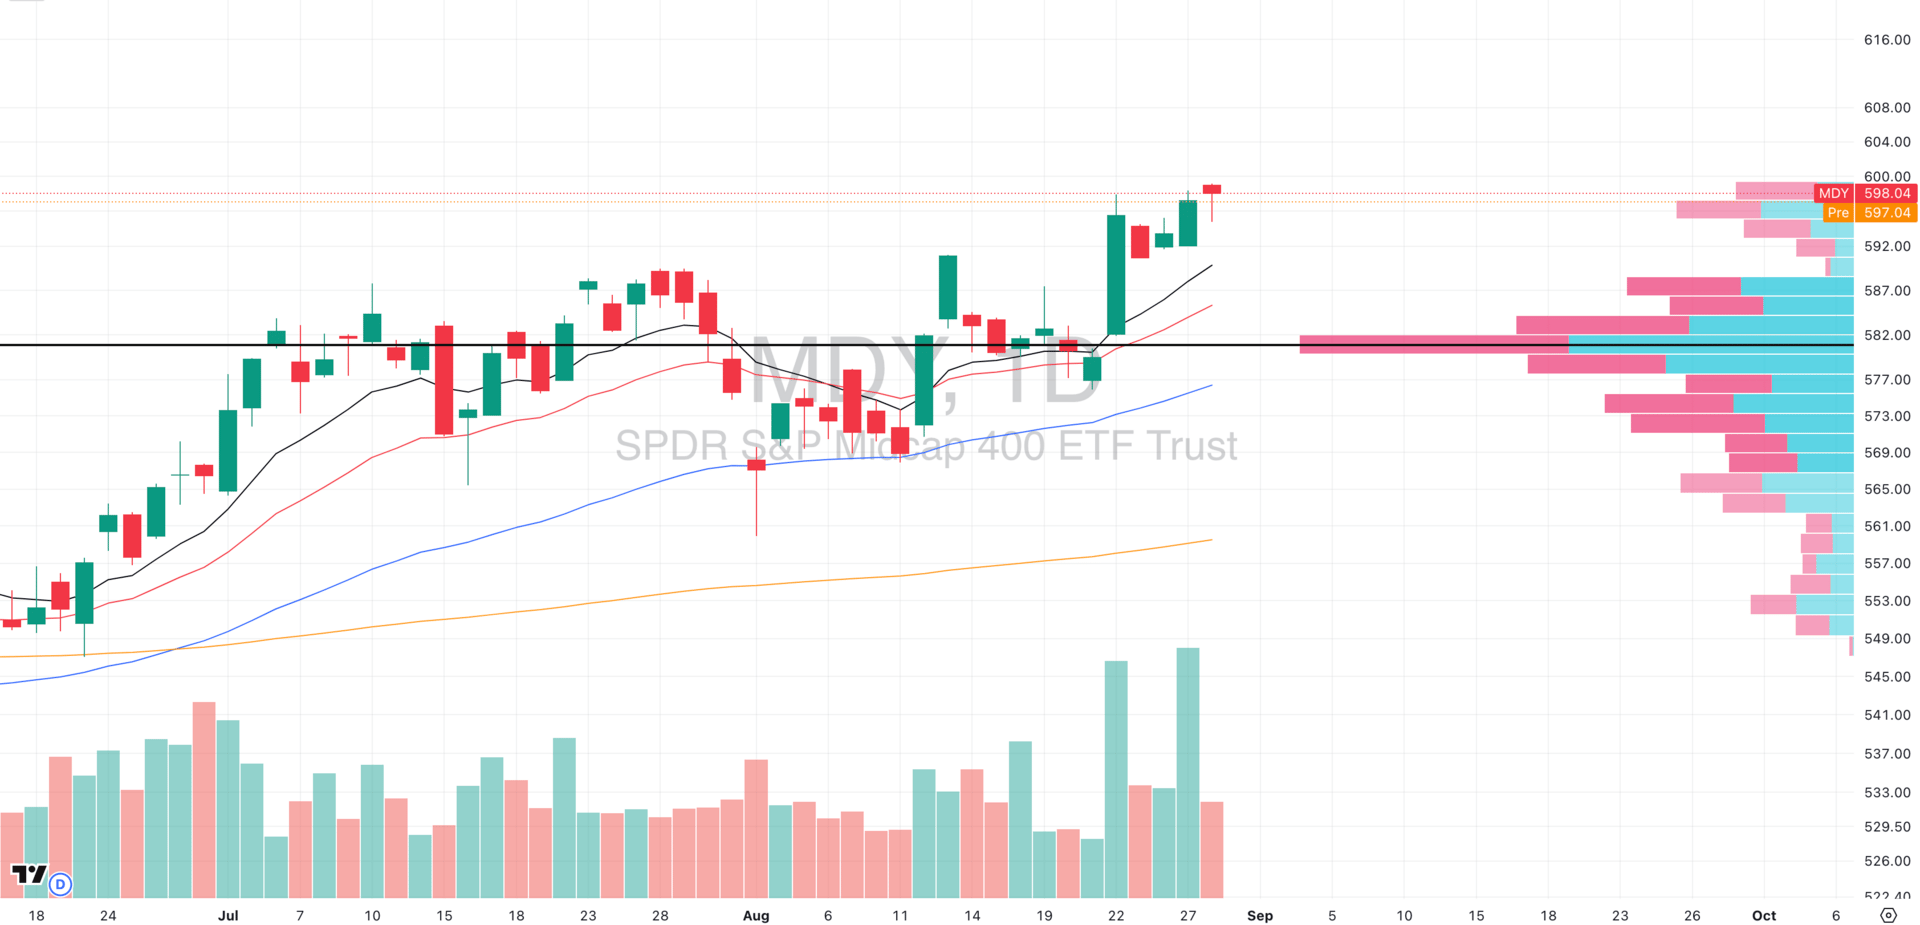
MDY VRVP Daily Chart
% over 20 EMA: 78.75% | % over 50 EMA: 70.50% | % over 200 EMA: 62.25%
Midcaps printed a textbook red hammer candle yesterday on a session that looked weak intraday but revealed strength beneath the surface.
IMDY initially retraced the prior day’s breakout, probing back into supply. On the tape, that’s exactly where you’d expect trapped longs to fold and shorts to press.
Instead, demand quietly stepped in, absorbing offers at lower levels without requiring aggressive volume.
That’s why the session closed well off the lows despite the candle showing red. The low relative volume is key as it signals supply is drying up rather than new sellers leaning in.
Note: A low-volume red hammer at highs is often more bullish than a green close as it means buyers didn’t need to overwhelm sellers to support price, they just had to let supply exhaust itself.
From a structural standpoint, this keeps MDY’s breakout intact. Breadth here is still exceptional (near 80% of stocks above the 20-day EMA), and the underlying rotation into midcaps continues to stand out relative to Nasdaq’s chop.

Russell 2000
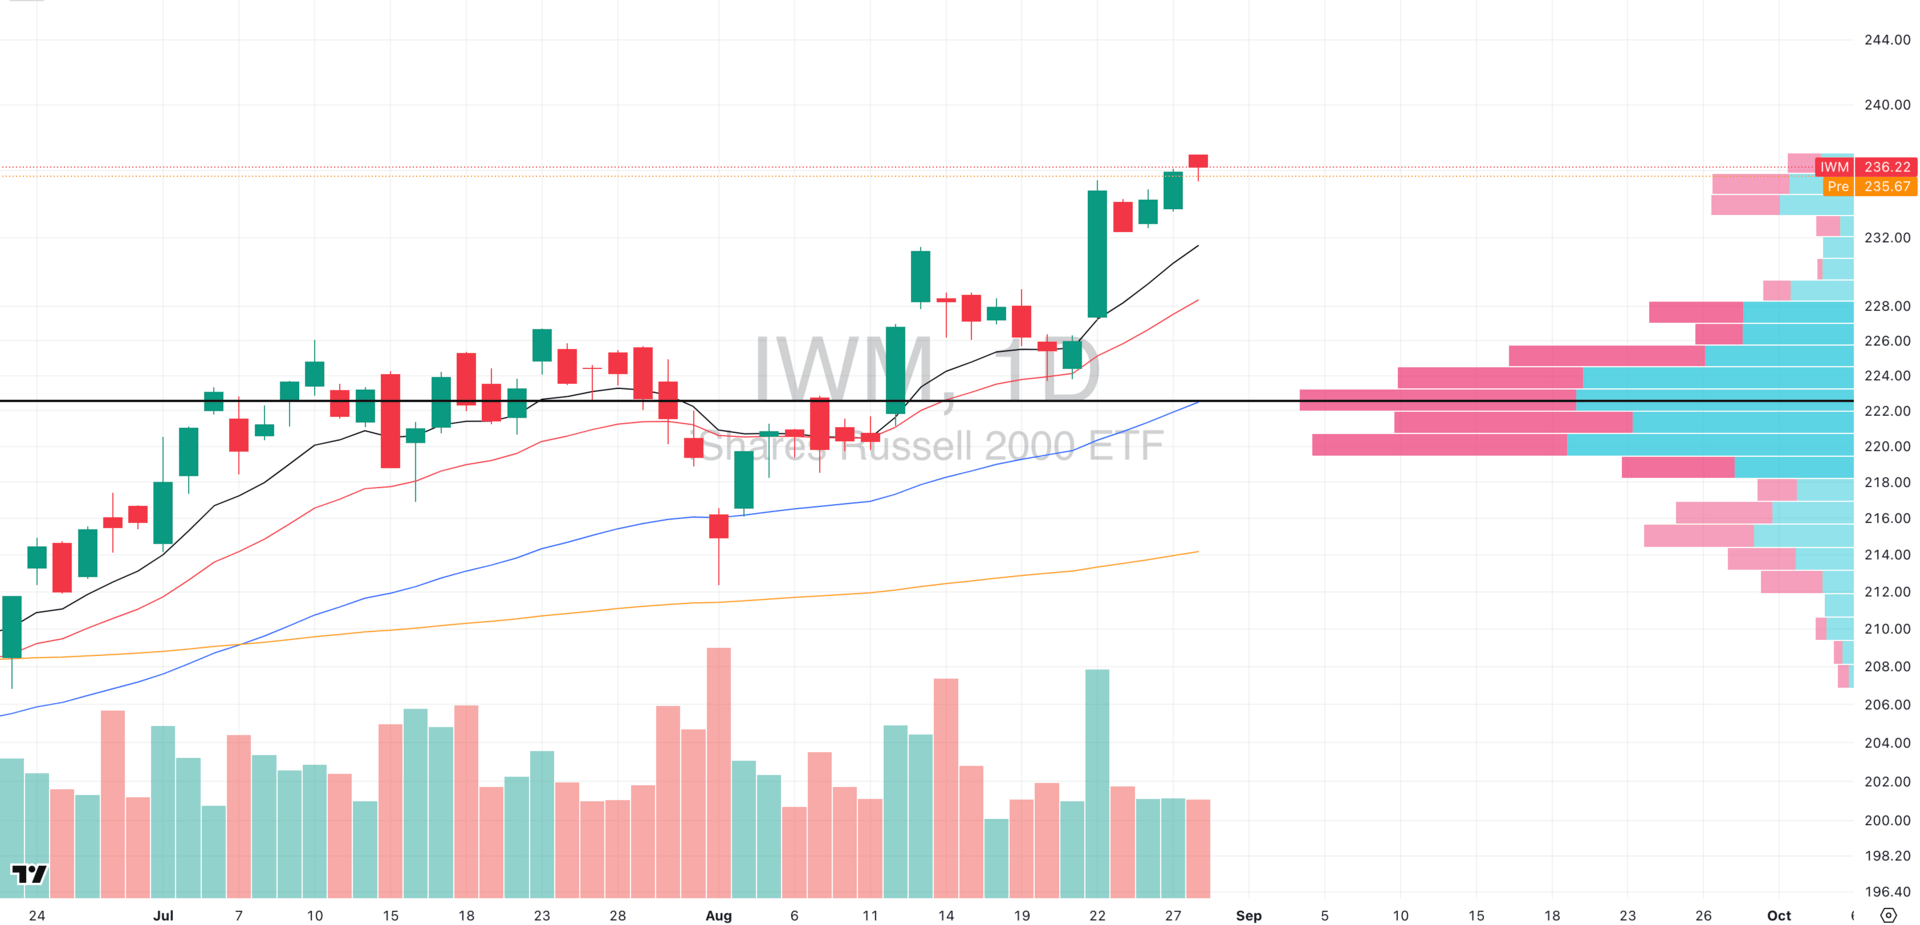
IWM VRVP Daily Chart
% over 20 EMA: 80.33% | % over 50 EMA: 72.23% | % over 200 EMA: 61.18%
The Russell 2000 continues to stand out as the strongest of the major index segments. Structurally, it’s showing the same breakout behavior as midcaps, but with shallower retracements and stronger follow-through — a clear sign of leadership.
Breadth here remains the best, with over 80% of components above their 20-day EMA, far outpacing the Nasdaq and the MDY.
From a risk perspective, IWM is currently sitting around 4.3x ATR from its 50-day EMA, which is not statistically extended by our standards. This means there’s still room for continuation before extension risk becomes a real headwind.
That said, we should not expect a straight-line rally. Indices rarely move in one direction without digestion. But when we run our scans, the majority of the cleanest momentum setups are consistently coming from small caps (and even further down the risk curve).
Key takeaway: IWM remains the “king” capitalization-based index right now. It has the best breadth, the healthiest structure, and continues to be where the highest-probability momentum plays are emerging. Keep focusing on this group.

13 Investment Errors You Should Avoid
Successful investing is often less about making the right moves and more about avoiding the wrong ones. With our guide, 13 Retirement Investment Blunders to Avoid, you can learn ways to steer clear of common errors to help get the most from your $1M+ portfolio—and enjoy the retirement you deserve.

FOCUSED STOCK
URGN: Tight Contraction at the 20EMA
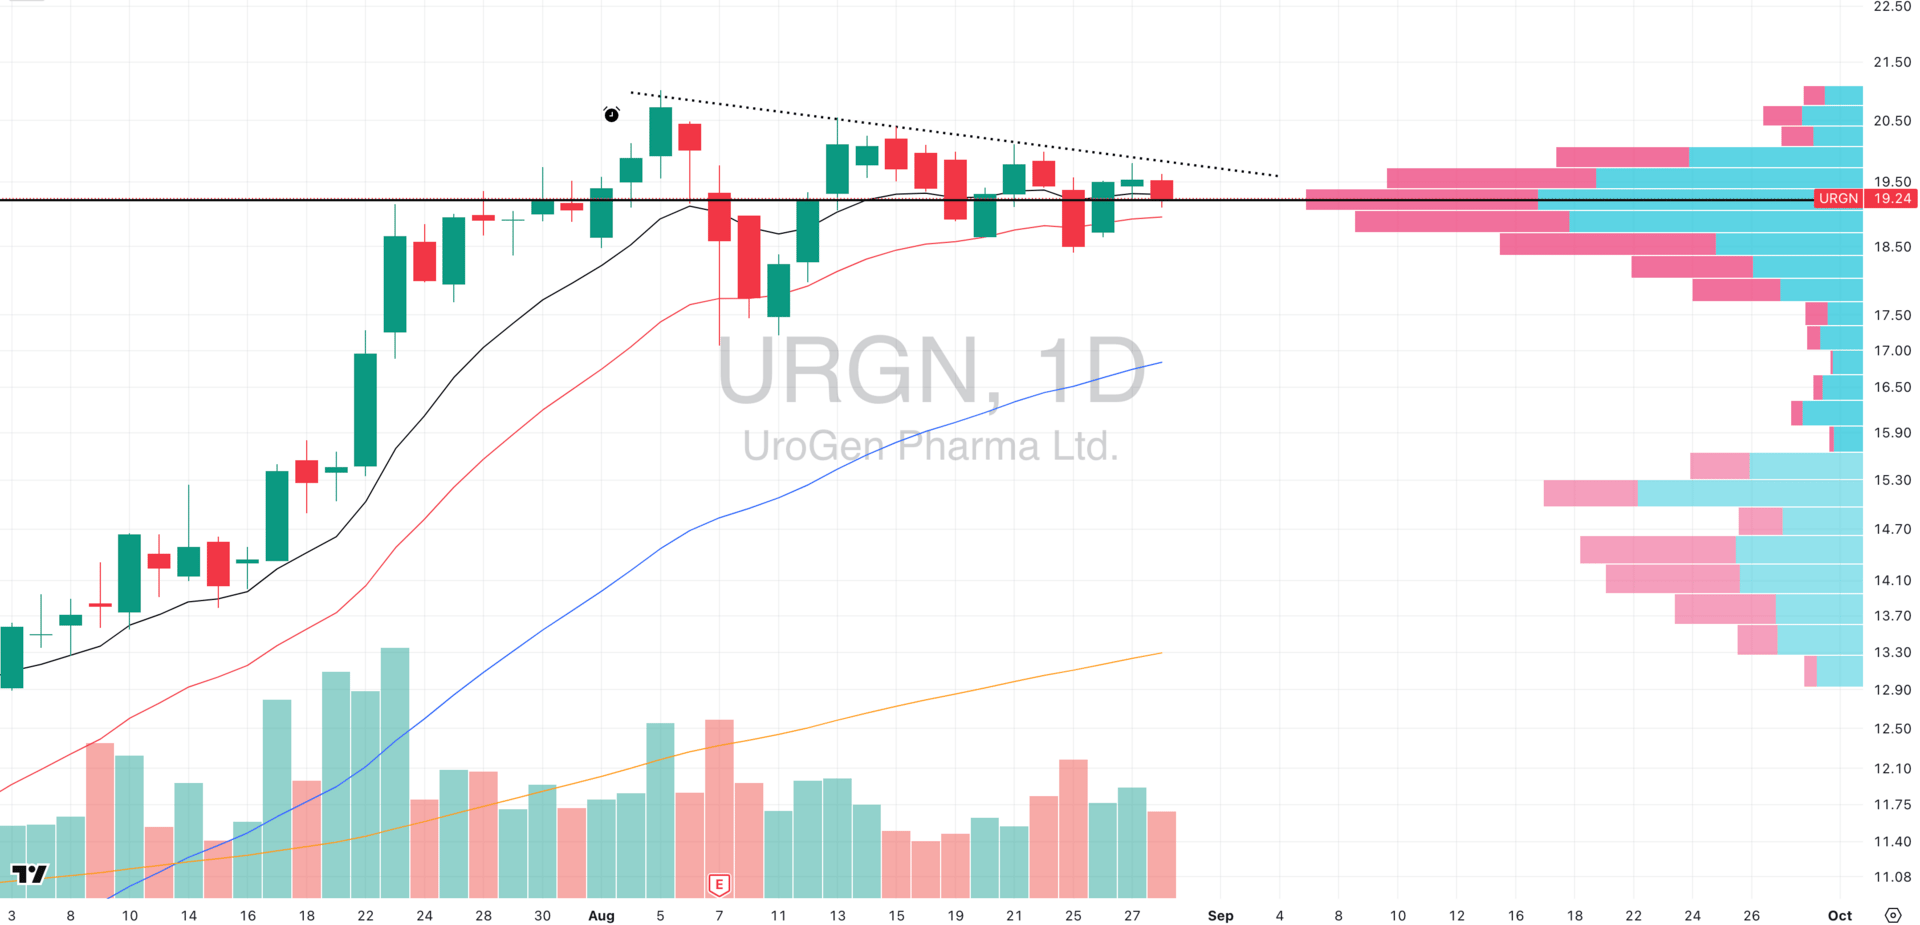
URGN VRVP Daily Chart
ADR%: 5.97% | Off 52-week high: -8.4% | Above 52-week low: +462.6%
Healthcare and especially pharma has been one of the market’s strongest leadership groups, with names like MDGL rallying +47% in the last month. Within that context, URGN is offering one of the cleanest technical setups right now.
Tight contraction: Price has been pulling back for a month, respecting the rising 20-day EMA. Volume has steadily dried up — a classic sign of supply being absorbed.
Demand confirmation: Three sessions ago, URGN printed a bullish engulfing candle off its third retest of the 20EMA, showing buyers are stepping in consistently.
Group context: While XLV and XPH have cooled off after their explosive runs, URGN consolidating this cleanly keeps it firmly on our watchlist.
As always with pharma/healthcare names, keep an eye on any upcoming data releases.

FOCUSED GROUP
URA: Uranium Leadership Emerging Again
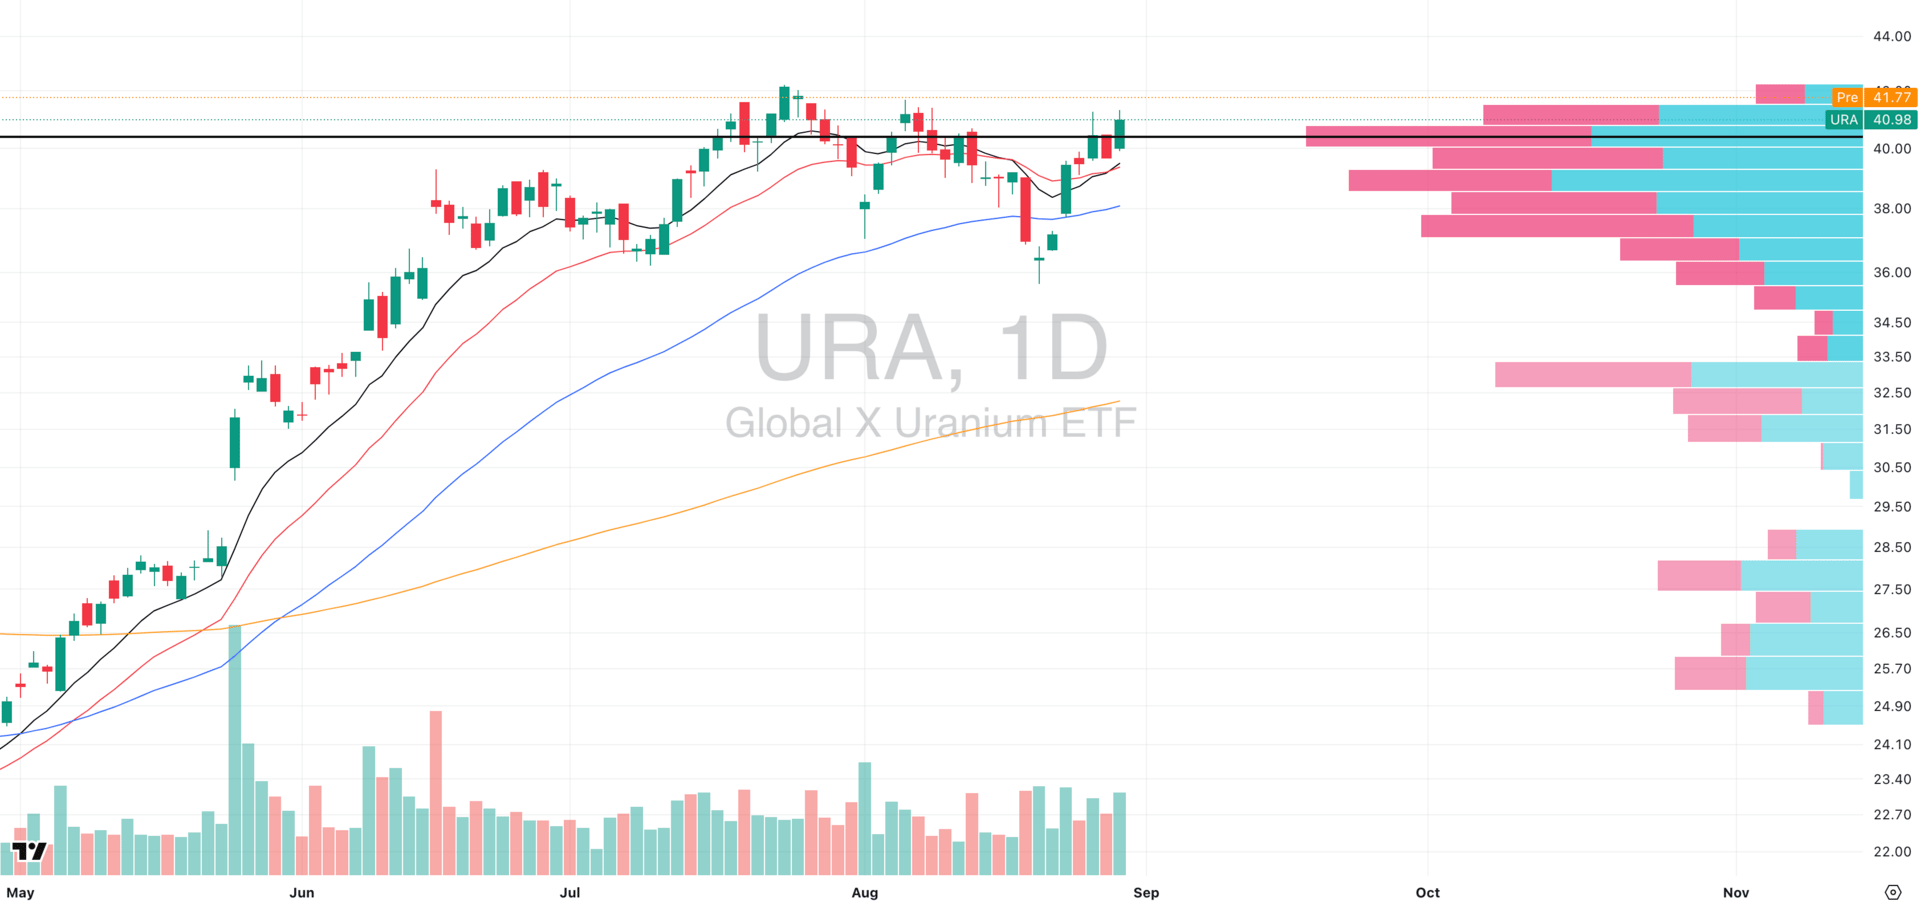
URA VRVP Daily Chart
Uranium was one of the standout themes of the summer, ignited by the Trump administration’s late-May policy push to make America the leader in nuclear energy.
That announcement triggered historic inflows into the space, sending the Global X Uranium ETF (URA) and its components into powerful trend runs on massive relative volume.
Since then, the group has done exactly what strong sectors should: digest gains in a controlled consolidation.
For the past two months URA has moved sideways, volume has tapered, and moving averages have caught up showing a textbook reset after a parabolic leg.
What’s changing now
In the last week, URA has climbed back to the top of our relative strength scans. Price is pressing into the upper end of its base while relative volume quietly picks up.
This is the type of character shift we track closely: early accumulation reappearing after supply has been worked off.

Q&A
Got a trading question? Hit reply and ask!
Q: “When you say you track sector rotation, does that mean you’re constantly rotating capital into the top sectors every week or month?”
This is a really common misconception. No, we don’t just rotate money mechanically into whatever group is strongest that week.
We’re not a hedge fund that has to stay 100% allocated. One of the most underutilized edges retail traders have is the ability to sit in cash until the exact conditions line up.
That approach how is how retail traders get chopped up. Sector rotation is best used as a roadmap, not a trigger alone.
Leaders show the truth first. Market tops and bottoms rarely appear in the index first. They show up in leading sectors. In 2020, semis and software started breaking out weeks before the S&P recovered.
In 2023, AI names (NVDA, MSFT, AVGO) ripped higher long before SPX confirmed the new bull leg. By tracking the leading groups every day, you see where money is flowing before it’s obvious.
Setups > Sectors. Just because a sector is strong doesn’t mean we’re in it. If none of the leaders in that group are offering clean volatility contraction patterns, high-volume breakouts, or EMA-pullback entries, we wait. The best trade is often no trade until structure aligns.
Rotation creates edge. Think of it like a poker table: the chips are always moving, but not evenly. When institutions rotate out of crowded mega-cap tech into small caps, or into energy, or into retail, it leaves footprints. If you’re watching those rotations, you know where the next asymmetric setups will appear.
Cash is a position. This is where many traders trip up. They think “rotation” means they always need to be moving money. In reality, our win rate runs sub-40% because we take only the tightest setups. If the leaders don’t align, we hold cash. That optionality is one of retail’s biggest advantages over funds.
Case study:
In early 2020 after COVID, small caps (IWM) massively lagged while tech led. By November 2020, as vaccine optimism and Fed liquidity came through, there was a violent rotation into small caps and cyclicals. Traders who were tracking rotation saw breadth explode in IWM and Industrials, giving them a roadmap to pile into the new leaders early.
That’s the point: sector rotation isn’t about chasing every move. It’s about building a map of where the highest-probability asymmetric trades will emerge, then waiting until the tape confirms.
Did you find value in today's publication?This helps us better design our content for our readers |

Reply