- Swingly
- Posts
- Where Strength Is Concentrating Right Now
Where Strength Is Concentrating Right Now
In partnership with

MARKET ANALYSIS
Here’s What You Need To Know
U.S. equity futures are essentially flat this morning as markets reopen for a single, thinly traded session following Christmas.
With liquidity still light and positioning already stretched, price action today is far more about year-end flow and positioning than fresh information.
The broader backdrop remains constructive. Both the S&P 500 and Dow closed at record highs in the shortened Christmas Eve session, extending the market’s winning streak and firmly placing us inside the seasonal Santa Claus rally window.
Importantly, this strength is holding despite fading expectations for near-term Fed cuts. Markets have largely accepted a pause in January, yet equities continue to grind higher which is a great sign that price is being driven more by earnings durability, liquidity conditions, and positioning than by rate speculation alone.
Precious metals continue to be the standout intermarket signal. Gold and silver are once again printing fresh all-time highs, supported by a weaker dollar, ongoing geopolitical tensions, and continued central-bank demand.
Energy is also quietly firming, with oil on track for its strongest weekly gain in months amid supply disruptions and geopolitical pressure points. While not yet a dominant equity theme, it adds to the picture of real asset strength underneath the surface.
From a purely momentum trading standpoint, the absence of major economic data or earnings into year-end removes headline risk. That shifts the focus squarely back to price, volume, and sector leadership, where we continue to see participation broaden rather than narrow- things look strong!
Nasdaq

QQQ VRVP Daily & Weekly Chart
60.39%: over 20 EMA | 56.43%: over 50 EMA | 61.38%: over 200 EMA
The Nasdaq continues to coil on the weekly timeframe, with price contracting and moving sideways for roughly the past month. This is a typical intermediary digestion following a strong advance rather than any form of structural weakness.
This week’s push lower was constructive. Price filled the prior Monday gap and tagged the rising 10-day moving average near 617.8, where demand stepped in decisively.
That response reinforced the idea that this gap was not an exhaustion move and that sellers remain unable to force sustained downside.
The most important detail is positioning relative to volume. Price is holding above the point of control, and from roughly 624 up to all-time highs near 636, the visible range volume profile shows very little supply, creating a low-resistance pocket if price can resolve higher.
Near-term resistance sits around 624.7–628.5, where some overhead supply still exists. Volume here has been skewed toward buyers (approximately 15M green vs. 7.6M red shares), which confirms demand — but also implies some trapped long exposure from the early December rounded top.
For traders, the key takeaway is timing. The optimal aggressive entry was the December 19 breakout near 613. From here, opportunities still exist within Nasdaq leadership, but awareness of near-term overhead supply is critical.

QQQE VRVP Daily & Weekly Chart
The QQQE has also pushed into overhead supply but tells a slightly different story beneath the surface. Last week’s sharp selloff into 101.36 was met with strong demand, followed by a clean rebound and two consecutive weeks of long downside tails, signaling absorption rather than distribution.
This week has introduced some short-term downside pressure, but volume dynamics remain informative. Above 103.9, buying volume meaningfully outweighs selling volume, suggesting buyers are still willing to defend pullbacks.
While QQQE itself is less liquid and not widely traded, its behavior relative to QQQ is important. Both are moving in the same direction, but QQQ is clearly leading, reinforcing that mega-cap tech remains the dominant source of strength within the Nasdaq complex.
S&P 400 Midcap

MDY VRVP Daily & Weekly Chart
63.50%: over 20 EMA | 66.50%: over 50 EMA | 60.75%: over 200 EMA
MDY is exhibiting a tight three-day contraction near highs, with ATR compressing and candle bodies narrowing which is exactly the kind of structure you want to see in a healthy continuation.
There is known overhead supply above 618–620, with a notable amount of trapped long exposure still present. That means price may need time to work through this zone rather than move straight through it.
Structurally, there is very little to criticize. Mid-caps are holding all key moving averages, including the 10-day, and downside support extends comfortably toward 610 without damaging the trend.
Most importantly, the prior supply zone around 608, which capped price repeatedly since early September, has now been successfully flipped into demand. That character change significantly improves the medium-term outlook.
Russell 2000

IWM VRVP Daily & Weekly Chart
55.56%: over 20 EMA | 63.85%: over 50 EMA | 63.48%: over 200 EMA
Small caps are showing a similar pattern to mid-caps, with a pullback earlier in the week that successfully tested the 10-day moving average before stabilizing.
Price remains just below a defined supply zone, which is why we continue to respect that level. However, volume concentration around current prices suggests strong acceptance, not rejection.
The broader structure points to a contraction at highs, and if price does not resolve immediately, odds favor continuation over failure in the coming sessions.
The most important observation is market alignment. Nasdaq, mid-caps, and small caps are all trending in the same direction. Nasdaq leadership is accelerating, while mid and small caps are digesting, a healthy, rotational dynamic rather than a warning signal.
Strength remains most pronounced in mega-cap tech, while mid and small caps continue to build constructive bases. That alignment keeps the broader tape firmly constructive and supports continued selective risk-taking.
Smart Investors Don’t Guess. They Read The Daily Upside.

Markets are moving faster than ever — but so is the noise. Between clickbait headlines, empty hot takes, and AI-fueled hype cycles, it’s harder than ever to separate what matters from what doesn’t.
That’s where The Daily Upside comes in. Written by former bankers and veteran journalists, it brings sharp, actionable insights on markets, business, and the economy — the stories that actually move money and shape decisions.
That’s why over 1 million readers, including CFOs, portfolio managers, and executives from Wall Street to Main Street, rely on The Daily Upside to cut through the noise.
No fluff. No filler. Just clarity that helps you stay ahead.
FOCUSED STOCK
AMD: The Beginnings Of A Breakout
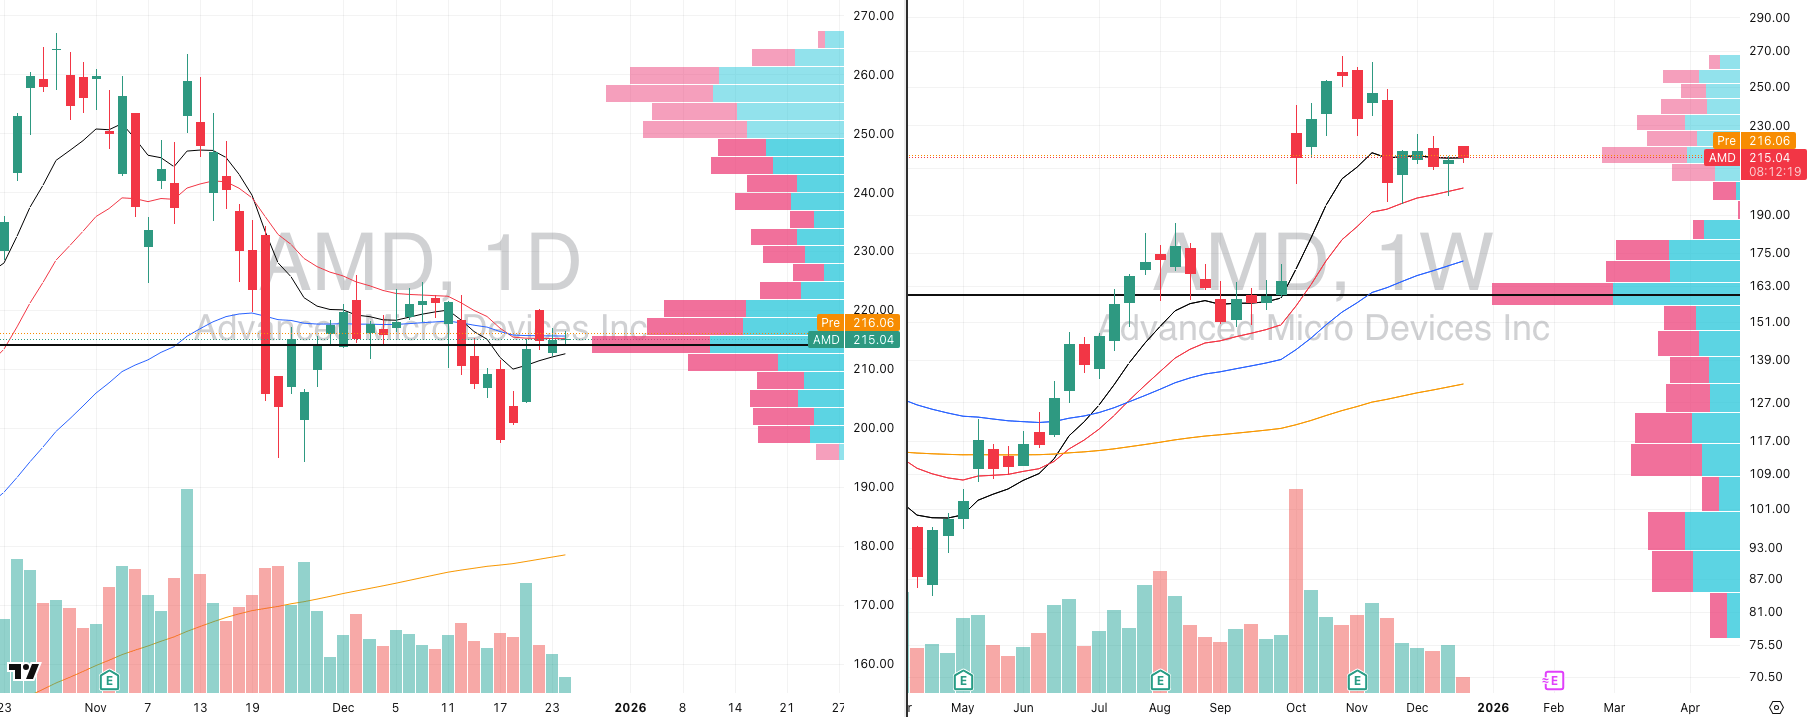
AMD VRVP Daily & Weekly Chart
ADR%: 3.59% | Off 52-week high: -19.5% | Above 52-week low: +181.2%
AMD is setting up exactly how you want a leader to behave in a constructive market. We now have a three-day contraction developing directly on the rising 10-day moving average at ~$212.20.
More importantly, price is sitting inside a major confluence zone around ~$216.60, where the 20-day, 50-day, point of control, and the 10-week moving average all overlap. That alignment between daily and weekly structure is critical — it tells you both short-term momentum and the intermediary trend are in agreement.
On the weekly chart, AMD has effectively built a triple bottom at the 20-week moving average, with sharp downside probes on Nov 17, Nov 21, and Nov 25 all being aggressively bought. Those long downside tails reflect strong institutional demand, not distribution.
This contraction is happening while semiconductors are re-accelerating, with leadership already breaking out in names like NVDA and MU.
From a relative strength perspective, AMD currently holds a 99 RS rating versus the S&P 500, which places it firmly in market-leader territory.
This is exactly the type of stock you want on the front page of your watchlist. Whether the resolution comes today or over the next few sessions, AMD is very clearly setting up for a directional move, not breaking down.
FOCUSED GROUP
GXC: China Stocks Getting Very Tight
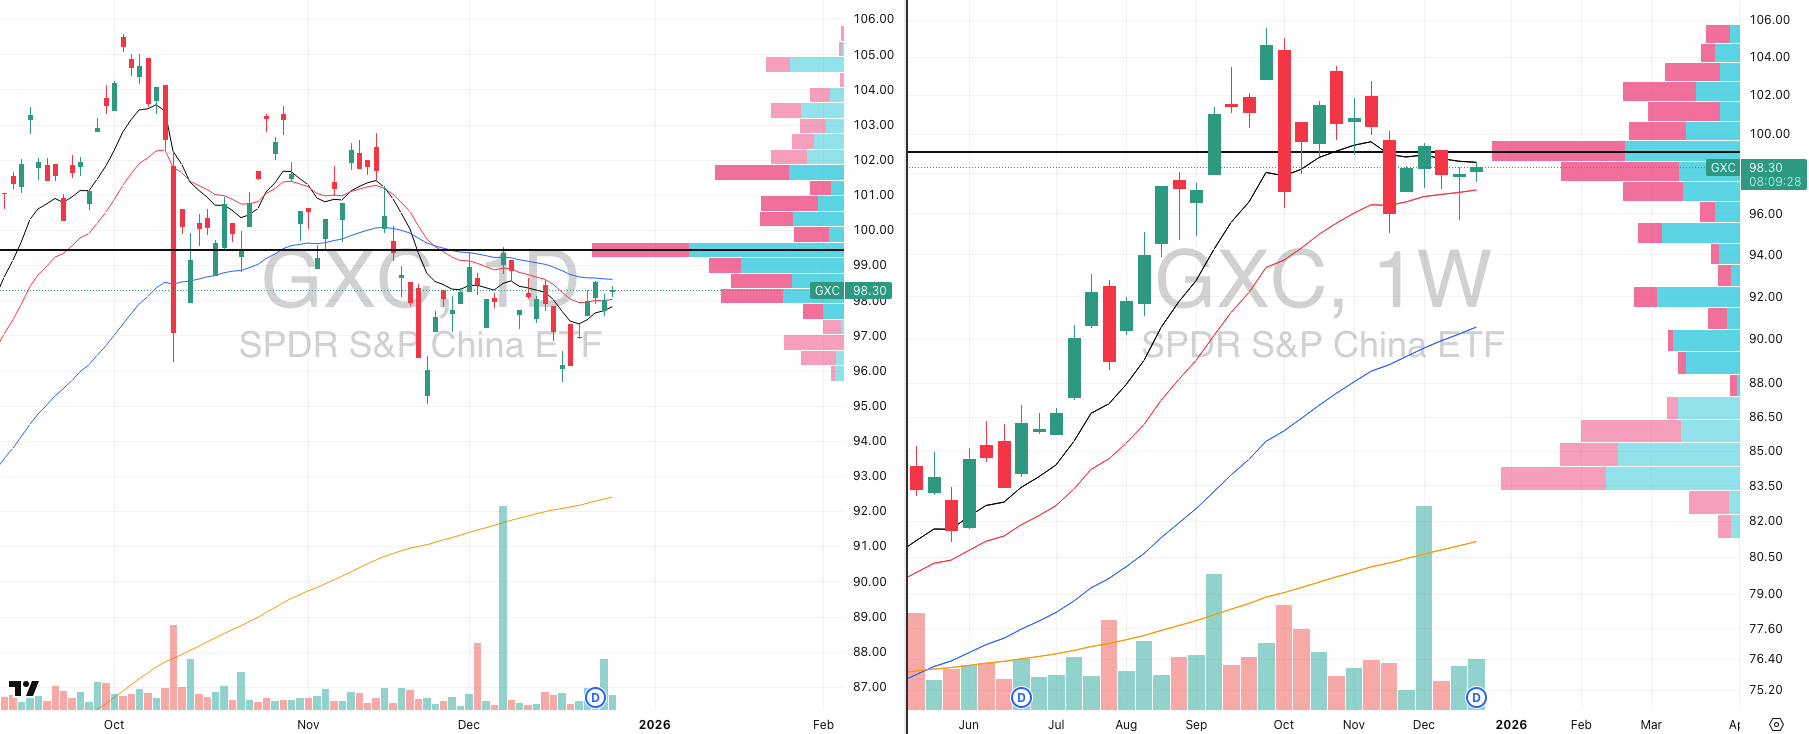
GXC VRVP Daily & Weekly Chart
China is quietly showing the same contraction behavior we’re seeing in several US leaders. GXC continues to hold its rising 20-week moving average and remains locked in a longer-term contraction that has been developing since late September.
This is an intermediary-trend structure and price has tightened materially, volatility has compressed, and downside probes have consistently been absorbed.
What’s notable is the timing. GXC is beginning to re-accelerate alongside US equities, not diverge from them. While US tech remains the dominant leader, China appears positioned to move in parallel, not in opposition.
This makes the Chinese complex worth tracking closely, particularly former leaders that tend to respond first when momentum returns.
Stocks to keep on radar:
FUTU
XPEV
Select China ADR leaders that are also forming tight, low-volatility bases

Did you find value in today's publication?This helps us better design our content for our readers |
Reply