- Swingly
- Posts
- Where Real Strength Is Still Showing
Where Real Strength Is Still Showing
In partnership with

MARKET ANALYSIS
Here’s All You Need To Know
U.S. equity futures are opening higher to start 2026, with the Nasdaq leading the gap up. That said, this bounce should not be misread as a fresh wave of demand. The market is rebounding from very obvious and well-defined support levels that were tested into year-end, so a reaction higher was largely expected rather than earned.
Importantly, this gap higher is not being driven by marginal buying pressure at highs. Over the last several weeks, we have consistently seen rallies fail to attract incremental demand once price moves away from support. That remains the key issue in this tape.
The broader market just came off a strong two-week advance into late December, following a clean test of rising weekly moving averages. Given that context, the recent pullback and bounce fit the profile of expected price action inside an otherwise consolidative and still dangerous trading environment.
Price action remains erratic and uneven across indices and sectors. Breakouts have struggled to follow through, while pullbacks into support have continued to attract buyers. That combination strongly favors range-bound conditions rather than trend conditions.
The AI complex continues to lead on a relative basis, particularly in select mega-cap names (e.g. NVDA and GOOG), but even there, leadership is narrow and selective. Many recent AI breakouts have stalled or retraced, reinforcing the need for discipline and precise execution.
qFrom a positioning perspective, this market is telling traders to reduce timeframe expectations. Longer-term directional exposure is harder to justify right now, while shorter-term, well-defined trades around key levels remain the higher-probability approach.
Nasdaq
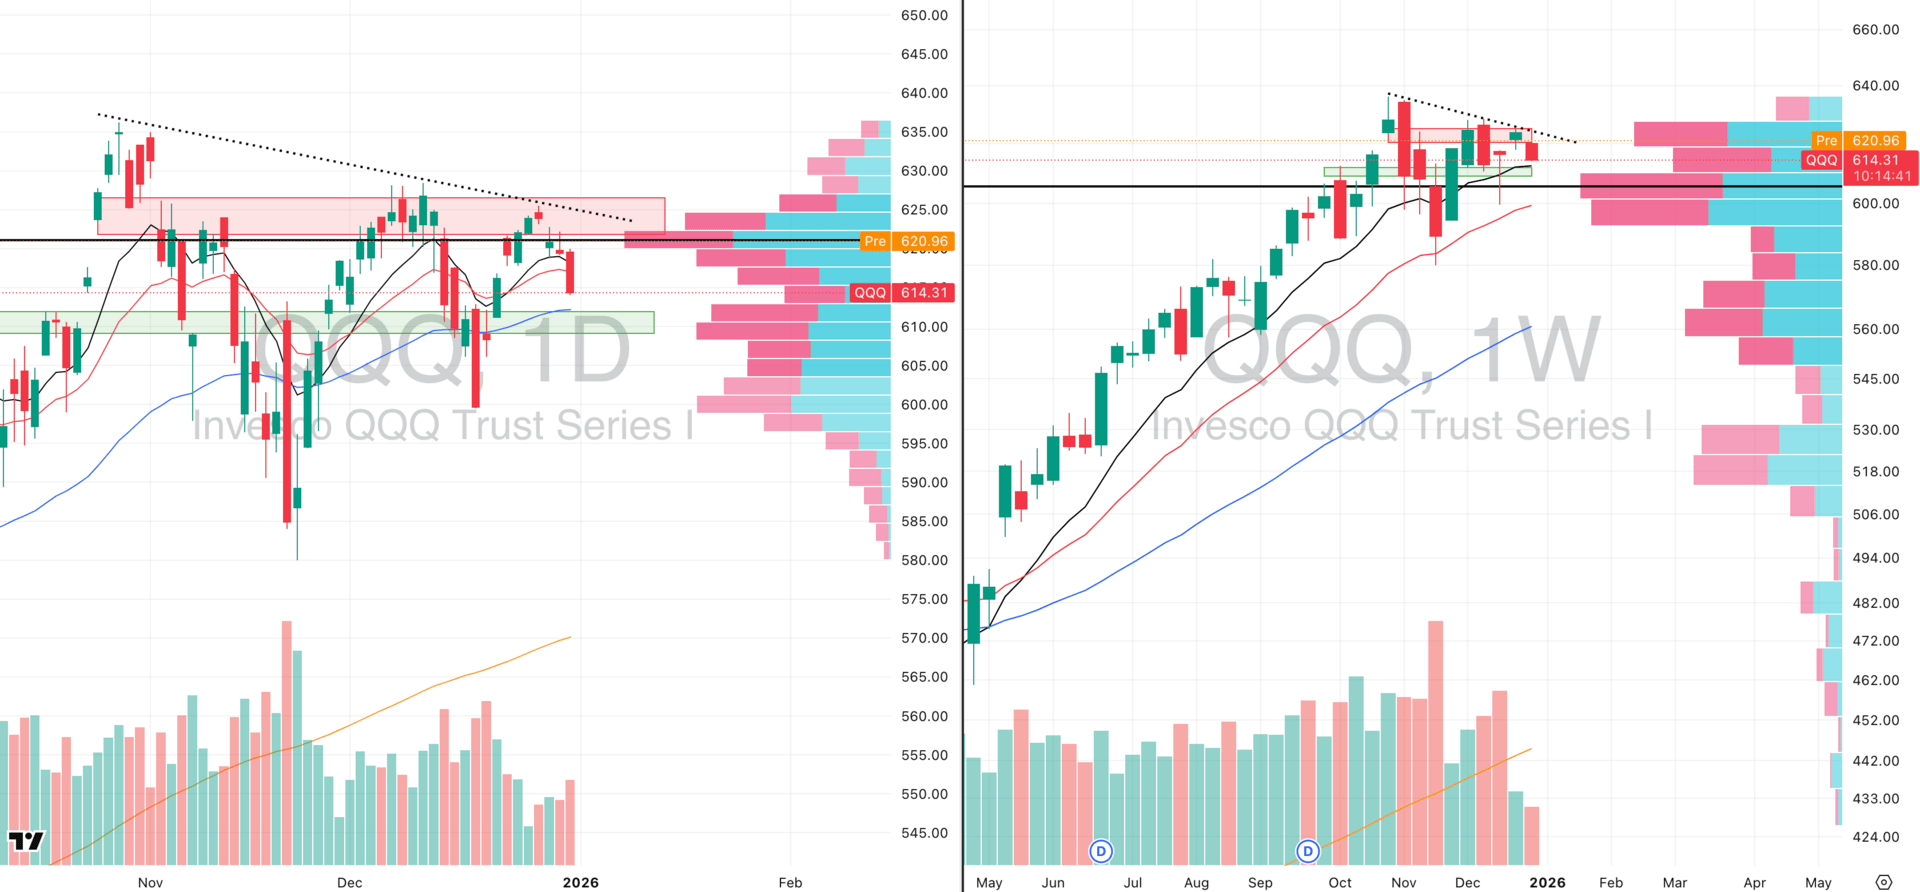
QQQ VRVP Daily & Weekly Chart
32.67%: over 20 EMA | 47.52%: over 50 EMA | 59.40%: over 200 EMA
Starting with the QQQ, price is currently sitting below both the 10-day and 20-day moving averages following what was a fairly painful session on December 31st. That move confirmed we remain in a short-term downturn, with price now posting three consecutive and very clear rejections at the same declining resistance level that has been in place since the late-October peak.
We are gapping higher this morning in premarket, which on the surface looks constructive. However, it is critical to keep proper perspective here. This market has not rewarded gap-up strength for several weeks now, and so far, we have not seen any meaningful gap-up sessions across the market produce sustained follow-through.
Because of that, our primary focus today is not the gap itself, but how price behaves after the open. A gap fill would not be surprising at all and, in fact, would be very consistent with recent behavior. What matters far more is whether the market can hold the gap-up lows once that initial liquidity shakeout takes place.
From a structural standpoint, there is still a meaningful amount of overhead supply extending up toward the 626 area, which continues to cap upside attempts. Until that supply is clearly absorbed, upside progress is likely to remain limited.
On the downside, the most important area to watch is the rising 10-week moving average near 612, which also aligns closely with the 50-day moving average. That zone represents the next logical area of demand and provides a clear confluence of support if the QQQ continues to work lower.
S&P 400 Midcap
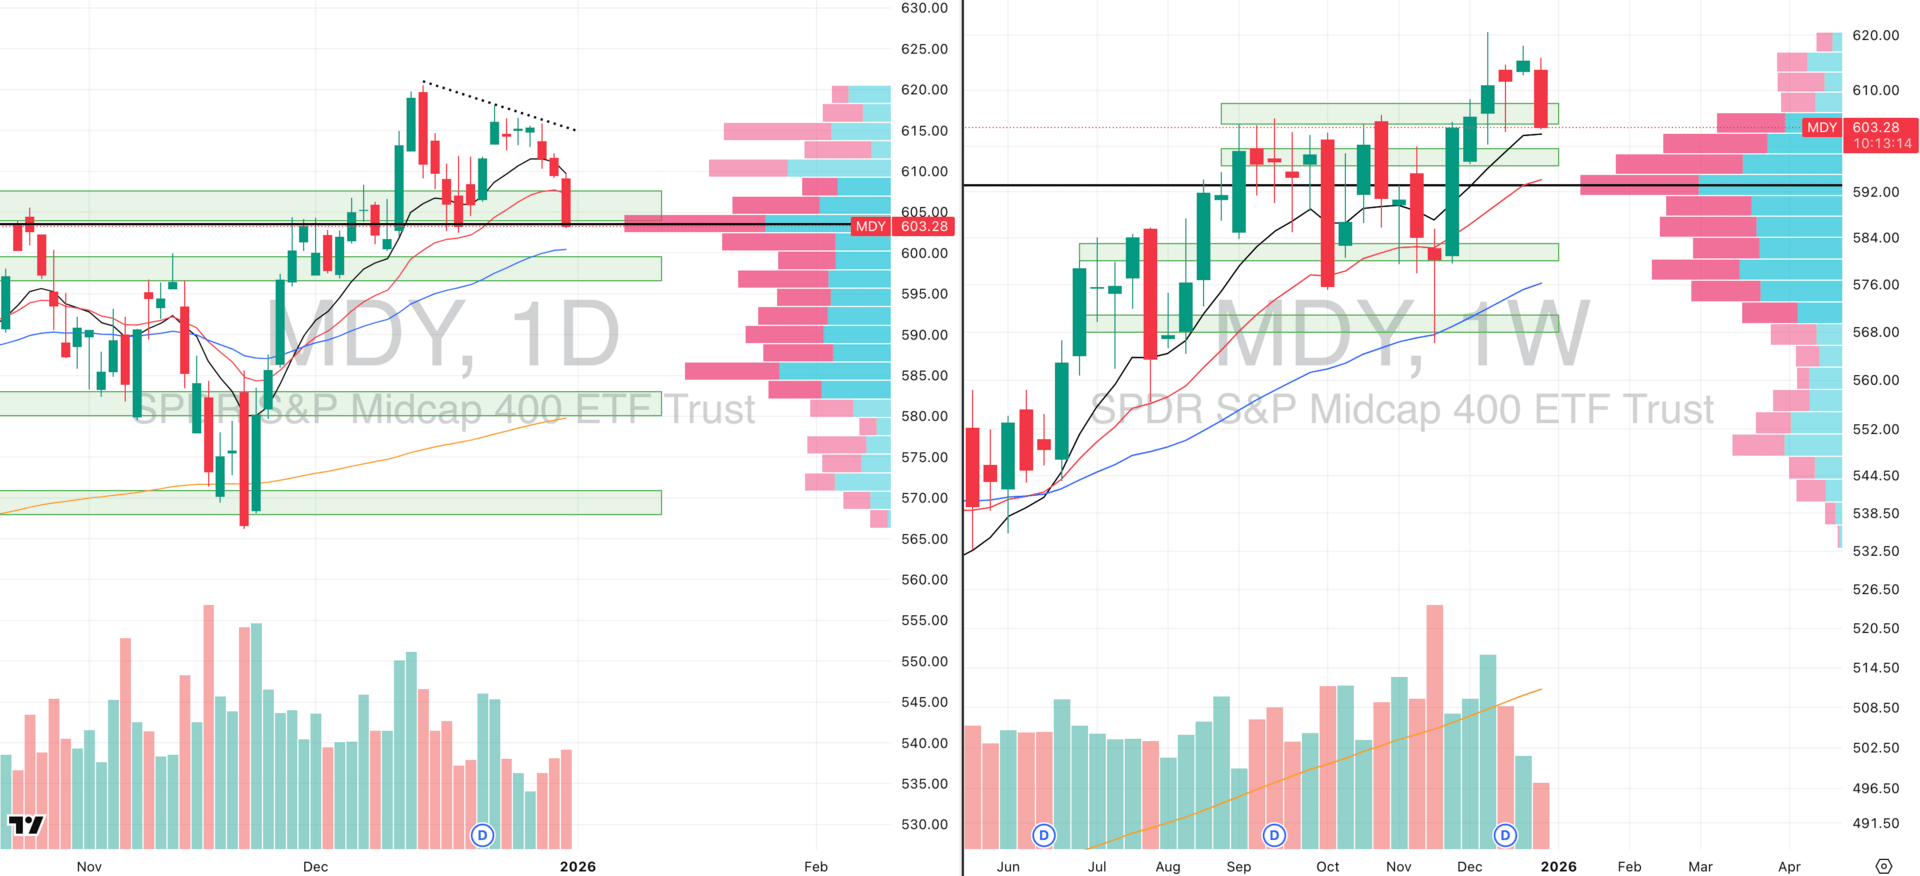
MDY VRVP Daily & Weekly Chart
28.35%: over 20 EMA | 53.49%: over 50 EMA | 55.75%: over 200 EMA
Looking at the mid-caps, we are clearly seeing downside acceleration take shape. We now have three consecutive sessions of rising relative volume as price continues to break lower, which unfortunately does validate the downside move and materially reduces the probability that this is simply a bear trap.
Price is currently sitting right on the daily point of control, which also lines up closely with the rising 10-week moving average. At this same level, the visible range volume profile becomes notably dense, and that confluence does increase the likelihood of at least a short-term slowdown in downside momentum.
This morning’s gap higher across the broader market very likely reflects that dynamic. Shorts are taking some profit into obvious support, and buyers are stepping in tactically rather than aggressively.
That said, we want to be very clear here: this is not the type of environment where we want to blindly trust strength. Structurally, this setup is starting to resemble a Wyckoff Phase C, which is a particularly dangerous area. Phase C can allow for sharp countertrend bounces, but it also often precedes further downside once that bounce is exhausted.
Russell 2000

IWM VRVP Daily & Weekly Chart
28.82%: over 20 EMA | 53.49%: over 50 EMA | 59.87%: over 200 EMA
Small caps are exhibiting the same behavior, but in a slightly more aggressive fashion. We are again seeing accelerating downside pressure, accompanied by increasing relative volume as price breaks lower, which confirms distribution rather than absorption.
The current bounce is occurring precisely where you would expect it to. We have a clean confluence of support at the daily 50-day moving average and the rising 10-week moving average, both lining up around the 246 level. This is an obvious area for short sellers to cover and for price to pause.
Importantly, this bounce is not isolated. When you look at the breadth indicators beneath each index, particularly the percentage of stocks trading above their 20-day EMA, it is clear that conditions across the market are deeply oversold.
That oversold backdrop explains why we are seeing mean reversion attempts this morning. However, oversold does not automatically mean bullish. It simply means downside pressure may temporarily slow before the market decides its next direction.
As with the mid-caps, the message here is caution. These bounces can be tradable on very short timeframes, but structurally the market has not yet done the work required to justify sustained upside exposure.
The Year-End Moves No One’s Watching

Markets don’t wait — and year-end waits even less.
In the final stretch, money rotates, funds window-dress, tax-loss selling meets bottom-fishing, and “Santa Rally” chatter turns into real tape. Most people notice after the move.
Elite Trade Club is your morning shortcut: a curated selection of the setups that still matter this year — the headlines that move stocks, catalysts on deck, and where smart money is positioning before New Year’s. One read. Five minutes. Actionable clarity.
If you want to start 2026 from a stronger spot, finish 2025 prepared. Join 200K+ traders who open our premarket briefing, place their plan, and let the open come to them.
By joining, you’ll receive Elite Trade Club emails and select partner insights. See Privacy Policy.
FOCUSED STOCK
RDDT: The Best Contraction We Are Tracking
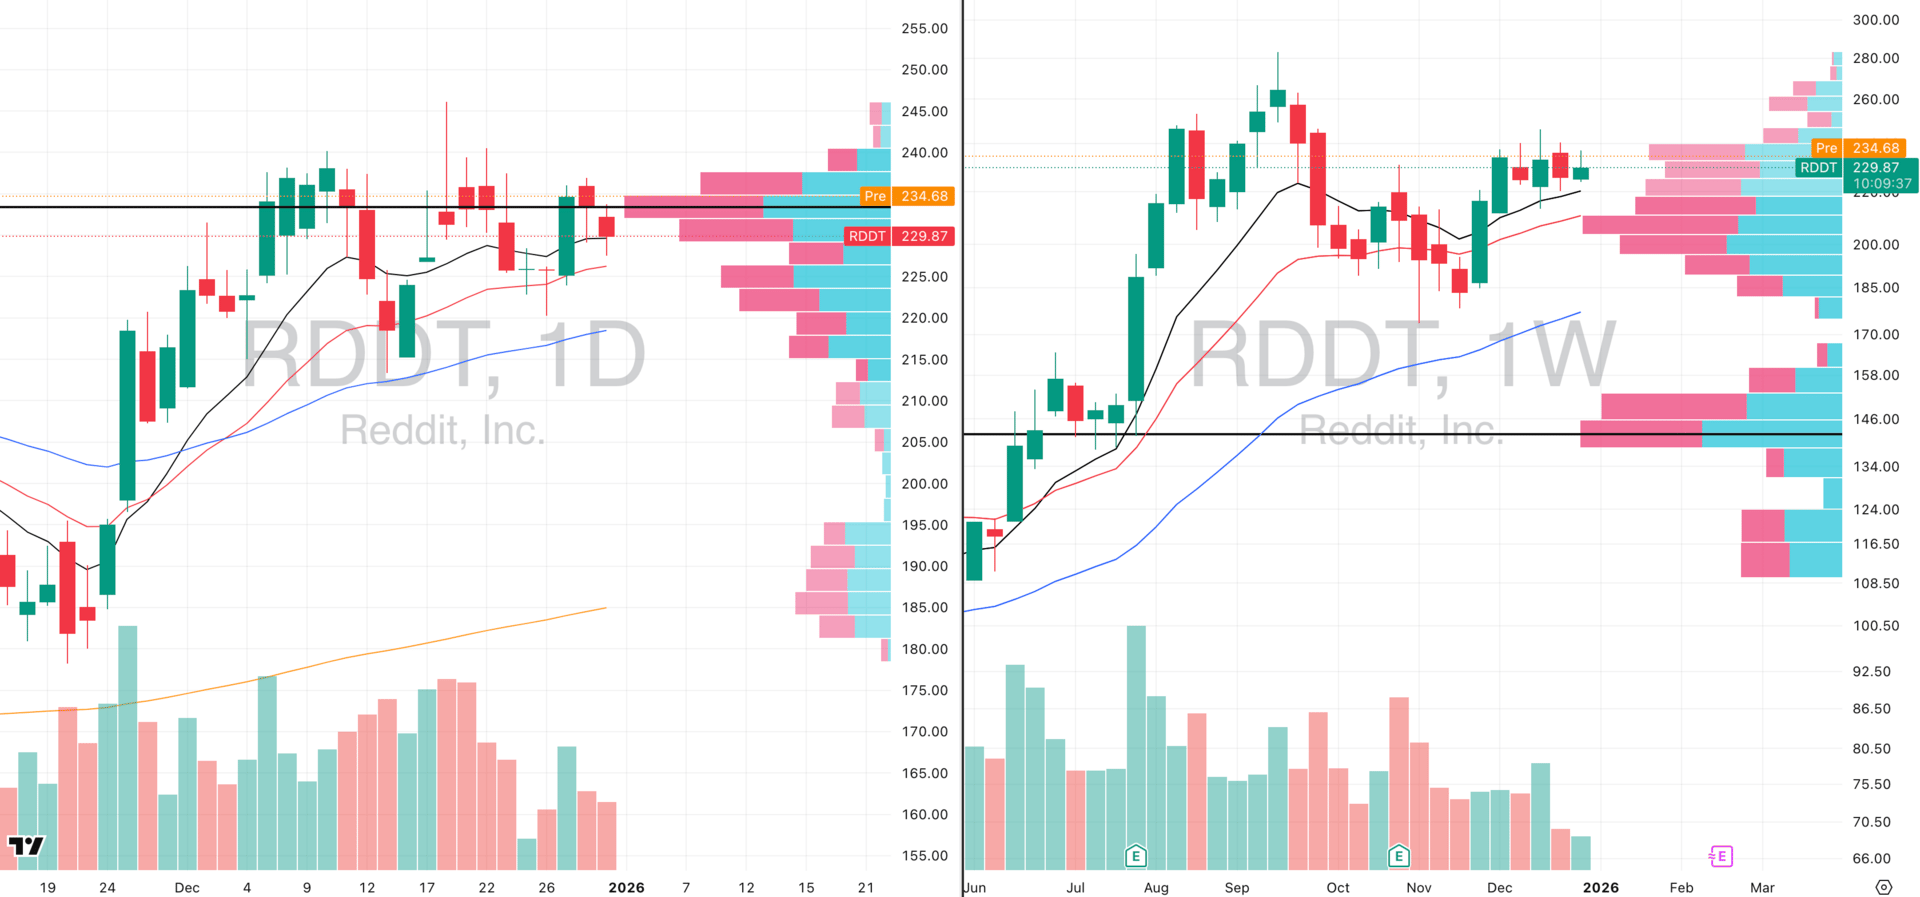
RDDT VRVP Daily & Weekly Chart
ADR%: 4.47% | Off 52-week high: -18.8% | Above 52-week low: +188.2%
Reddit continues to stand out as a clear relative strength leader, currently holding a relative strength rating of 95 versus the broader market. What makes this setup particularly compelling is the structure.
Over the last five weeks, Reddit has been in a very clean consolidation, holding above both the rising 10-week moving average and the rising 20-day moving average, which have consistently acted as support.
This is exactly what you want to see from a market leader during a corrective or choppy market phase. The stock has not broken down, it has not violated key trend levels, and it continues to absorb supply rather than distribute.
That said, Reddit is gapping up this morning, and we want to emphasize caution here. Despite Reddit’s relative strength, the broader market environment is still not especially conducive to aggressive trend-following long exposure.
At this stage, Reddit is best viewed as a name to add to your watchlist rather than something to chase. These are the stocks you want to track closely during corrective phases.
When the market eventually transitions back into a healthier trending environment, it is these relative strength leaders that will be the first to break out, hold those breakouts, and lead the market higher rather than rolling over. Reddit fits that profile very well.
FOCUSED GROUP
QTUM: The High Growth AI Proxy

QTUM VRVP Daily & Weekly Chart
For our focus group, we are continuing to track quantum computing via QTUM. This is a theme we have been watching closely for several weeks now. QTUM did attempt a breakout in early December with a push toward the 115 level, but that move ultimately failed as leadership across the group rolled over.
Names like QBTS, QUBT, RGTI, and IONQ, which are the strongest stocks within the segment, all failed to sustain their breakouts at the same time.
Since then, QTUM has pulled back and is now bouncing off its rising 10-week moving average. In corrective and consolidation phases like this, that is exactly the timeframe we want to focus on.
A general rule of thumb during market corrections is to de-emphasize daily moving averages for directional bias and instead zoom out to the intermediary trend on the weekly chart.
Weekly structure tells you whether a theme is being accumulated or distributed. Daily EMAs are far more useful once the market is in a confirmed trending phase, particularly for fine-tuning entries and exits.
As long as QTUM continues to hold its weekly structure and leadership names stabilize, this remains a group worth tracking closely for future opportunity rather than immediate action.

Did you find value in today's publication?This helps us better design our content for our readers |
Reply