- Swingly
- Posts
- Where Money Is Rotating (and Where It Isn’t)
Where Money Is Rotating (and Where It Isn’t)


MARKET ANALYSIS
Here’s All You Need To Know
Markets are heading into the week on the back foot, with futures lower ahead of the Fed meeting and a heavy earnings slate. This feels more like event risk being priced in rather than any sudden macro break, especially in the small and midcap space which were already extended and needed to cool off.
Gold pushing decisively above $5,000 is the clearest macro signal on the board right now. This move has been steady, not panic-driven, and every pullback has been bought.
Silver continuing to squeeze higher, alongside a weaker dollar, supports the same theme. Capital is still looking for ways out of fiat exposure rather than leaning fully into U.S. risk assets.
The precious metals are still the best group to push long exposure by far and although equities have bounced, but they’ve still logged a second straight weekly decline. That fits with what we’re seeing in the tape: rallies exist, but they’re not turning into sustained trend phases.
Earnings have been broadly strong, but price reactions are uneven. Intel is the reminder that forward guidance and narrative matter more than headline beats.
The Fed is widely expected to stay on hold. What matters is how they frame the path to cuts, but with inflation still sticky and the labor market softening, there’s no clean policy signal for markets to anchor to.
Political risk is back in the mix with shutdown headlines and renewed tariff talk. These are headline-driven volatility triggers rather than structural macro shifts, but they keep the tape reactive.
Nasdaq
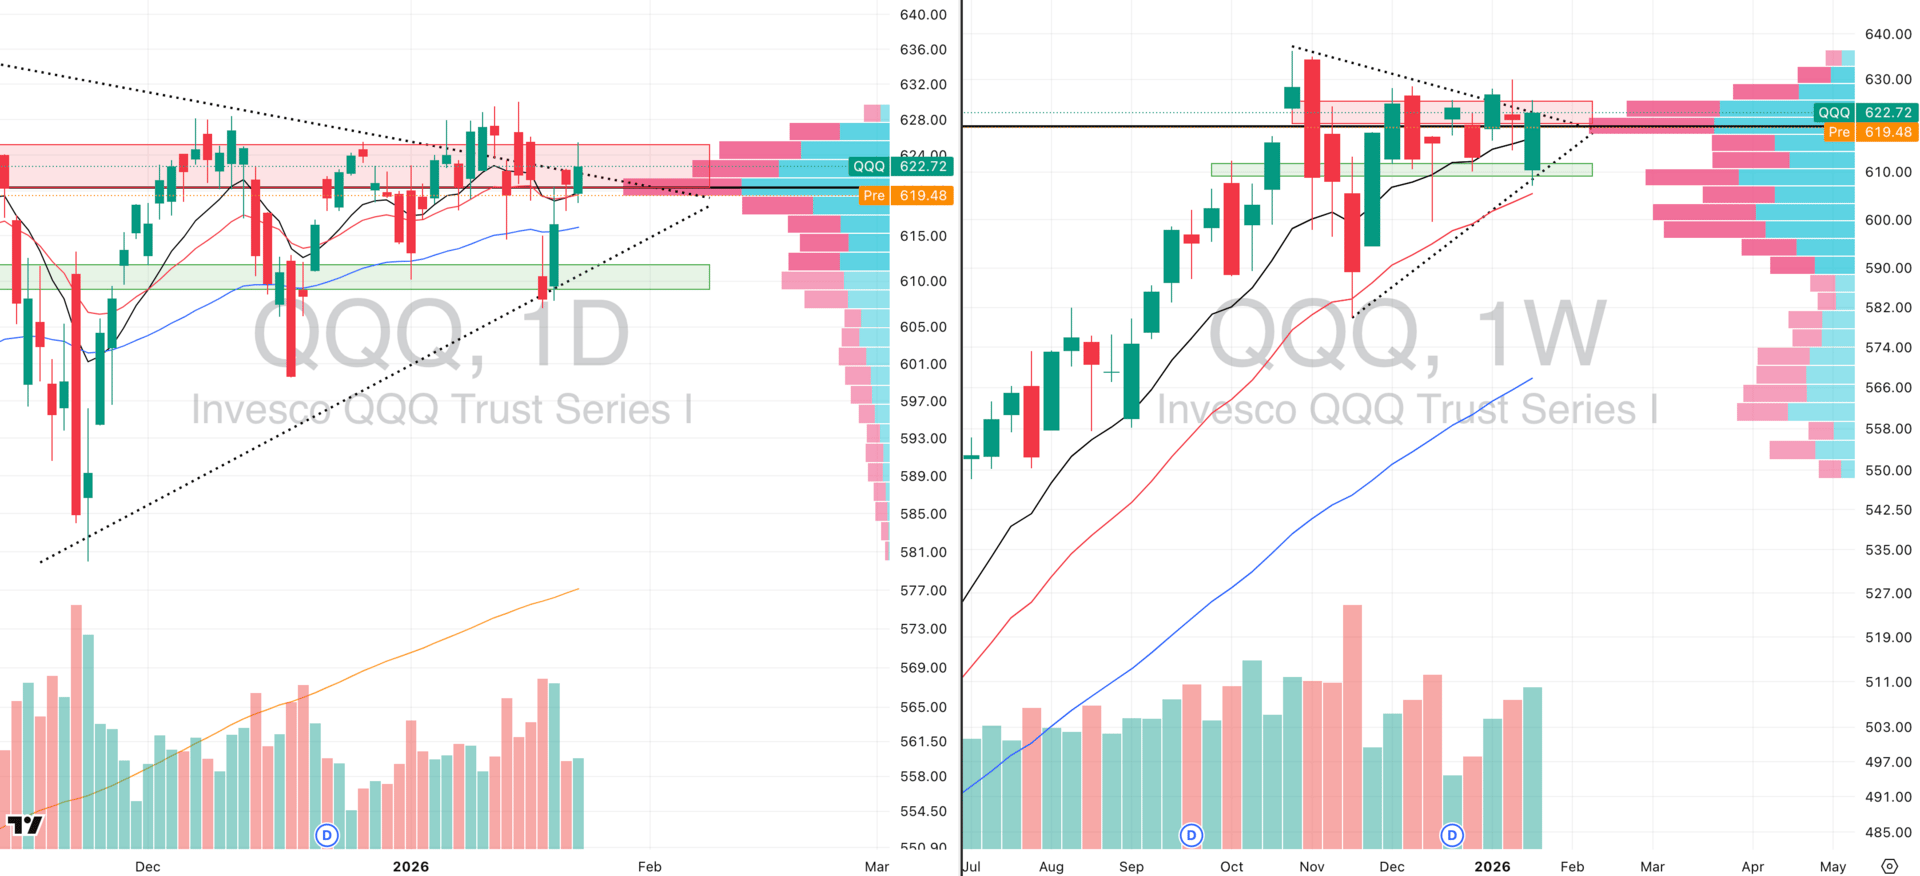
QQQ VRVP Daily & Weekly Chart
53.92%: over 20 EMA | 54.90%: over 50 EMA | 57.84%: over 200 EMA
Friday saw a strong push higher that attempted to break above 426, which has been a major supply zone dating back to December 4th and more recently between January 7th and January 16th.
That level remains heavy resistance, and price rejected there. The rejection came on relatively light volume, at just 79% of the 20-day average. The breakout attempt itself also occurred on low relative volume which materially reduces the probability of sustained follow-through.
For breakouts through established supply to be durable, you typically want to see abnormal relative volume expansion and we didn’t see that.
From here, we are somewhat vulnerable. If QQQ fails to hold the point of control at roughly 619, aligned with Friday’s lows, the next likely test is the rising 50-day EMA at 615.75, which is roughly a 0.7% move lower and well within normal QQQ volatility.
On the weekly timeframe, the structure remains constructive. Last week opened with a sell-off into the rising 20-week EMA, followed by a strong bullish engulfing candle on Wednesday, January 21st.
From that point, QQQ rallied nearly 3% in two sessions. Weekly relative volume on that recovery came in at 120% of the 20-week average, confirming demand stepping in at a key structural level.
From an intermediate perspective, this is still a consolidation phase rather than structural damage. QQQ continues to lag mid- and small-caps on a relative basis.
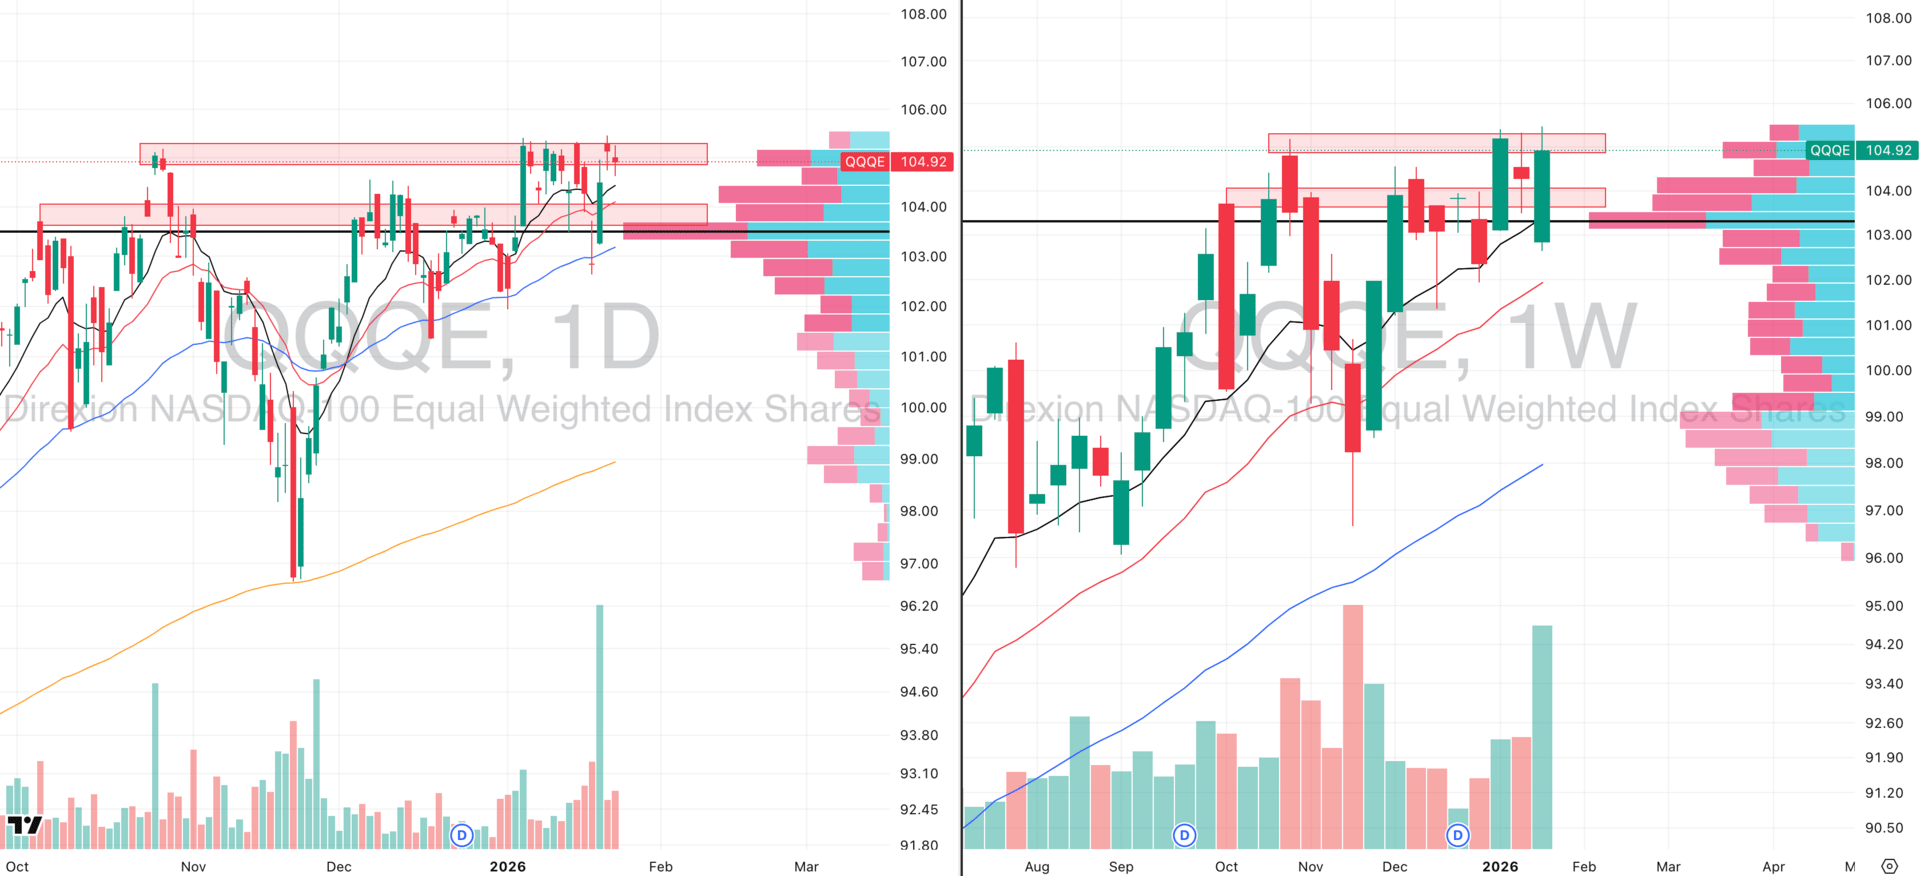
QQQE VRVP Daily & Weekly Chart
The equal-weighted NASDAQ (QQQE) is outperforming the cap-weighted index, and it is holding its 10-week EMA. This reinforces that the weakness is concentrated in megacap names rather than the broader NASDAQ complex.
Last week’s recovery in QQQE was particularly notable: the bullish engulfing candle on January 21st printed on 483% relative volume, the highest in over a year. That level of volume confirms broad participation beneath the surface.
From our perspective, the NASDAQ is likely past its underperformance phase. A clean breakout is not required here; continued range behavior between supply (red box) and demand (green box) remains the dominant trade framework, and that structure has been behaving well.
S&P 400 Midcap
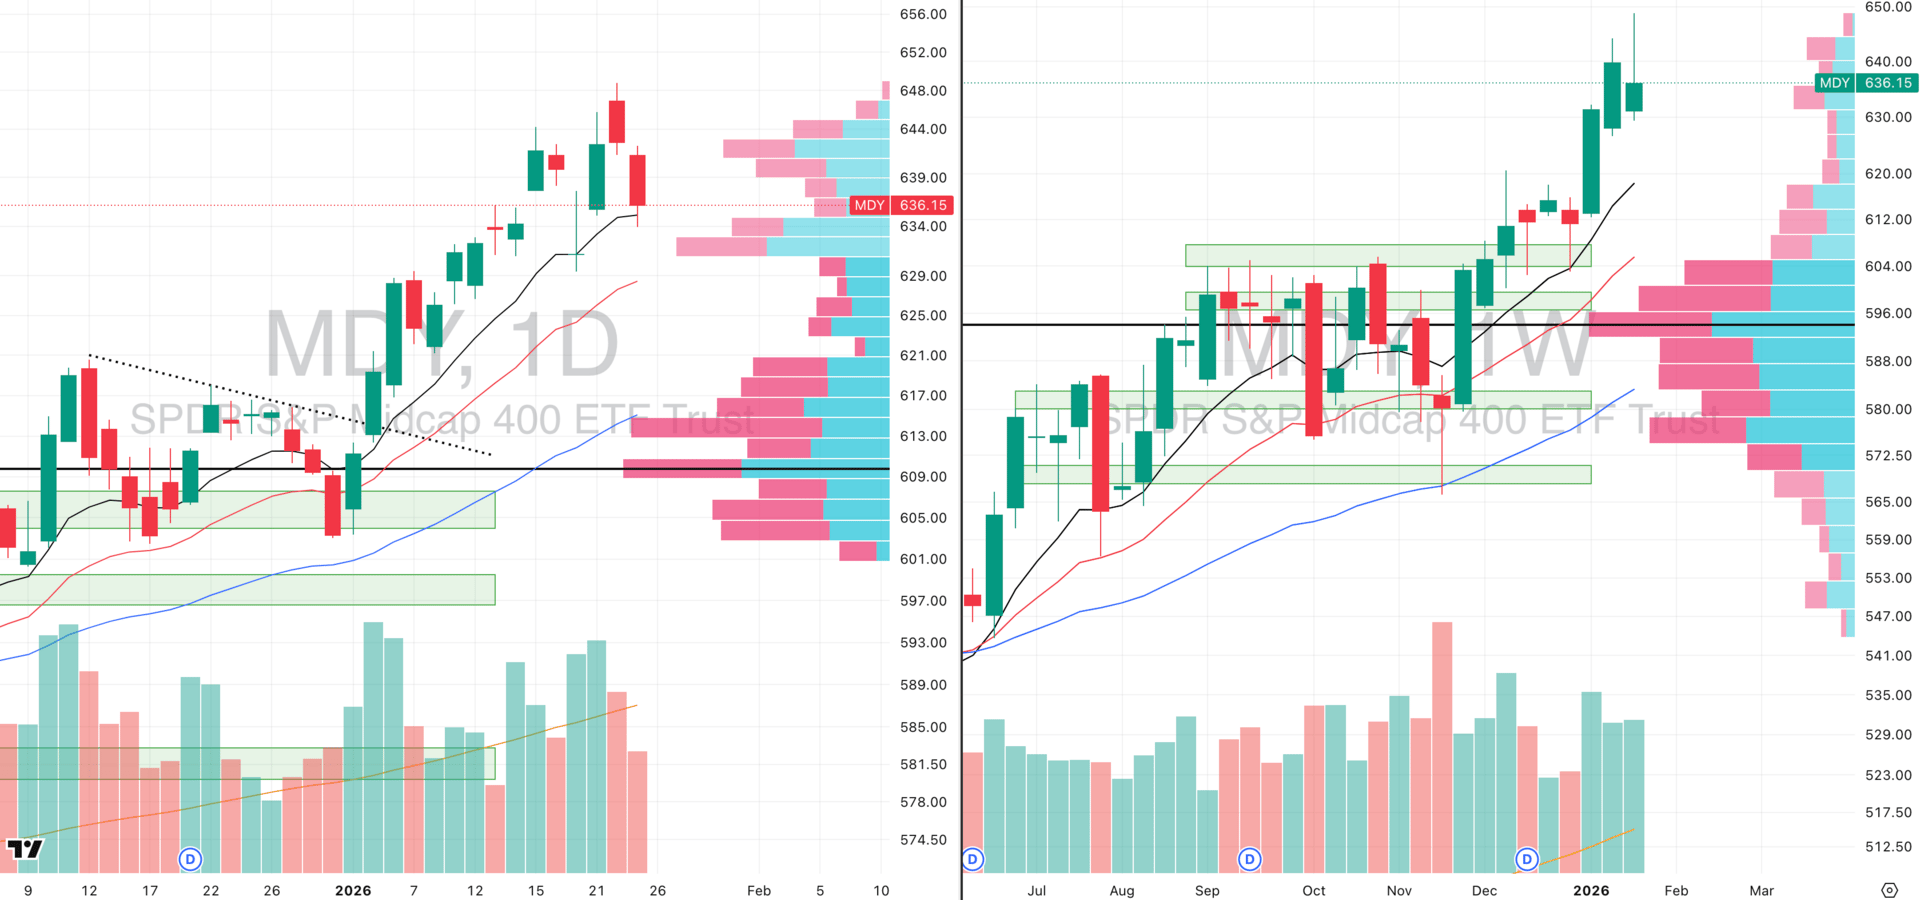
MDY VRVP Daily & Weekly Chart
62.81%: over 20 EMA | 69.84%: over 50 EMA | 68.34%: over 200 EMA
Mid-caps delivered the downside we outlined previously, driven primarily by visible profit-taking at highs. ATR multiples from the 50-day EMA have cooled to roughly 3.6, but mid-caps remain extended versus the 10-week EMA at 617, which is about 3% lower.
We do not expect an aggressive move to that level. The more probable downside scenario is a test of the 20-day EMA at 628.63, roughly a 1.38% move lower from Friday’s close.
The preferred outcome is continued consolidation and tightness, allowing moving averages to catch up and breadth to normalize.
Breadth across mid-cap stocks has cooled below 70% above the 20-, 50-, and 200-day EMAs, which is constructive as levels above 75% tend to be extended with poor asymmetry, so this reset is healthy.
Russell 2000
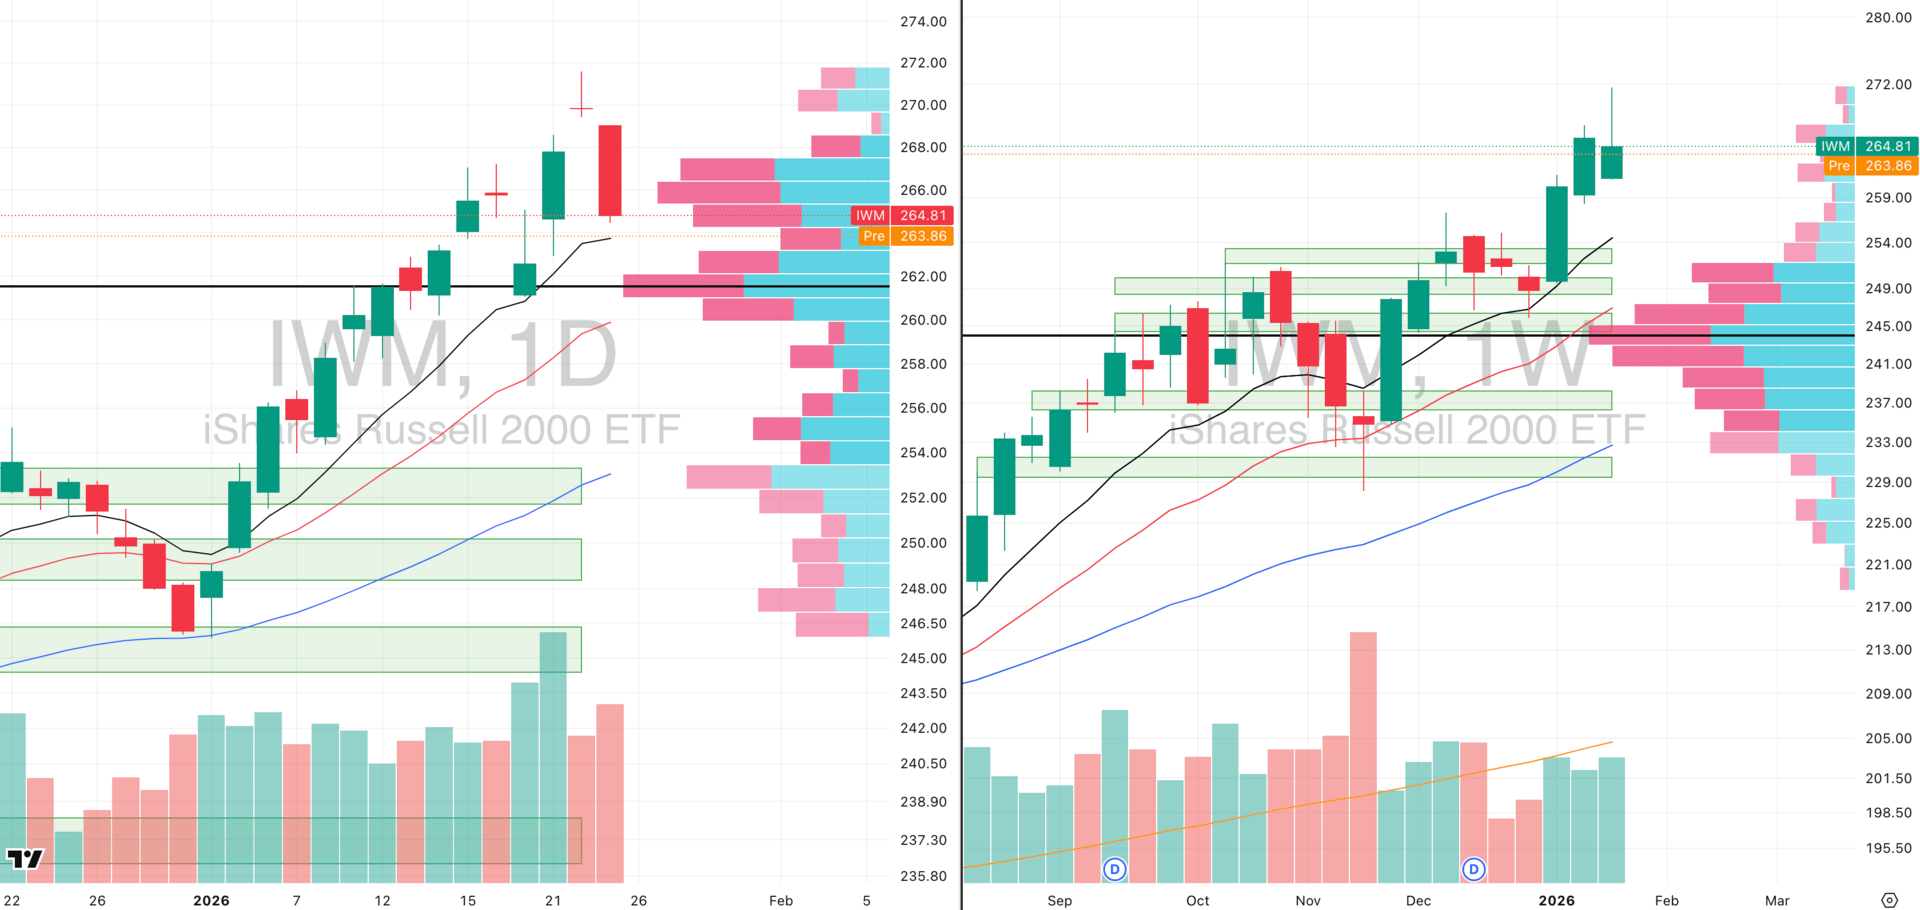
IWM VRVP Daily & Weekly Chart
63.79%: over 20 EMA | 68.18%: over 50 EMA | 67.30%: over 200 EMA
Small-caps behaved as expected, with Thursday’s weak candle structure setting up Friday’s move. IWM sold off roughly 2.2% into the 10-day EMA.
From here, the key is consolidation above the 10-day EMA and above the January 21st lows around 626.30. The visible range volume profile shows dense demand at 626.70, which is the primary level we expect to hold.
Relative strength versus the SPX remains strongest in small-caps, currently around 82, compared to mid-caps in the 60s and QQQ around 72.
Structurally, small-caps remain the relative leader, with near-term consolidation expected rather than a broader breakdown.
FOCUSED STOCK
VRT: The Strongest Large Cap Growth Stock
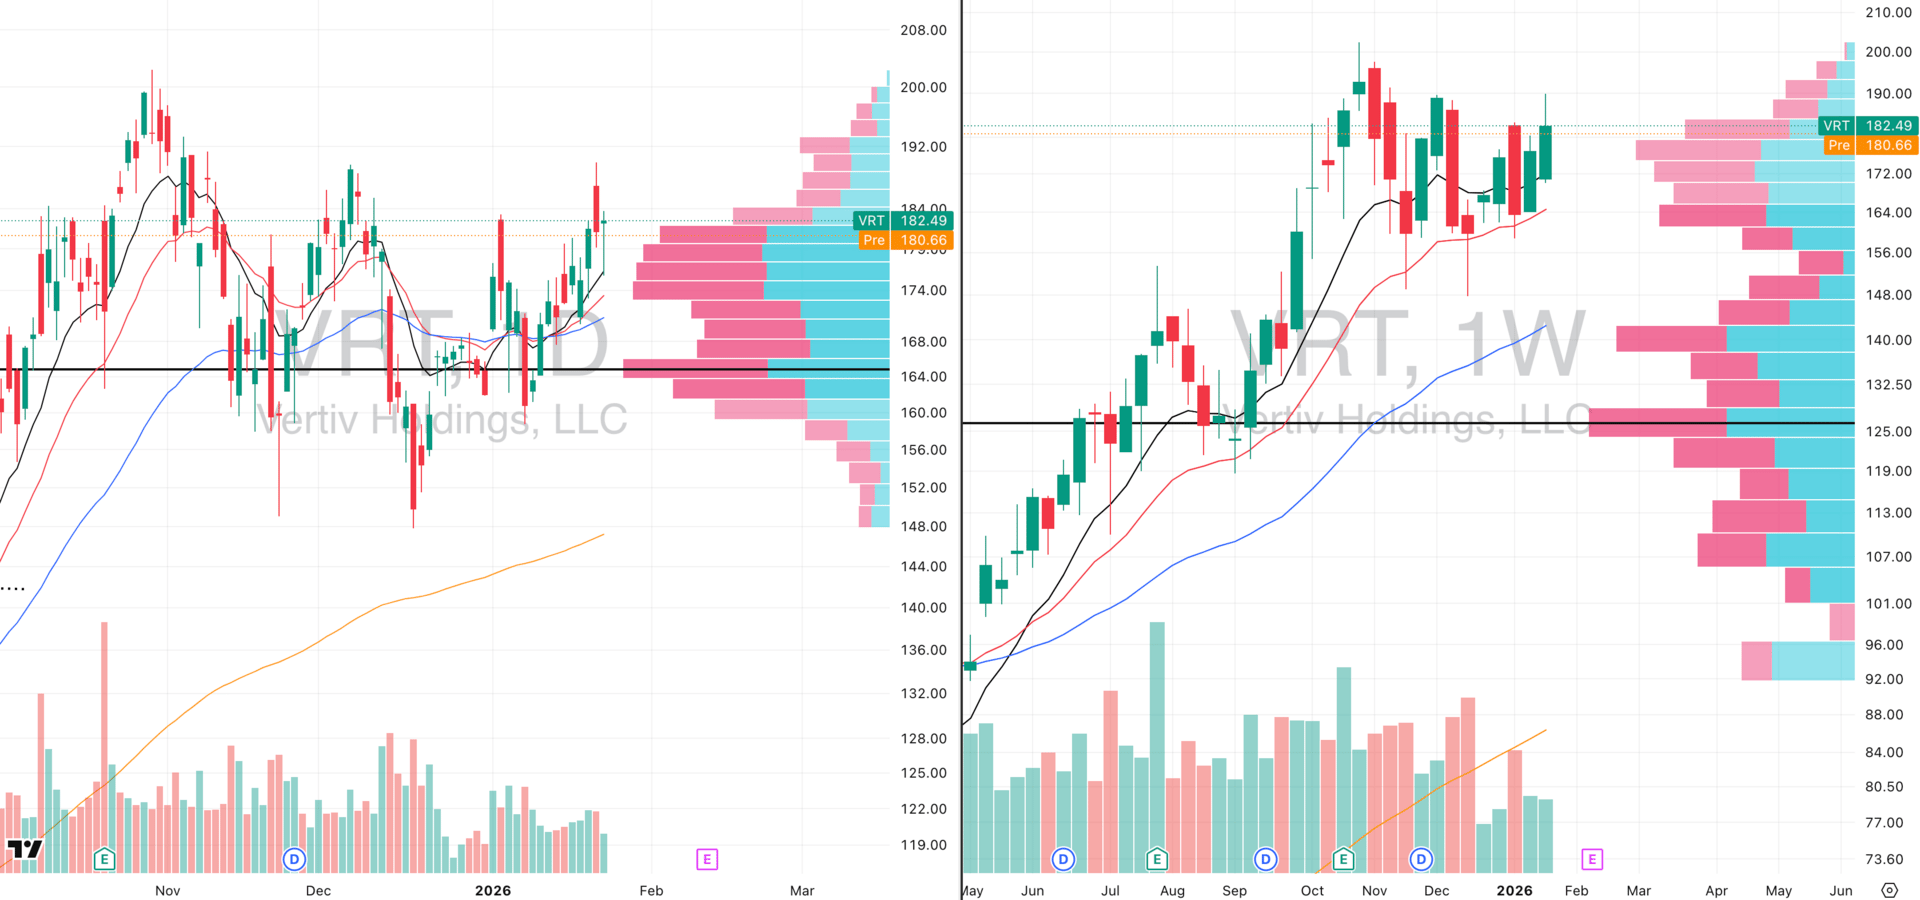
VRT VRVP Daily & Weekly Chart
ADR%: 4.27% | Off 52-week high: -9.8% | Above 52-week low: +240.8%
This week’s focus stock is VRT and the reason it stands out is the quality and consistency of its contraction since the week of October 27th.
Relative strength versus the SPX is currently around 92, which places it among the strongest names in the market.
Vertiv designs, manufactures, and services critical digital infrastructure technology, primarily for data centers, as well as communication networks and commercial and industrial environments.
It is deeply embedded in the AI and cloud infrastructure supply chain and operates across Greater China, Australia, New Zealand, Southeast Asia, India, Europe, the Middle East, and Africa, giving it broad geographic exposure.
Revenue growth and internal fundamentals remain strong, but the primary focus here is the technical structure.
Technically, VRT has shown repeated, clean reactions off the 20-week EMA, with a linear weekly contraction pattern and steadily rising relative strength.
The stock continues to reward pullback entries rather than breakout chasing as we can see the breakout attempt last Thursday failed, but the subsequent pullback to the 10-day moving average around 75.80 provided a high-quality entry, reinforcing the importance of buying pullbacks in strong trends rather than chasing marginal highs.

Did you find value in today's publication?This helps us better design our content for our readers |
Reply