- Swingly
- Posts
- What The Ceasefire Means For Traders
What The Ceasefire Means For Traders


MARKET ANALYSIS
Here’s What You Need To Know

Today’s open is mechanically very strong, but we would still approach it with caution rather than immediately assume clean trend continuation.
The reason is obvious: the market is reacting to a major overnight macro relief event, a two-week ceasefire between the U.S., Iran, and Israel, with the Strait of Hormuz reopening temporarily, which has triggered a violent unwind in energy pricing and a broad risk-on futures move.
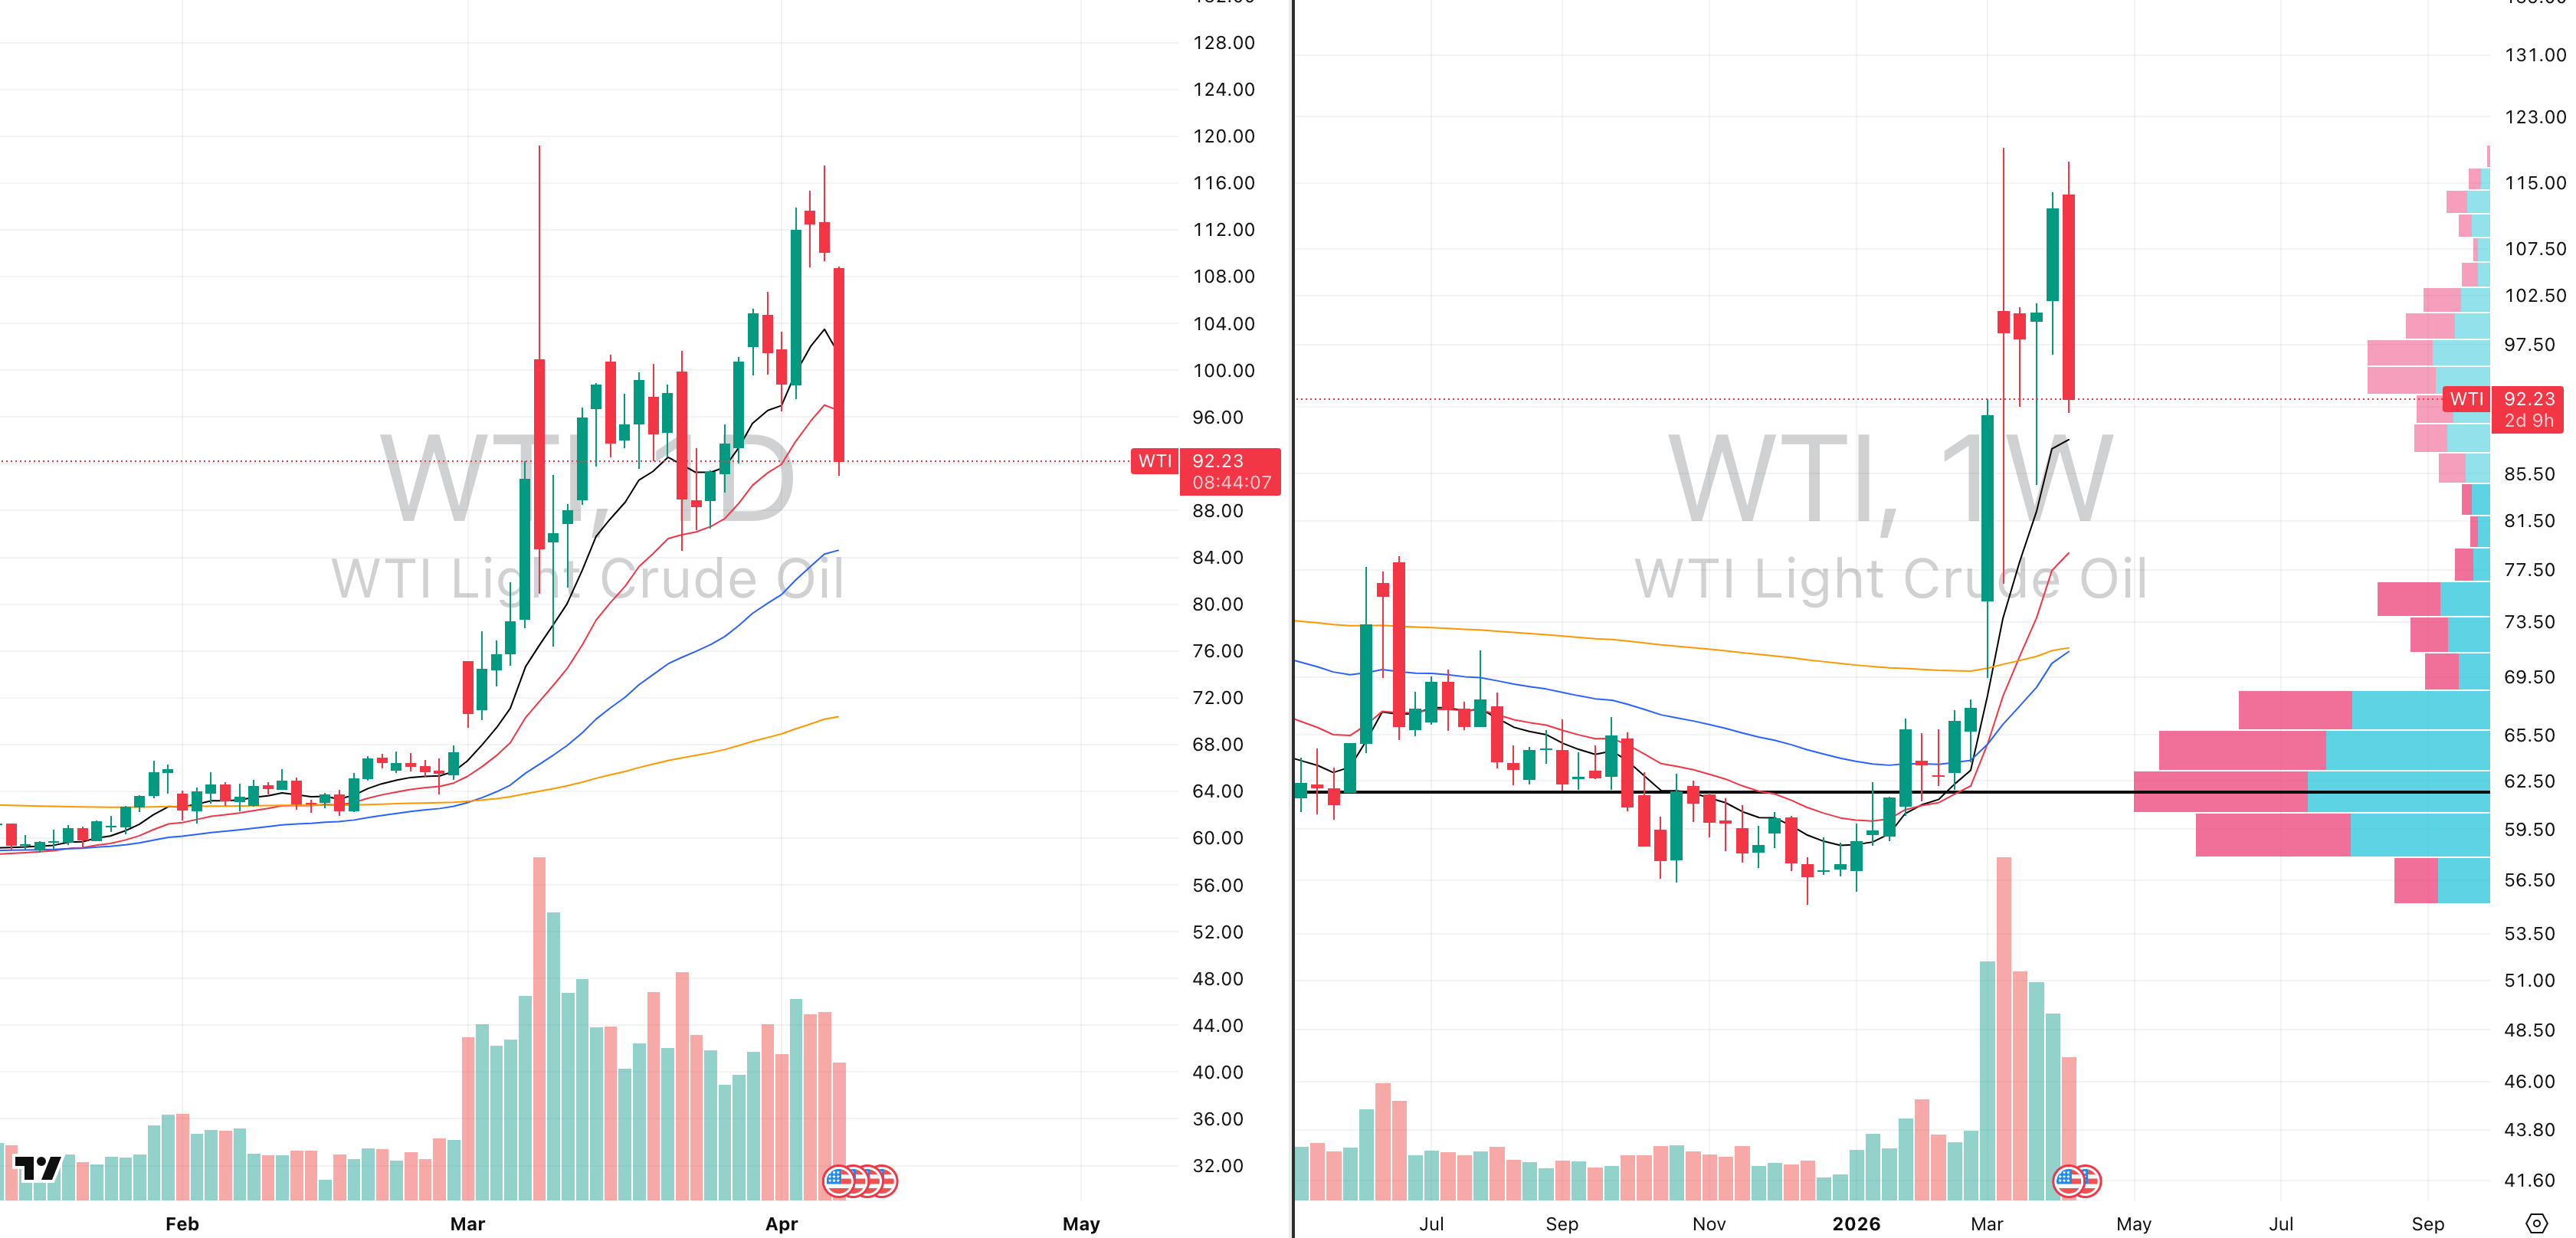
WTI VRVP Daily & Weekly Chart
The immediate transmission mechanism is oil and West Texas Intermediate has collapsed below $95, down almost 18% intraday, which is one of the sharpest single-session reversals seen since the conflict began.
But the important nuance is this: despite the collapse, oil is still above its 10-week EMA, and that is now the key technical level everyone should be watching very closely.
If crude finds support there and rebounds, a large part of this morning’s equity enthusiasm could fade very quickly.
In other words, lower oil this morning helps equities immediately, but oil has not yet structurally broken trend even U.S. officials are already framing it as temporary, and the agreement is only the first real sign we have seen that Washington and Tehran may actually be willing to move toward direct negotiation rather than escalation.
Markets are currently pricing relief from worst-case energy disruption and that is important to keep in mind as a trader because futures are already extremely strong:
Dow futures +1,300
S&P futures nearly +3%
Nasdaq futures +3.5%
Moves of that size often create exactly the kind of opening where the first hour becomes emotionally stretched.
And in environments like this, very strong opens often fade once initial positioning clears.
That is why today is likely better treated as an observation session rather than an aggressive initiation session.
What matters most is how the market closes after absorbing this gap and if equities hold most of the gain into the close while oil remains weak, that would confirm real acceptance of the ceasefire.
If instead oil stabilises and indices begin fading hard intraday, that would suggest the market still does not fully trust this truce.
For now, the right posture is patience:
watch oil versus the 10-week EMA
watch whether the opening gap gets sold
watch whether breadth remains strong into the close
S&P 500

SPY VRVP Daily & Weekly Chart
53.28%: over 20 EMA | 29.82%: over 50 EMA | 48.11%: over 200 EMA
The SPY is opening with an exceptionally aggressive gap higher, reclaiming all major daily and weekly moving averages in a single session and pushing directly into the $680 supply cluster, which is now the first major area where we are watching very closely for a potential reversal.
That level matters because it is the next dense overhead volume zone, meaning there is still a significant amount of trapped supply likely sitting there from prior distribution.
Yesterday’s 79% relative volume session is largely irrelevant now, because the overnight macro shift completely changed positioning dynamics, with the ceasefire announcement forcing a full repricing of risk across global assets.
What is particularly interesting for traders who read our weekend report, where we covered the Commitment of Traders positioning in detail, is that we had already seen open interest beginning to climb again across index exposure.
That increase in open interest originally appeared to be driven by how mechanically stretched the market had become after the prior selloff, but today it now looks increasingly likely that open interest expands again as fresh positioning enters behind the macro relief move.
This is important because genuine trend reversals usually require more than price — they require new participation, and open interest rising into upside expansion is often one of the clearest signs that the move is being accepted structurally.
We want to reiterate very clearly today that traders should not get emotional on the open, because there is still substantial supply sitting overhead and the first move is often the least informative part of the session.
The correct approach is to give the market time to drift, potentially retrace, and then observe whether buyers can defend higher prices after the initial gap.
If the SPY can absorb supply near $680 and still close strongly, that becomes much stronger evidence that today is a genuine character-change session rather than simply a relief-driven opening spike.
Nasdaq
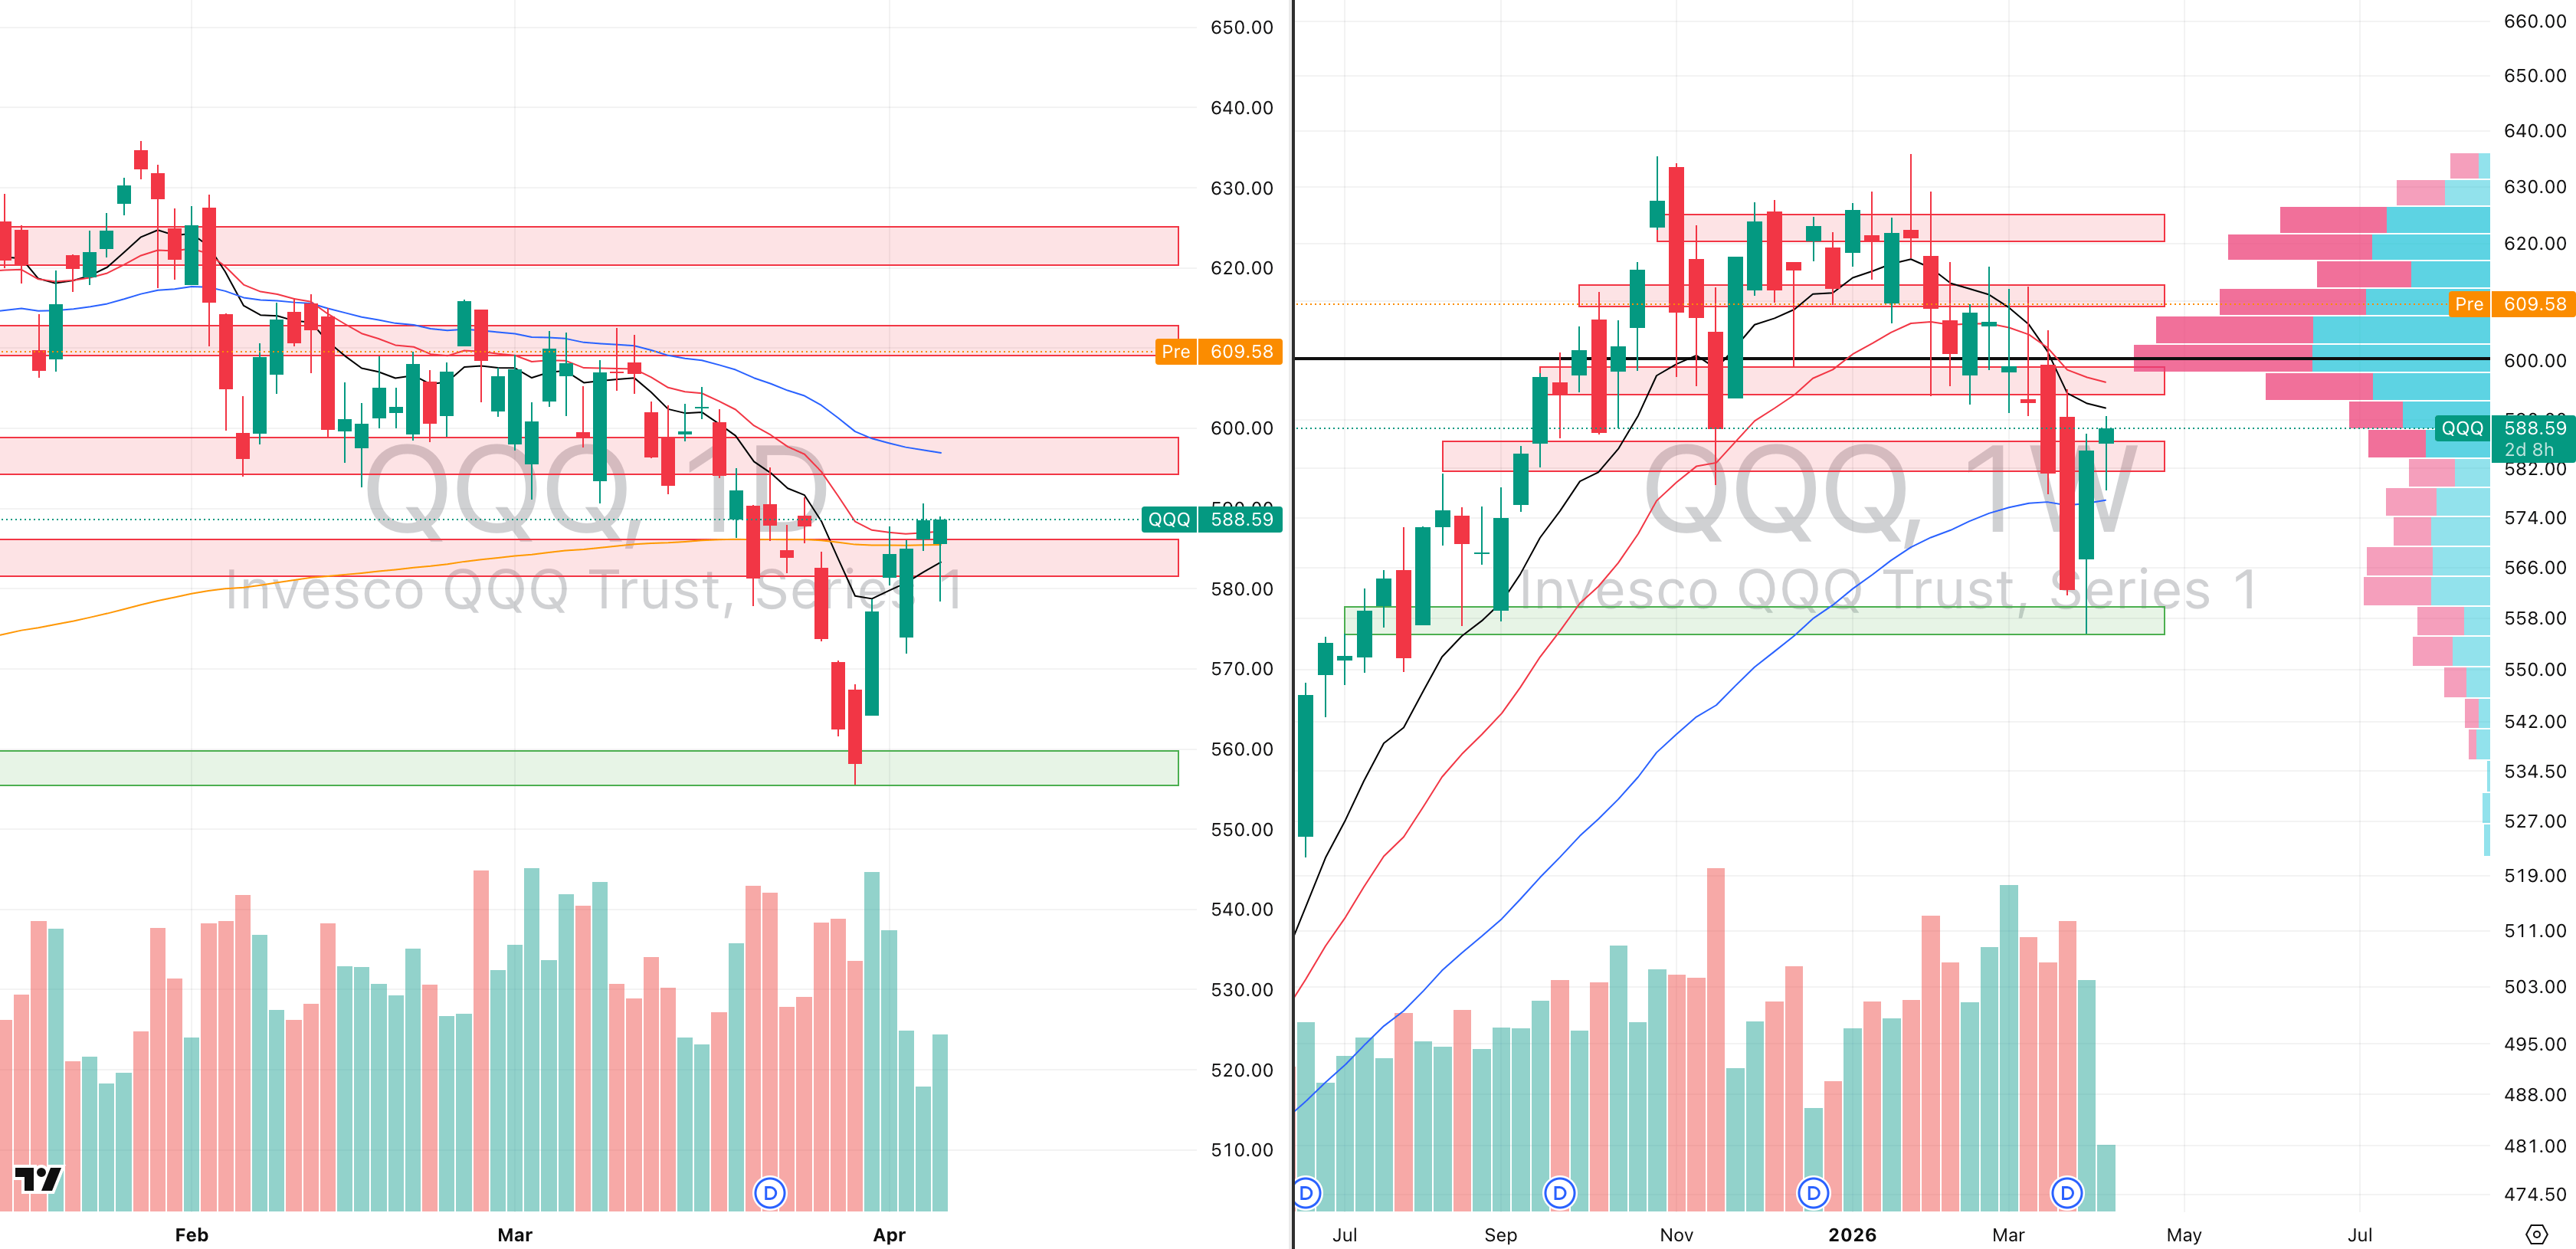
QQQ VRVP Daily & Weekly Chart
51.48%: over 20 EMA | 30.69%: over 50 EMA | 45.54%: over 200 EMA
The Nasdaq is already pushing through its dense supply level at $608, and taking out that level this early is objectively very impressive given how heavily this index has been pressured over recent months.
However, despite the strength, traders still need to be prepared for the possibility of a gap fill lower because large overnight repricing events often produce early volatility before the true intraday trend becomes clear.
The two most important things to monitor today are relative volume into the close and the total ADR expansion of the session.
If today’s total daily range exceeds the Nasdaq’s 20-day ADR baseline of 1.54%, while also closing with a full green body and expanding participation, that becomes highly significant because it would confirm aggressive institutional demand rather than simply short covering.
If that happens, it becomes especially important because the Nasdaq has been one of the most damaged parts of the market during the recent selloff, which means upside asymmetry remains particularly strong here if real trend repair is beginning.
Again, we strongly encourage everyone to revisit our Sunday positioning report, because hedge fund positioning had already begun shifting before today’s move, which is one reason this rally has such strong mechanical potential.
Technically, the Nasdaq is now reinforcing a very clear inverse head-and-shoulders structure on the daily timeframe.
The left shoulder formed in late March, the head formed during the deep selloff into the lows, and the recent consolidation created the right shoulder that today is now breaking higher.
This move is also reclaiming the daily 10 EMA, 20 EMA, 200-day EMA, while holding above the 50-week EMA, which is exactly the kind of stacked technical reclaim that often marks genuine intermediate trend change.
S&P 400 Midcap

MDY VRVP Daily & Weekly Chart
61.00%: over 20 EMA | 33.75%: over 50 EMA | 50.00%: over 200 EMA
Mid-caps have now clearly validated their Adam and Adam double bottom, with the first low formed on 20 March and the second low formed on 30 March.
Both bottoms developed around the 200-day EMA, the 50-week EMA, and the $600 structural demand zone, which makes the technical base highly credible.
This is not just visually constructive — statistically, Adam and Adam double bottoms are high-quality reversal structures.
Historically, they carry a 16% break-even failure rate, an average rise of 39%, and a 73% probability of meeting price target, which places this among the stronger classical reversal patterns.
What matters now is that this structure is no longer hypothetical — today’s price action is actively validating it.
We still carry the same caution that a gap fill lower remains possible, especially if oil finds support on its 10-week EMA and rebounds intraday.
But at the same time, we cannot ignore that this is now a statistically significant bullish structure that deserves respect.
High-probability reversal patterns should always be taken seriously when they begin confirming under improving macro conditions.
Russell 2000

IWM VRVP Daily & Weekly Chart
64.91%: over 20 EMA | 42.09%: over 50 EMA | 51.14%: over 200 EMA
Small caps are gapping directly into a very important overhead volume zone between $263 and $265, which is the full prior distribution range that developed over 49 trading days between 12 January and 2 March.
That zone matters because it effectively formed the head of the head-and-shoulders top we had been closely monitoring on the weekly structure.
What today’s move is now beginning to do is invalidate that bearish structure, which is a very constructive development.
From our perspective, the Russell had already been showing major relative strength beneath the surface even before today’s gap higher.
If price can now hold this breakout and maintain relative strength, then the IWM becomes one of the most important indices to track over coming sessions.
Relative strength is already sitting around 71 versus the SPX, which remains materially stronger than many traders appreciate.
Small caps also tend to respond very aggressively when oil weakens and financial conditions ease, which makes today’s macro backdrop particularly supportive if the move holds.
Alongside the Nasdaq, the Russell remains one of the most asymmetric areas of the market if today develops into true trend acceptance.
FOCUSED GROUP
BTCUSD: Crypto Getting Ready To Expand
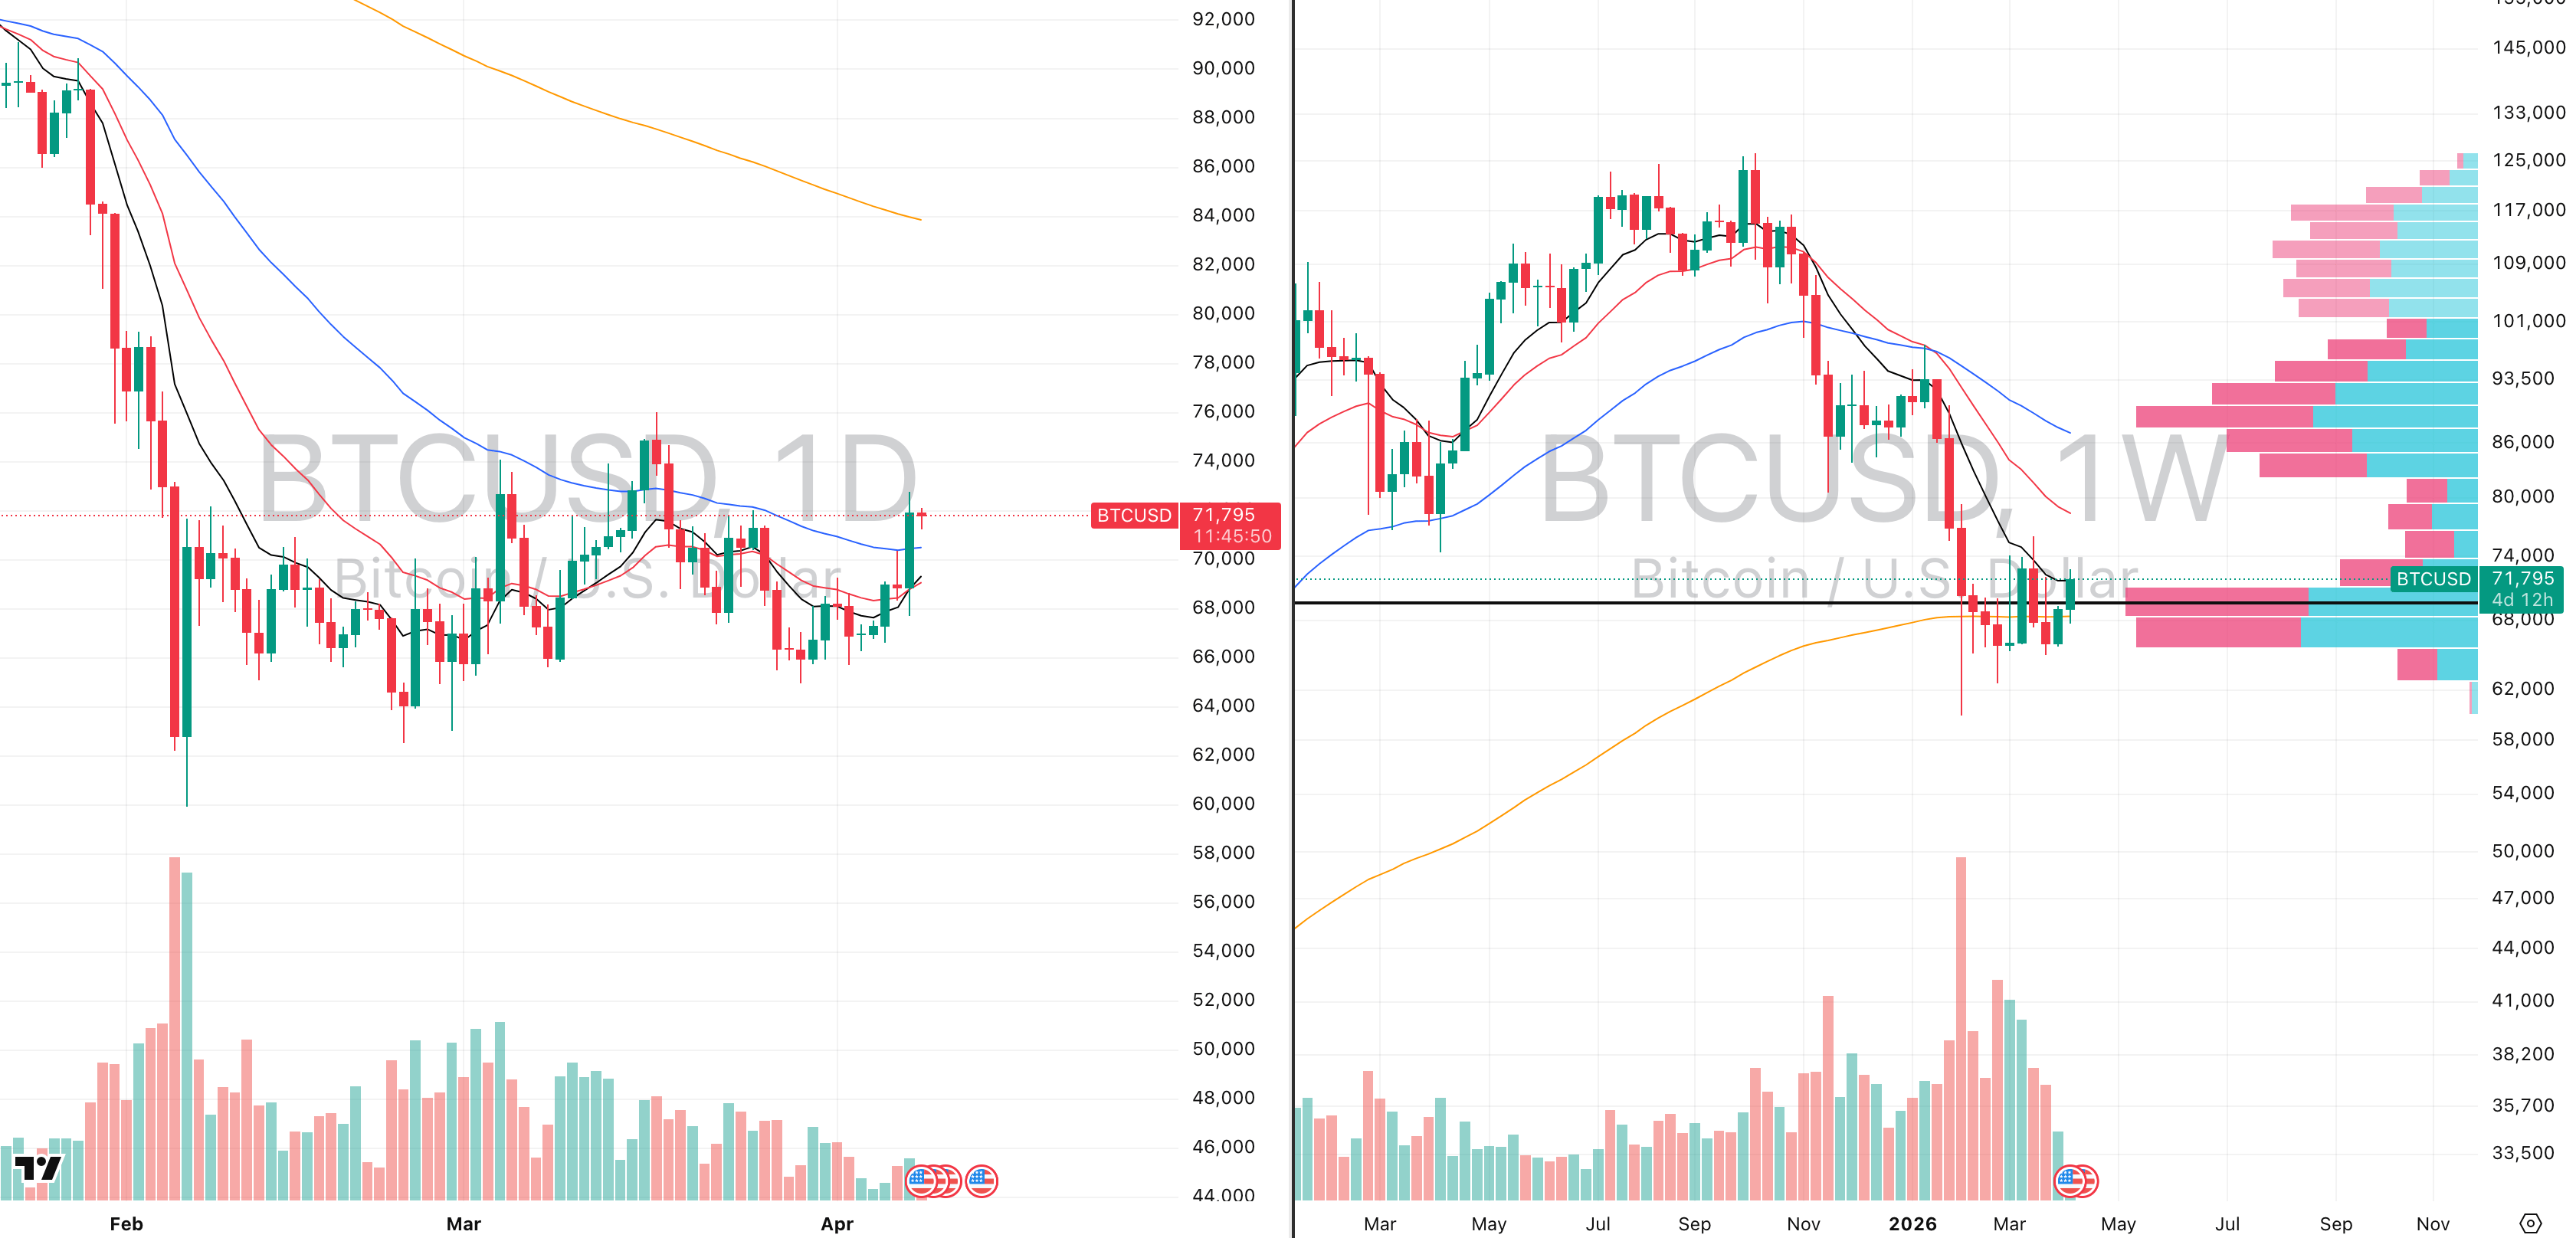
BTCUSD VRVP Daily & Weekly Chart
Bitcoin is becoming increasingly interesting because weekly relative volume continues drying up aggressively during what now appears to be the formation of an Eve and Eve double bottom on the intermediate trend.
That matters because this is statistically one of the stronger bullish reversal structures available in classical pattern work.
Historically, Eve and Eve double bottoms rank 5th out of 39 major bullish structures, with only a 12% break-even failure rate, an average rise of 50%, and a 65% probability of meeting price target.
Technically, the pattern is forming directly on the weekly 200 EMA, which has now been reclaimed and defended.
That combination of a high-probability reversal pattern forming on a major long-term moving average while volume contracts is exactly the kind of setup that often produces strong upside asymmetry.
Bitcoin is largely being ignored because it has underperformed for months, but that often creates the best opportunity when macro conditions begin improving.
If macro stabilisation continues and risk appetite broadens, BTCUSD and crypto miners immediately become one of the most important secondary areas to monitor because the upside asymmetry here is now materially larger than most traders currently recognise

Did you find value in today's publication?This helps us better design our content for our readers |
Reply