- Swingly
- Posts
- We Should Bounce Today: How To Play It
We Should Bounce Today: How To Play It
In partnership with


MARKET ANALYSIS
What You Need To Know

Futures bounce after three down days.
U.S. futures are modestly higher this morning after the S&P 500 and Dow logged a third straight losing session yesterday. This looks more like short-term stabilization than a change in character, and nothing aggressive showing up pre-market. This would be a great opportunity for some intraday trades, however, be cautious building trend following positions here.
Jobs data still being digested, not re-priced
Markets are continuing to work through the delayed labour data. October’s -105k job loss and the jump in unemployment to 4.6% are keeping pressure on growth expectations, even though November’s +64k print beat estimates. The trend still points to slowing, not re-acceleration.Energy weakness is weighing on sentiment
Oil closed at its lowest level since 2021, driven by surplus concerns and renewed optimism around a Ukraine resolution. Energy stocks were one of yesterday’s main drags, with the majors down roughly 2%. That move is feeding into the broader “cooling growth” narrative.No urgency from rates — yet
Despite the softer data, there’s still no real shift in near-term Fed pricing. The market is treating this as confirmation of a slowdown rather than a trigger for immediate policy change. Fed speakers later today (Waller, Williams) could shape expectations at the margin, but the bar for a hawkish or dovish surprise is high.Eyes on CPI next
Attention now shifts to Thursday’s CPI print. With labour data muddy and energy rolling over, inflation is the next piece needed to either calm or amplify current positioning.This morning’s bounce looks technical and fragile. The macro backdrop hasn’t improved — it’s just stopped getting worse for the moment. Until CPI clears, traders are likely to stay selective and reactive rather than commit fresh risk.
Nasdaq

QQQ VRVP Daily & Weekly Chart
57.42%: over 20 EMA | 54.45%: over 50 EMA | 58.41%: over 200 EMA
Structure still unresolved
The Adam & Eve double top on the Nasdaq is still in play.
The Adam top formed with the sharp spike in late October / early November (best seen on the weekly).
The Eve top developed more gradually and has now rolled over.
The valley low between the two tops sits around 581, which defines the structure.
Downside risk (if confirmed)
An Adam & Eve resolution would imply ~4.5–5% downside from current levels.
That is not the base case, but it remains a risk while this structure is unresolved.
What’s happening now
Price is holding a short-term demand zone around the 50-day MA.
Yesterday’s bounce came on ~92% of average volume — not explosive, but acceptable given the importance of the level.
On the weekly, price also held the 10-week MA, which is critical for the intermediary trend.
Why this level matters
If the Nasdaq fails to hold the 10-week and rolls over, that would confirm the double top and likely open the door to multi-month downside.
We do not see enough evidence yet to say that scenario is underway.
How to approach it
Any bounce here should be treated as short-term unless momentum starts to expand decisively.
This is not an environment to assume trend continuation without confirmation.
S&P 400 Midcap

MDY VRVP Daily & Weekly Chart
63.50%: over 20 EMA | 60.25%: over 50 EMA | 61.50%: over 200 EMA
Pullback behaved as expected
Mid caps pulled back into the prior demand zone, briefly undercutting it and tagging the 20-day MA.
Importantly, price held, then rebounded.
Positive intraday behavior
Yesterday’s candle recovered roughly 50% of the prior day’s range.
MDY nearly reclaimed the 10-day MA, which is a constructive sign given broader market weakness.
Key levels
The 608 area is now acting as near-term support.
We are not yet upgrading this to a confirmed demand zone — stabilization is still needed.
Risk level
A break below 604 (20-day MA) would be concerning.
That would likely open the door to a sharp move toward ~597, which would materially damage the structure.
Current takeaway
This is close to the best-case scenario following yesterday’s sell-off.
As long as price holds above 608, mid caps remain constructive relative to the broader market.
Russell 2000

IWM VRVP Daily & Weekly Chart
70.76%: over 20 EMA | 63.63%: over 50 EMA | 64.10%: over 200 EMA
Weaker relative behavior
Small caps underperformed both Nasdaq and mid caps.
Price sold down intraday to test the 20-day MA, then attempted a rebound.
Supply still in control
The bounce failed into clear supply around 252.
Rejection from that level reaffirmed it as overhead supply.
Where the market decides
The 248–247.50 zone is critical.
This aligns with demand and the 20-day MA.
Failure to hold this area would likely trigger a ~2.3–2.5% drop toward the 10-week MA.
Why this matters
A move to the 10-week would represent a meaningful character shift, not just noise.
That would significantly increase downside risk across risk assets.
The market is approaching a decision point.
Either:
demand holds and a bounce develops, or
key short-term supports fail and weakness extends.
We are likely to get clarity this week, not later.
The Year-End Moves No One’s Watching

Markets don’t wait — and year-end waits even less.
In the final stretch, money rotates, funds window-dress, tax-loss selling meets bottom-fishing, and “Santa Rally” chatter turns into real tape. Most people notice after the move.
Elite Trade Club is your morning shortcut: a curated selection of the setups that still matter this year — the headlines that move stocks, catalysts on deck, and where smart money is positioning before New Year’s. One read. Five minutes. Actionable clarity.
If you want to start 2026 from a stronger spot, finish 2025 prepared. Join 200K+ traders who open our premarket briefing, place their plan, and let the open come to them.
By joining, you’ll receive Elite Trade Club emails and select partner insights. See Privacy Policy.
FOCUSED STOCK
LMND: Don’t Skip This One!

LMND VRVP Daily & Weekly Chart
ADR%: 7.78% | Off 52-week high: -3.7% | Above 52-week low: +234.7%
Why this stock stands out
Lemonade has been quietly one of the strongest stocks in the market since breaking out in May.
It entered a clear intermediary Stage 2 uptrend at that point and has remained in it.
Relative strength vs S&P 500 is 98, putting it essentially at the very top of the market.
Trend and structure
Since Nov 17, LMND has been building higher lows, bouncing cleanly off the 10-week MA.
That same area lines up with the 20-day MA, which has acted as consistent dynamic support.
The stock has not broken below its 20-day or 20-week MA during this entire advance.
Recent price action
Yesterday’s session was particularly constructive:
Price opened right off the 20-day MA (~75.75).
Reclaimed the point of control.
Pushed higher on ~114% of 20-day average volume.
Price is now tightening, with contraction forming near the highs.
Volatility and upside potential
LMND has a very high ADR (~7.8%), meaning moves can accelerate quickly once it breaks.
Short interest remains elevated, which increases the probability of fast upside extensions on strength.
Since the May breakout, the stock is up ~142% without losing trend support.
While not the focus for most traders, LMND also has strong revenue and earnings growth, which supports sustained institutional interest.
FOCUSED GROUP
TAN: A Primary Trend Turning Point
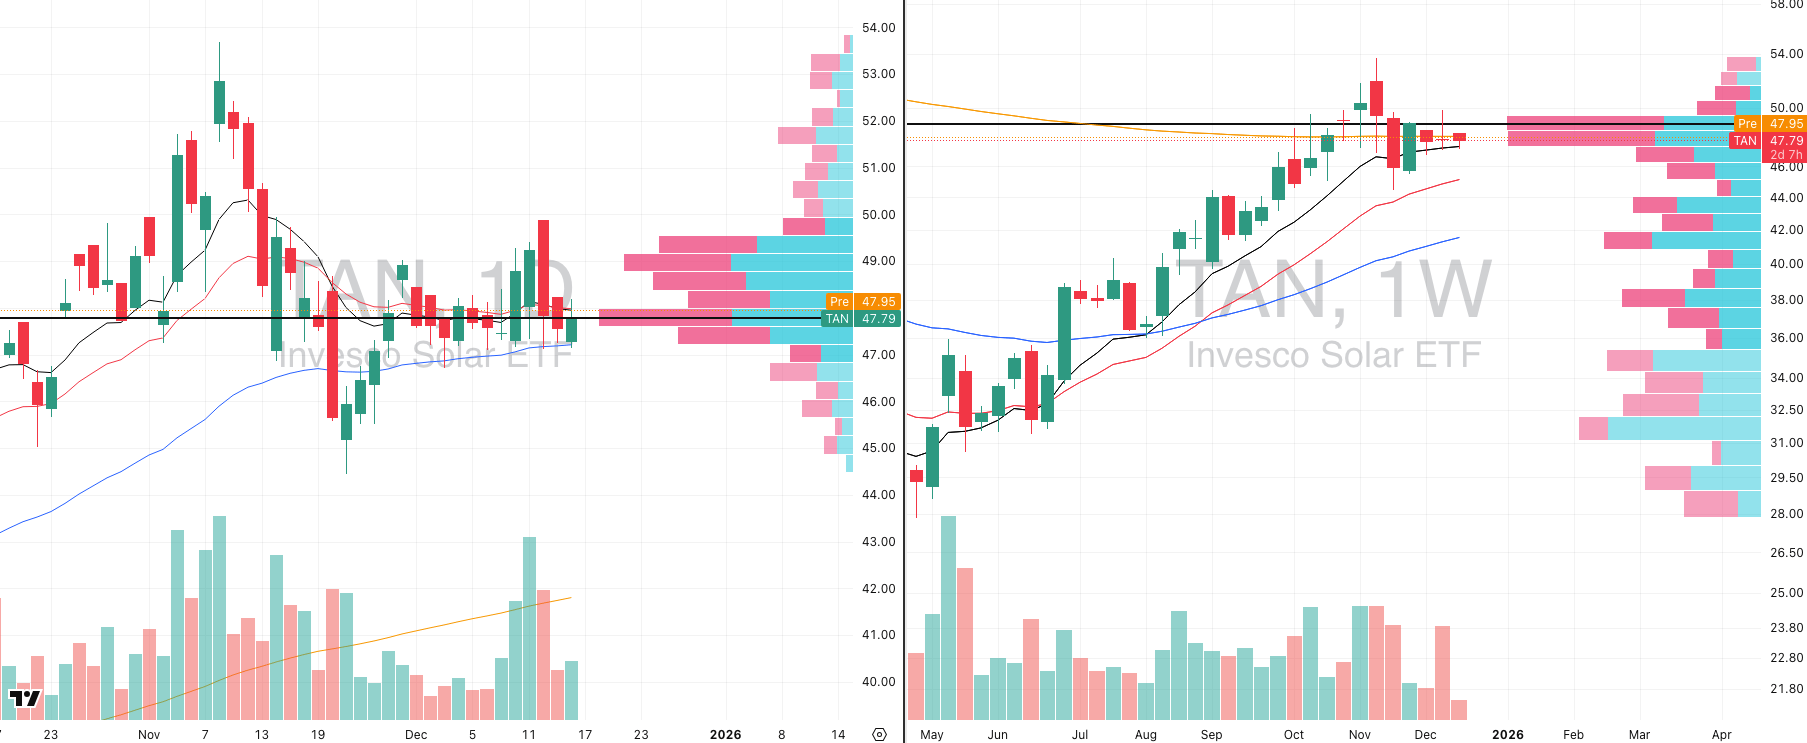
TAN VRVP Daily & Weekly Chart
Current setup
TAN is consolidating tightly on the daily chart, just below its breakout area around 48.30.
Price is holding above the 50-day MA and has not lost the 10- or 20-week MAs.
Bigger picture
After the sharp rally earlier this year, TAN has been digesting gains without breaking trend.
The ETF is now sitting at a major long-term inflection point:
Above the 200-week MA
Supported by the 10-week MA
Price action has become extremely compressed at this level.
Why this matters
A breakout above ~50.15 would be significant.
This would mark the first major upside resolution from a long-term contraction since TAN’s rally began in 2020.
This is an intermediary-trend contraction, not a short-term setup.
Entries taken off the daily chart here are effectively positioning for a move that can play out on the weekly and monthly timeframes.
That creates very strong asymmetry if the breakout resolves higher (or even lower).

Did you find value in today's publication?This helps us better design our content for our readers |
Reply