- Swingly
- Posts
- VIX Spike, Oil Rally & Equities Sell Off...
VIX Spike, Oil Rally & Equities Sell Off...


MARKET ANALYSIS
Here’s All You Need To Know

The market is finally starting to show some profit taking this morning, with Nasdaq futures leading lower after what has been an extremely aggressive multi week run in technology, semiconductors and AI linked equities.
This is not surprising. We have been warning for several reports now that the growth trade was becoming technically stretched, with the Nasdaq, semiconductors, quantum computing and large cap technology all trading at very high ATR multiple extensions from their 50 day moving averages.
The key point is that this pullback is not being caused by a collapse in the AI story. It is largely a technical reset after a very crowded and very extended move.
Semiconductors are the clearest example. Nvidia, AMD, Micron, Intel, Marvell, ASML and ARM are all pulling back this morning, and the semiconductor ETF is now at risk of breaking a six week winning streak.
That matters because semiconductors have been the heartbeat of this rally. When the leading group starts cooling, the broader Nasdaq almost always feels it first.
The Trump and Xi summit also disappointed the market. Traders were clearly looking for a more meaningful policy breakthrough, especially around technology, trade and China access, but the headlines that came out of the meeting were underwhelming.
The market did get some positive headlines, including China agreeing to buy U.S. crude and both sides agreeing that the Strait of Hormuz must remain open, but that was not enough to keep the tech trade pushing higher.
Oil is also moving higher again, with WTI around $104 and Brent around $108, which keeps the inflation problem alive.
This is still one of the most important macro variables. If oil remains elevated, it keeps pressure on inflation, transport costs, consumer spending and Fed policy.
That is why the market is in a tricky place. Earnings and AI capex are still strong, but inflation pressure is not going away.
Yesterday, the Dow reclaimed 50,000 and the S&P 500 closed above 7,500 for the first time, but the rally was still very top heavy.
The problem is not that the market is weak. The problem is that the strongest part of the market has become extremely crowded.
This is exactly what Bank of America’s Michael Hartnett is warning about. The market has seen heavy investor crowding into equities and technology, while inflation risk is rising at the same time.
The AI trade remains the dominant force, but when everyone is leaning into the same theme after a huge move, the market becomes vulnerable to profit taking.
The Guardian piece also captures the broader backdrop well. The market has been incredibly resilient despite war, inflation, tariffs, oil pressure and poor consumer confidence because AI spending has acted like a massive private sector stimulus program.
That is the bull case. AI capex, chip demand, cloud infrastructure, data centers and mega cap earnings are still powerful enough to keep the market supported.
The risk is that this resilience has made traders complacent.
We are now in a market where the indexes can look strong because a small group of mega cap AI leaders are doing most of the work, while breadth underneath is much less impressive.
That means traders need to be far more selective here.
We would not treat this morning’s weakness as a major trend reversal yet, but we would absolutely treat it as confirmation that chasing extended growth highs is no longer the correct tactic.
The better play is to let the stretched groups reset, watch whether semiconductors defend their rising short term moving averages, and look for cleaner opportunities in groups that are breaking out of fresh bases rather than late stage vertical moves.
Today’s focus should be simple: watch whether tech selling stays controlled, watch whether semiconductors can avoid a high volume breakdown, and watch whether oil moving higher starts to pressure the broader market beyond just the crowded AI trade.
S&P 500
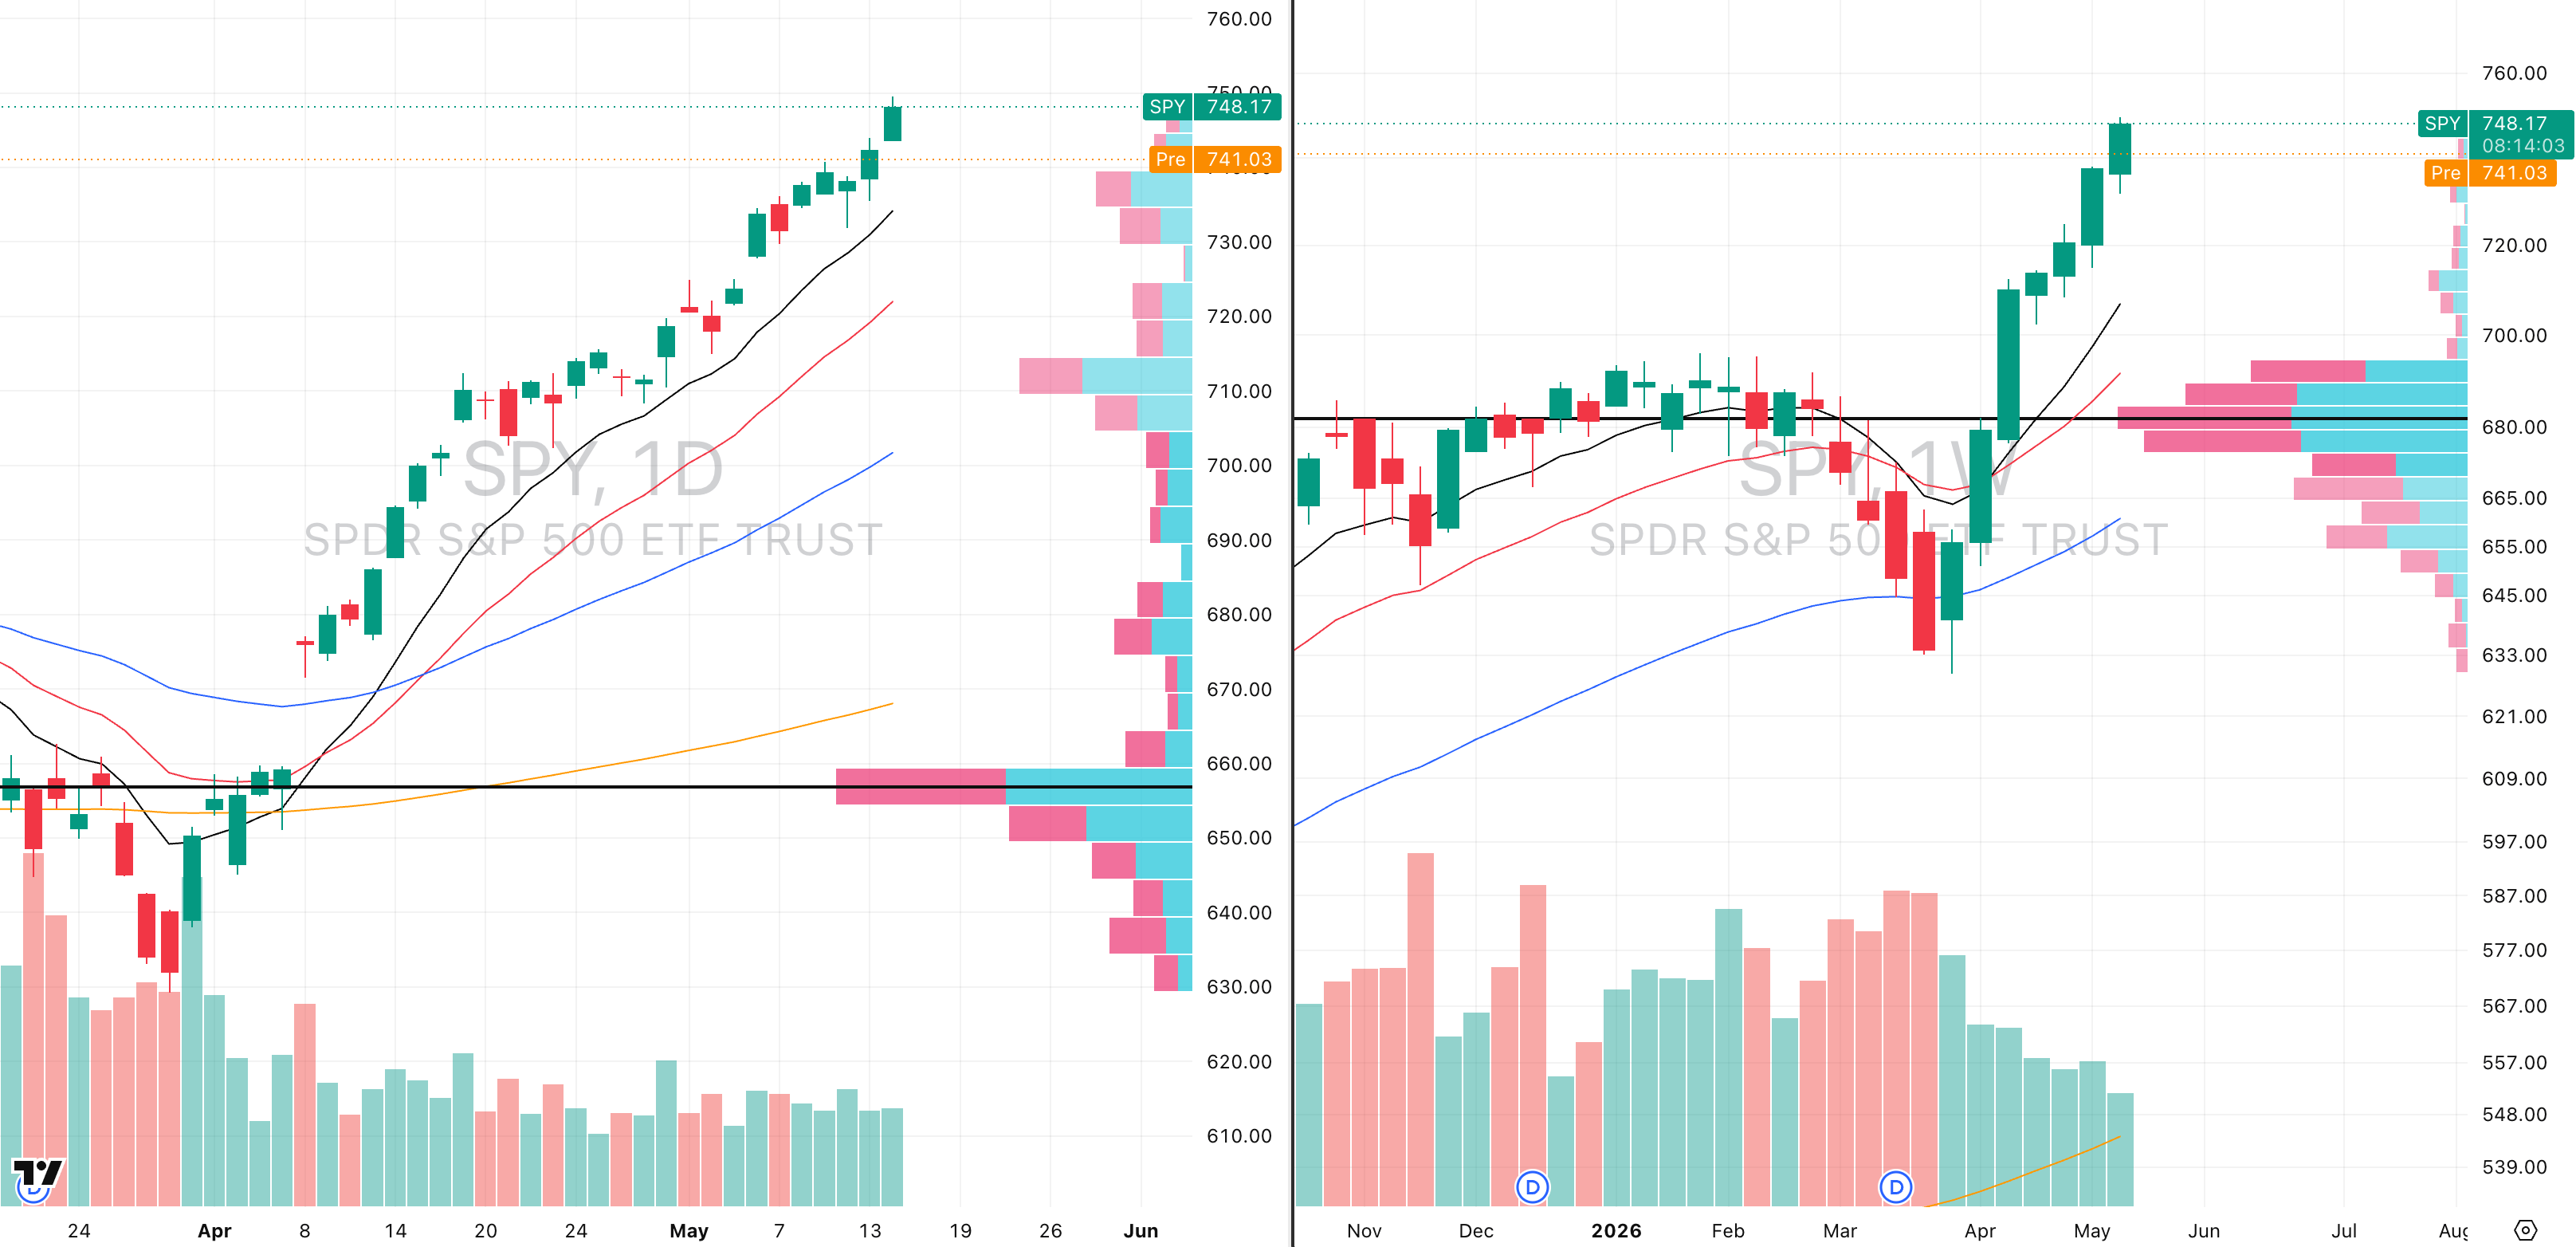
SPY VRVP Daily & Weekly Chart
41.35%: over 20 EMA | 46.52%: over 50 EMA | 53.87%: over 200 EMA
The SPY is still trending higher, but it is now sitting at a very extended level after another strong push over the last two sessions.
Yesterday’s session had roughly a 0.8% average daily range, which was almost exactly in line with the prior session’s ATR expansion, excluding the upper wick.
This morning’s gap down is being blamed on disappointment around the Trump and Xi meeting, where traders expected a more meaningful breakthrough.
The macro headline may explain the timing, but the technical reason is much simpler.
The SPY is now sitting around 8.63 ATR multiples above its 50 day moving average, which is an unsustainable short term extension.
This does not mean the market is suddenly weak.
A high ATR multiple extension usually tells us the market is extremely strong, but it also tells us the risk reward for fresh long entries is poor.
The best trade at this stage is not chasing upside. It is either waiting for a pullback long setup or looking for mean reversion shorts in the most extended areas.
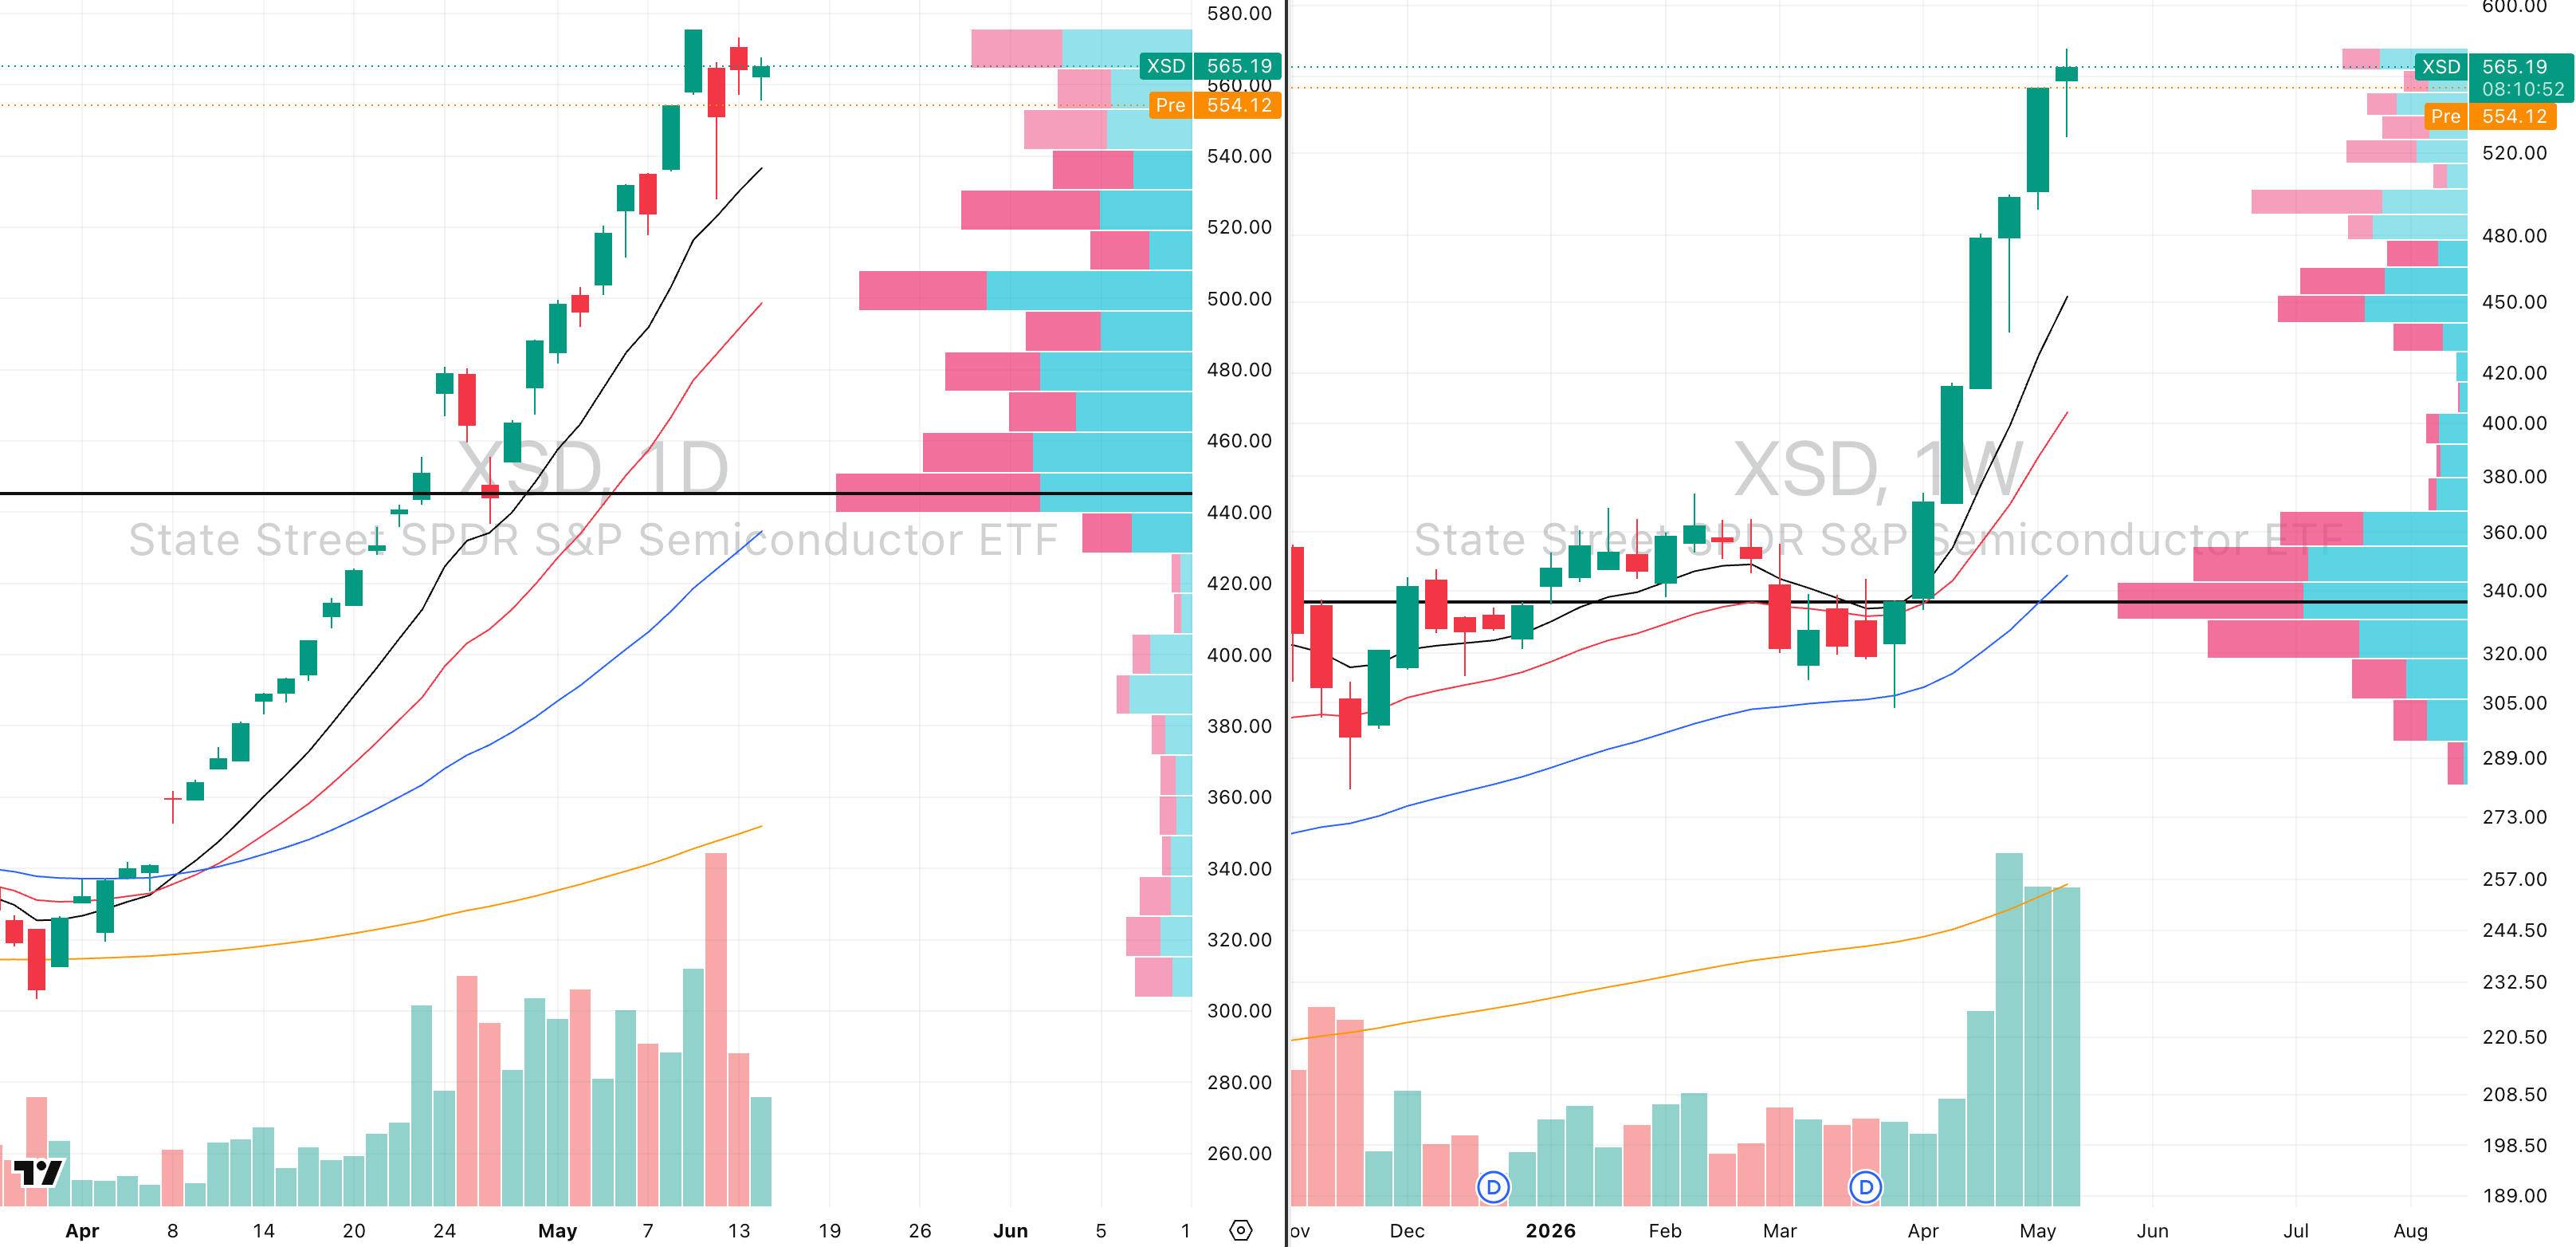
XSD VRVP Daily & Weekly Chart
Semiconductors remain the clearest example of that extension.
XSD is now sitting around 12 ATR multiples above its 50 day moving average, which is roughly 40.38% above that level.
That is not sustainable in the short term, and the reversal we are seeing in premarket is exactly the type of move we expected after such an extreme run.
A semiconductor pullback should weigh on the SPY because the index is capitalization weighted and heavily influenced by the Magnificent Seven and the semiconductor complex.
For the SPY, the first downside level we are watching is the rising 10 day EMA at $734.36.
That level also lines up with strong demand on the visible range volume profile, where we have roughly 5M shares traded green versus around 3M shares traded red.
If price pushes lower toward $730, there is also another demand pocket, with roughly 1.28M shares traded green versus around 450,000 shares traded red.
The key point is that a pullback into these levels would be healthy, not bearish.
S&P 400 Midcap
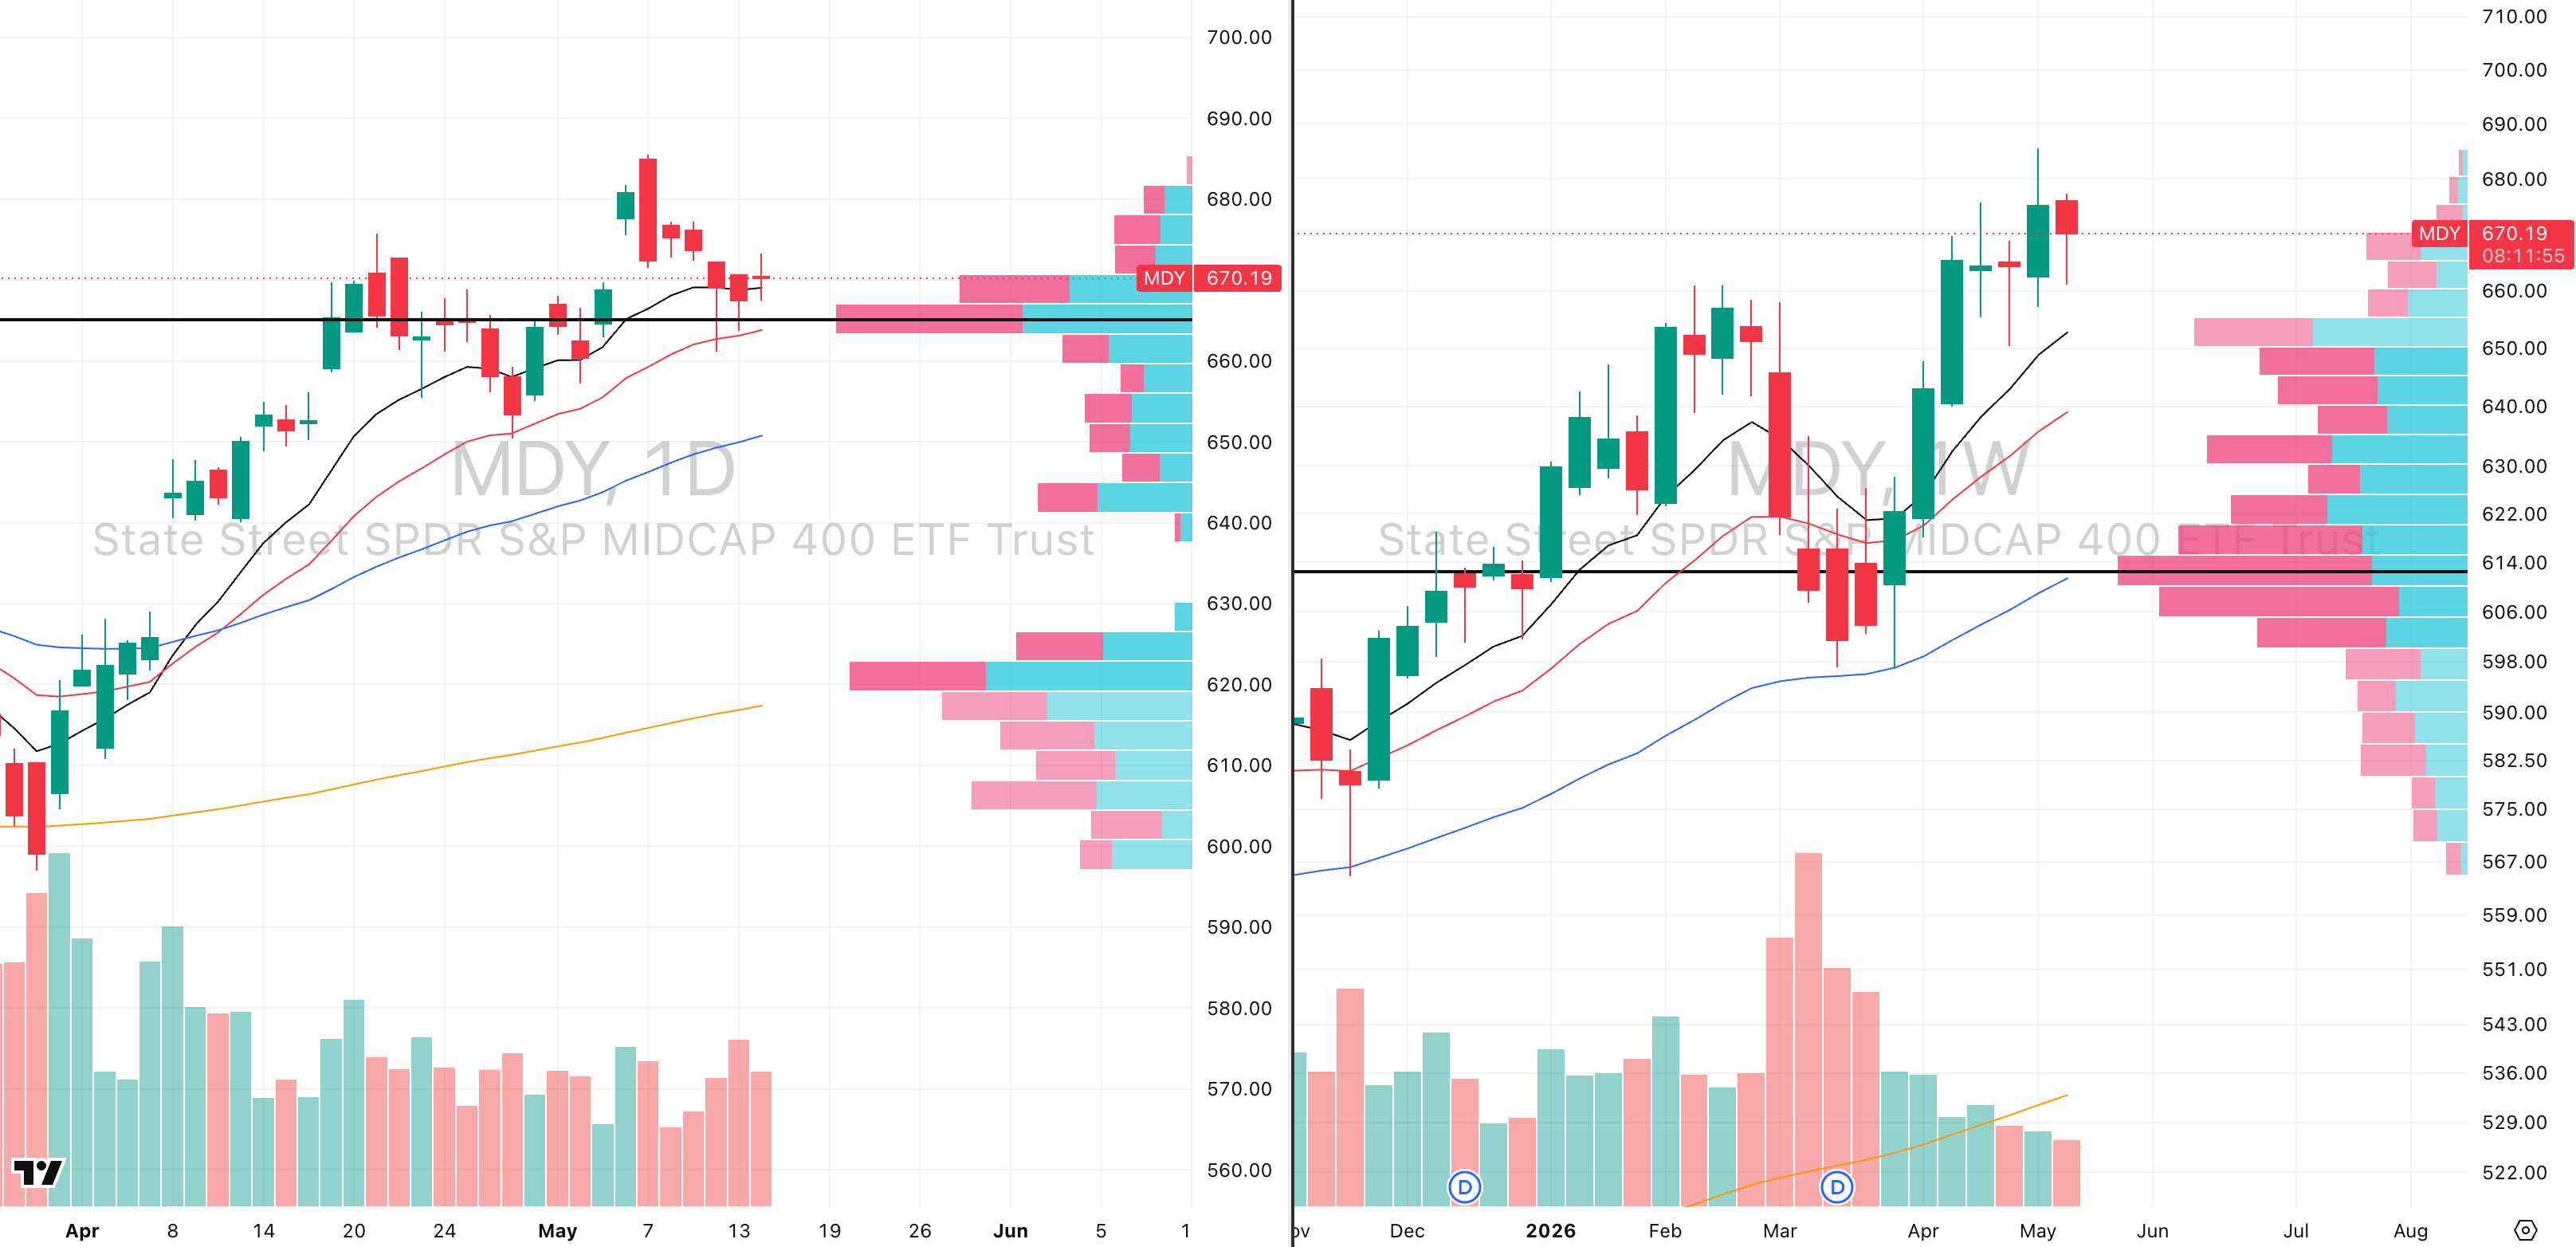
MDY VRVP Daily & Weekly Chart
37.50%: over 20 EMA | 54.00%: over 50 EMA | 54.25%: over 200 EMA
The mid cap complex remains meaningfully weaker than the SPY.
This is expected because the SPY is being held up by mega cap technology, semiconductors and the Magnificent Seven, while the mid caps are giving a cleaner read on broader market health.
MDY has pulled back with expanding relative volume, which is not ideal.
Rising relative volume on a pullback often suggests more short term weakness is likely.
Breadth also confirms that mid caps are the weakest major capitalization group right now.
Only around 37.5% of mid cap stocks are above their 20 day moving average, which shows clear short term deterioration.
The positive point is that the longer term breadth remains much healthier.
Around 54% to 54.25% of mid cap stocks are still holding above their 50 and 200 day moving averages.
That matters because it means the short term trend is weak, but the broader trend has not broken.
Mid caps are now testing their 10 and 20 day moving averages and the daily point of control.
We are also seeing buyers step in when stocks test their longer term moving averages, which is a constructive sign.
This looks more like a short term cooling phase than a major trend reversal.
We do not expect the Trump and Xi meeting disappointment to cause a full repricing of the market.
Technology, semiconductors and Nvidia have been too strong for one underwhelming headline to completely reverse the entire trend.
Russell 2000
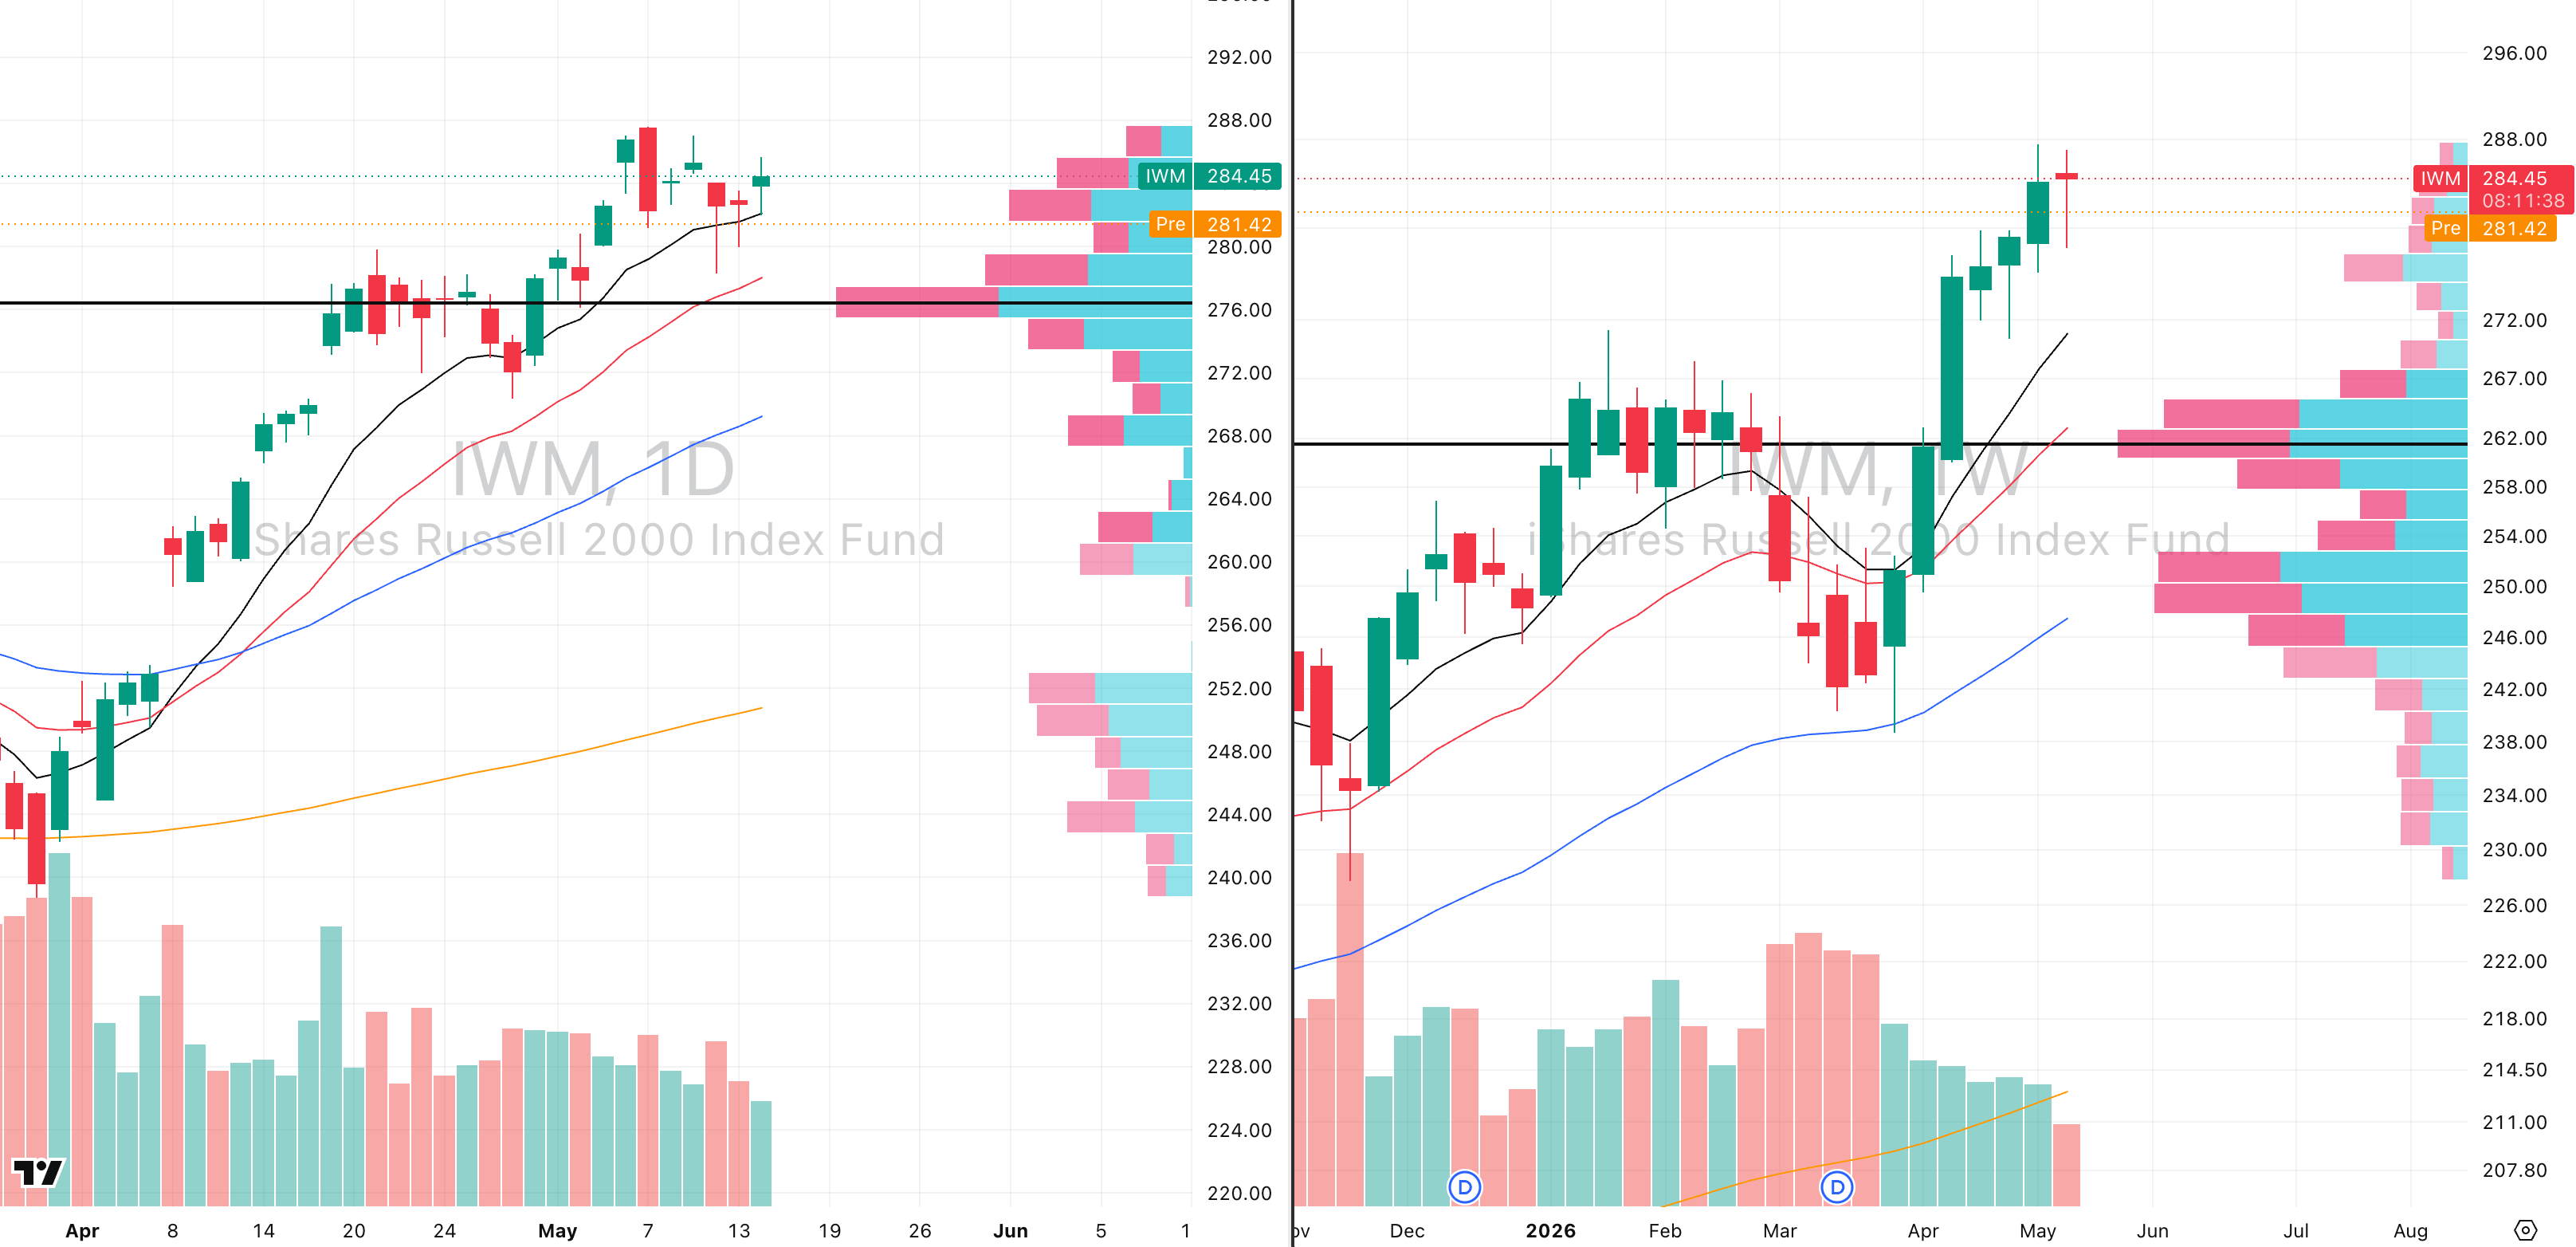
IWM VRVP Daily & Weekly Chart
41.35%: over 20 EMA | 46.52%: over 50 EMA | 53.87%: over 200 EMA
The small caps are still materially stronger than mid caps, but they are also starting to cool off in the short term.
This morning, IWM is breaking below the rising 10 day moving average, which makes the next logical test the 20 day moving average around $277.
That level also lines up with the daily point of control, making it an important demand zone.
A pullback into $277 is not something to be afraid of.
The more important level is around $276, where the visible range volume profile shows the key point of control.
If that area fails to hold, then the next downside target becomes the 10 week moving average near $272.
That would be a deeper pullback, but still not necessarily a major trend break.
The short term trend is weakening, but the intermediate trend remains bullish while price is above the rising 10 and 20 week moving averages.
This is why we need to separate daily weakness from real trend damage.
A weak daily candle does not automatically mean the primary or intermediate trend has reversed.
FOCUSED GROUP
XLE: Oil, Energy & A Rising VIX
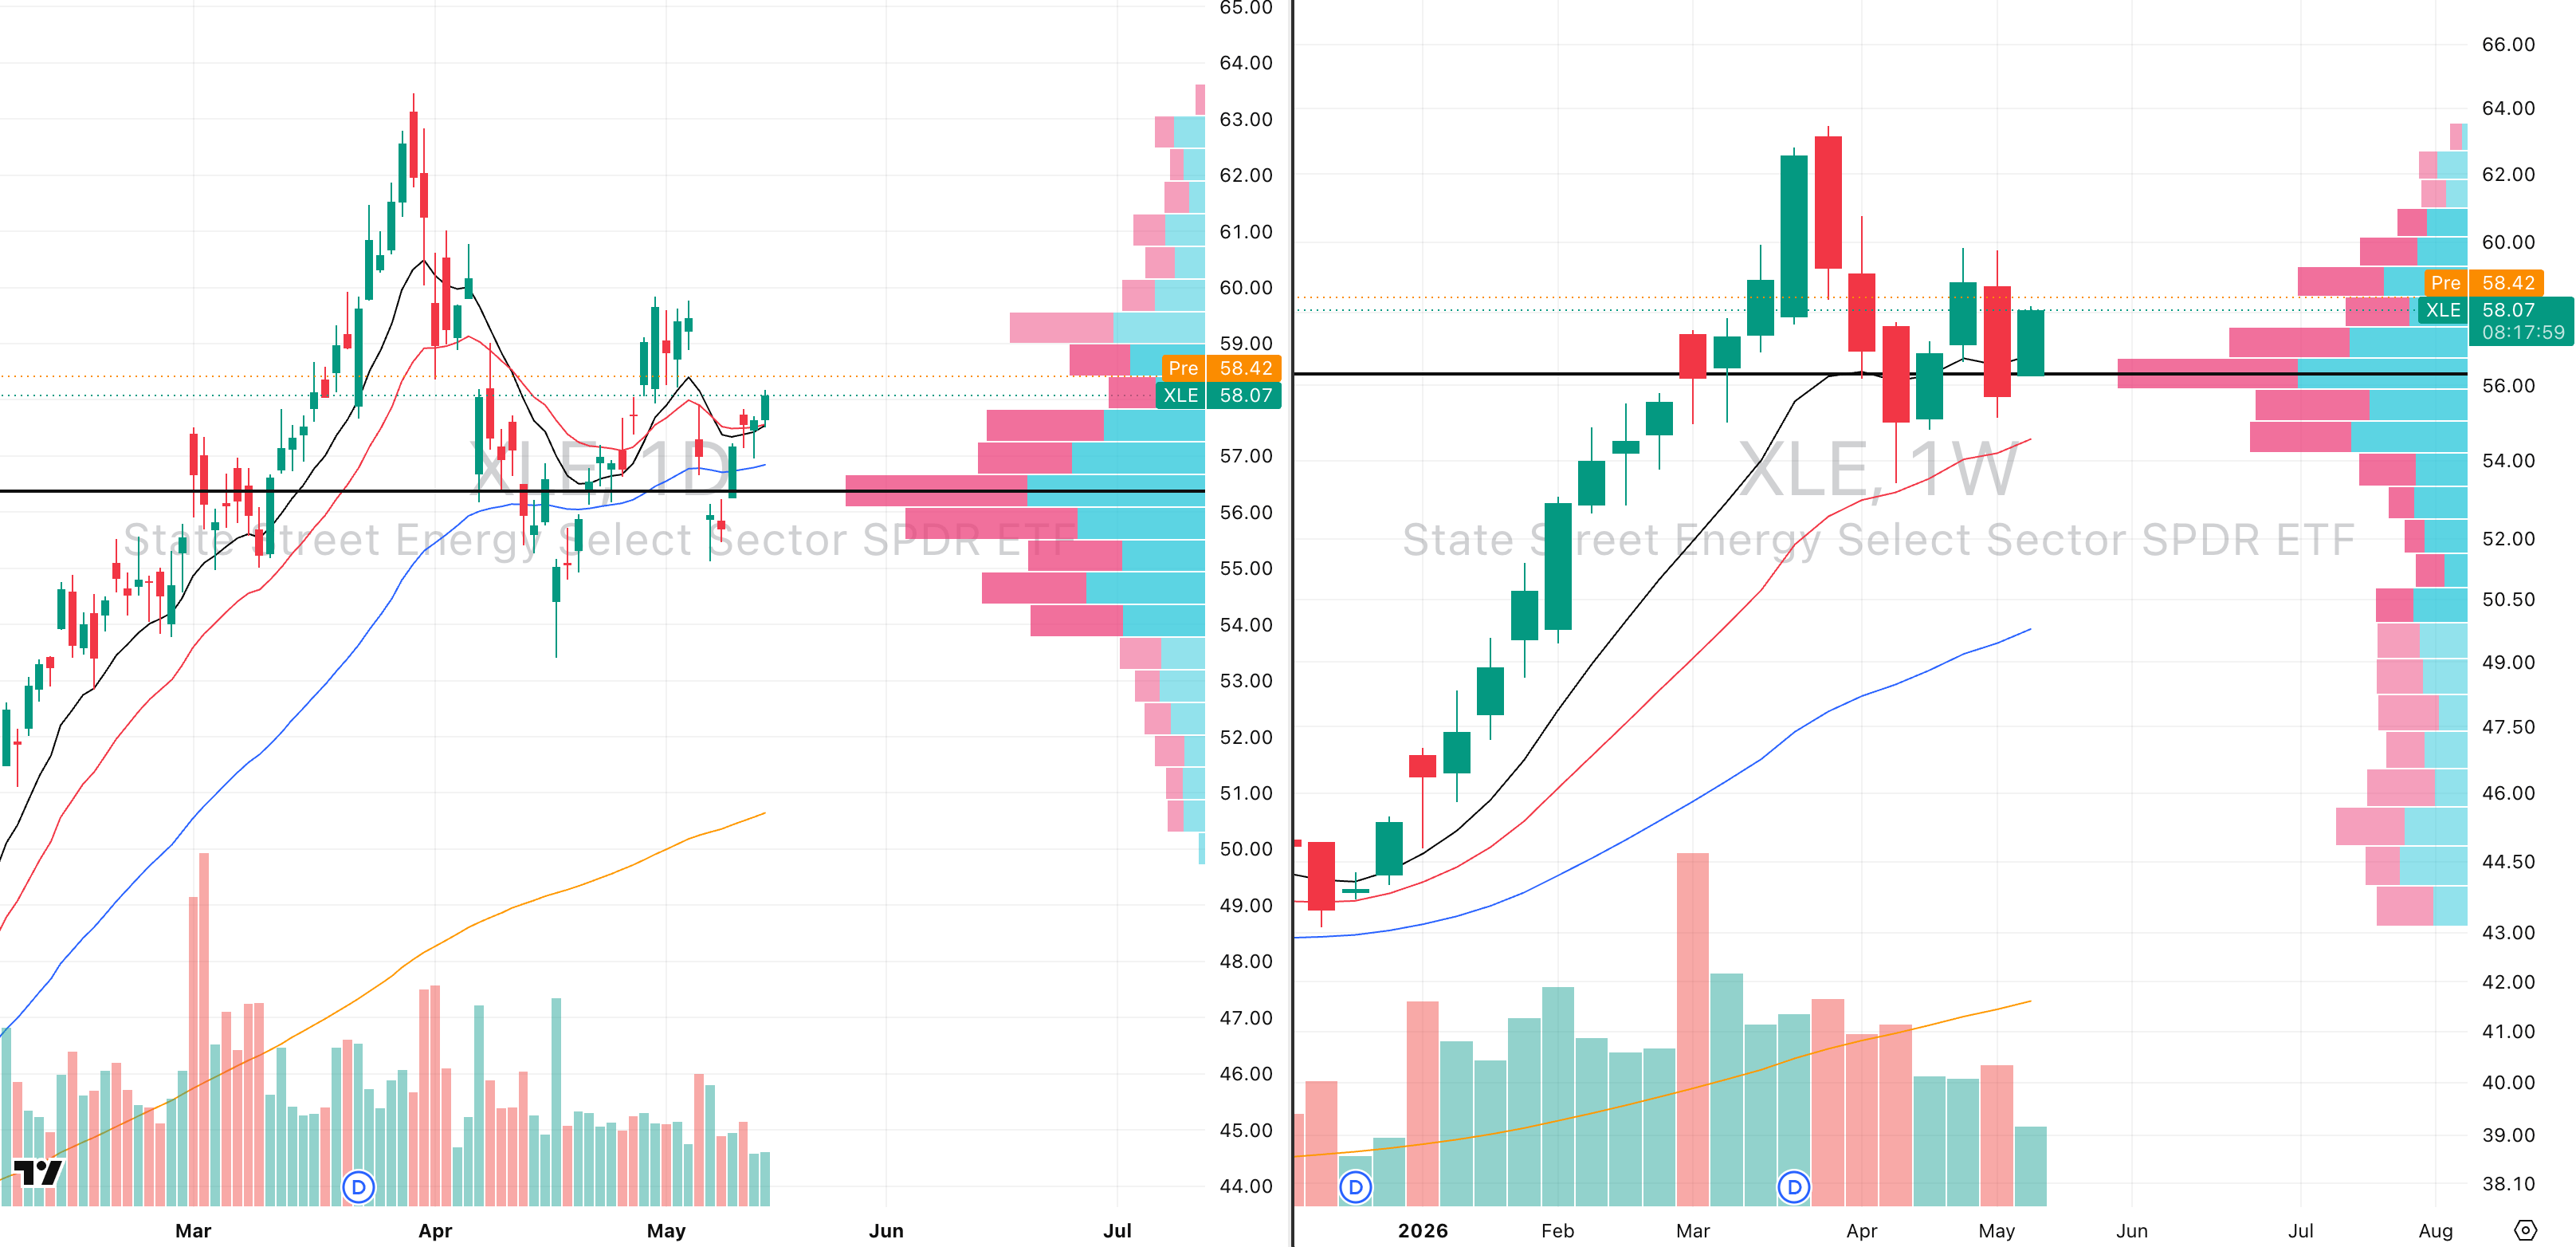
XLE VRVP Daily & Weekly Chart
With equities cooling and oil pushing higher again, our focus group today is energy.
We are specifically watching XES, which is oil and gas equipment and services, and XOP, which is oil and gas exploration and production.
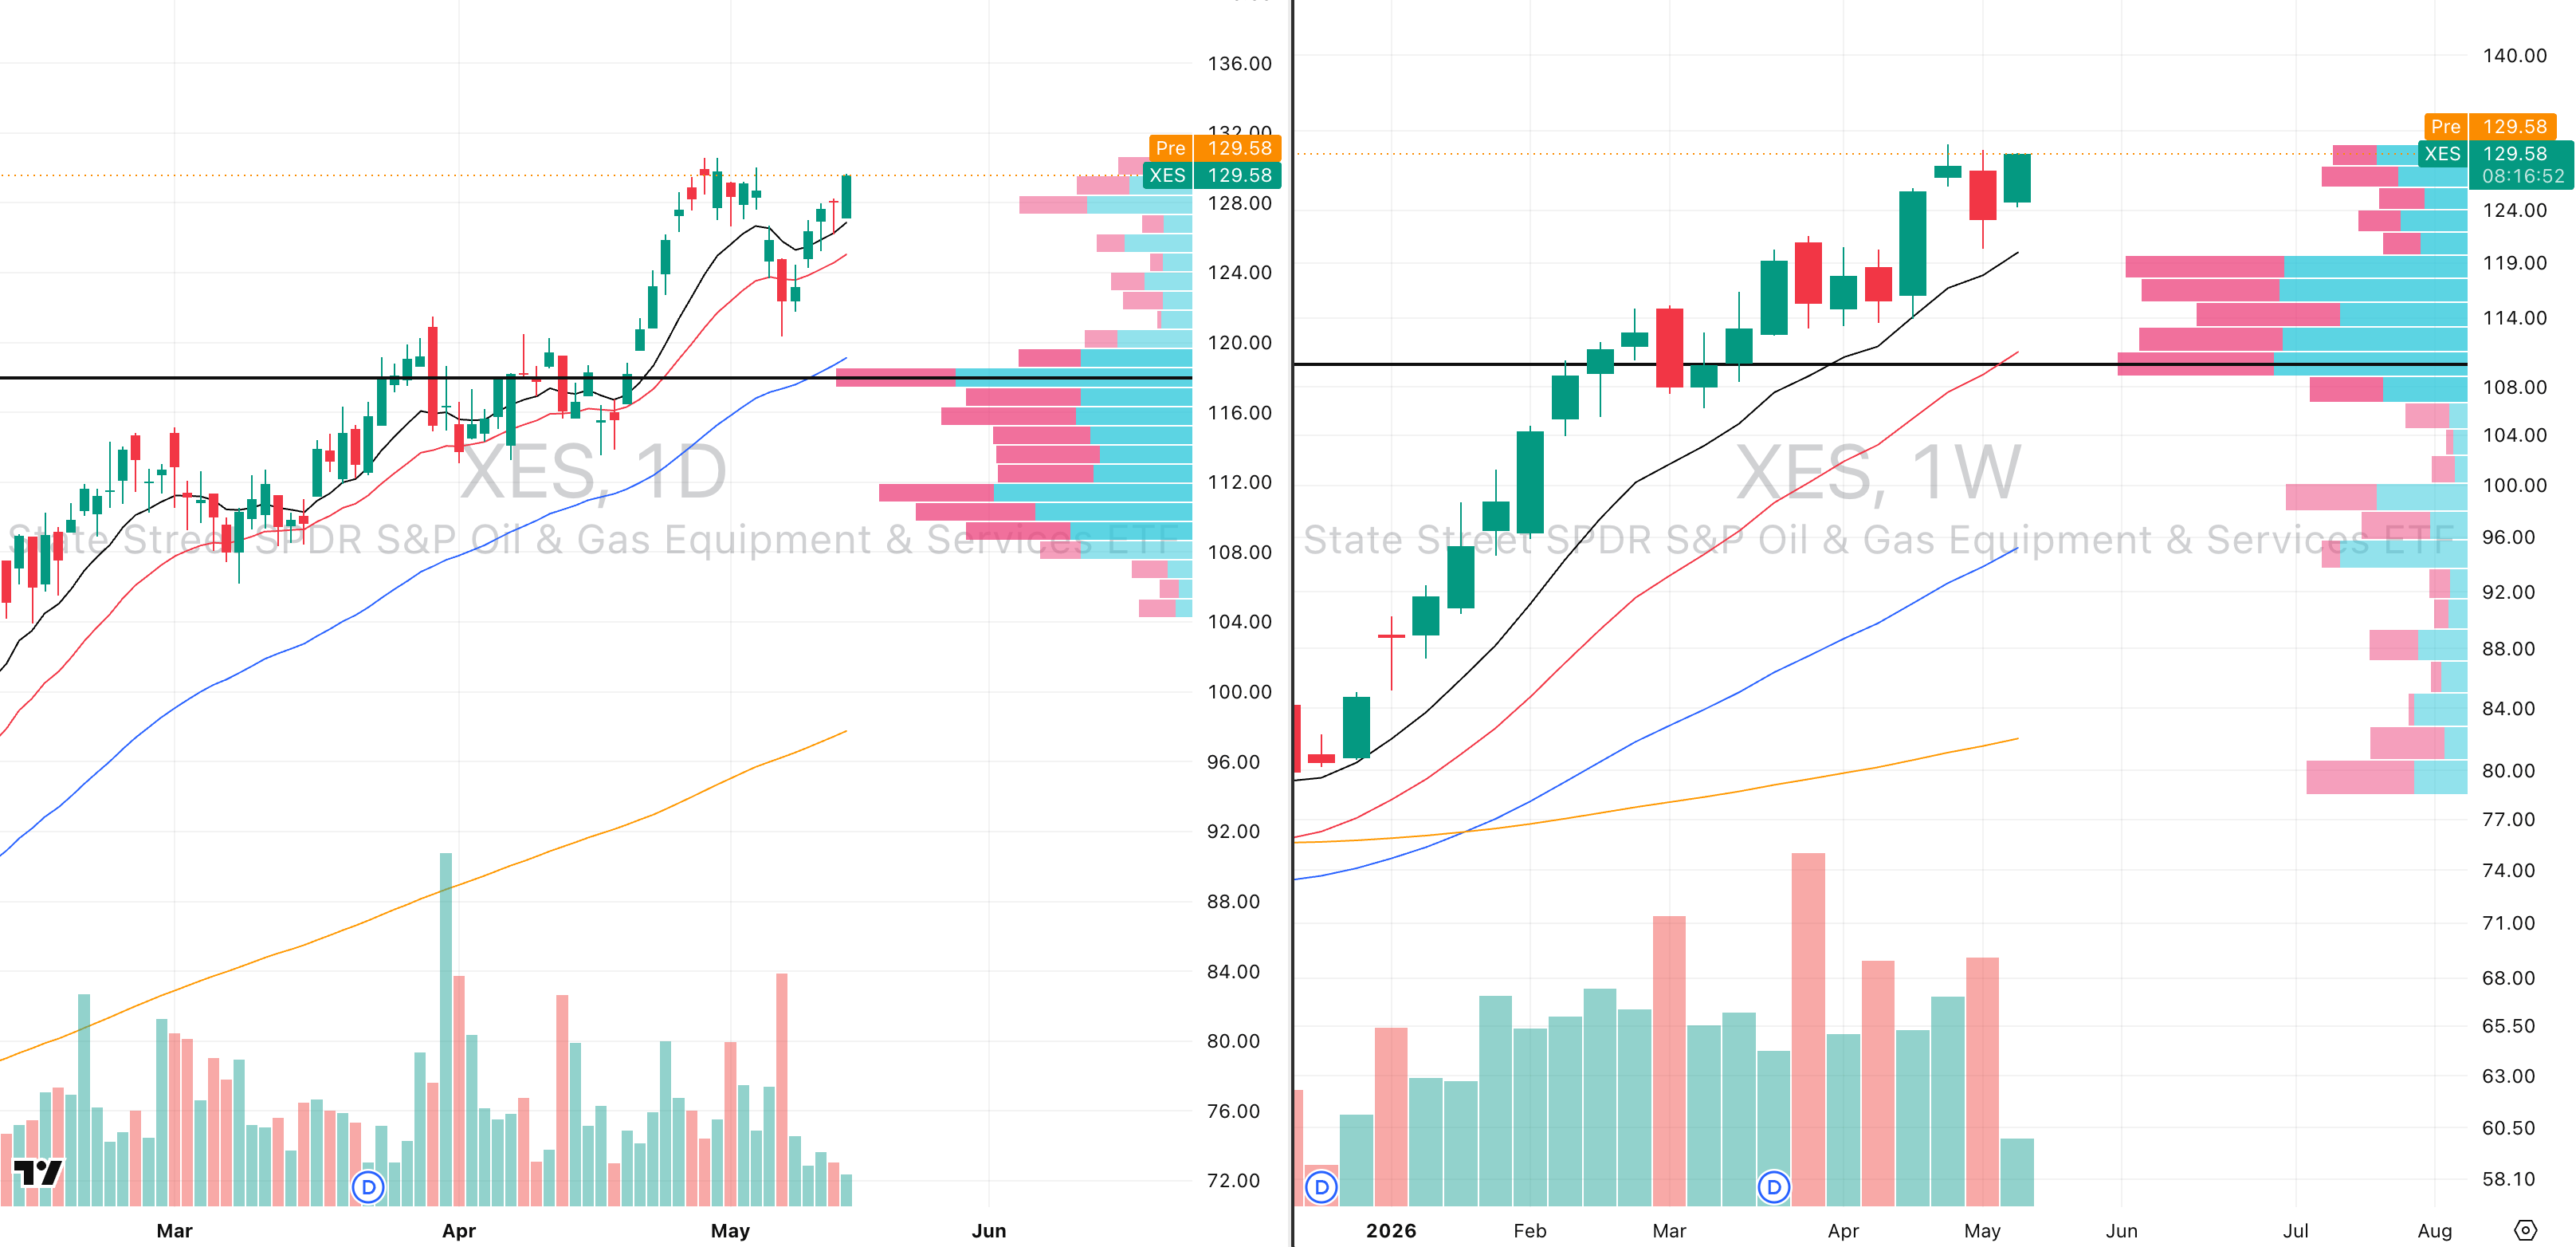
XES VRVP Daily & Weekly Chart
XES is one of the strongest groups in the entire market right now.
It broke out strongly yesterday and has a 91 relative strength rating versus the SPX.
The trend quality is also excellent as XES has not had a single weekly session break below the 10 week moving average for roughly 210 days, going back to October 2025.
That is extremely impressive price action and tells us institutions are continuing to support the group.
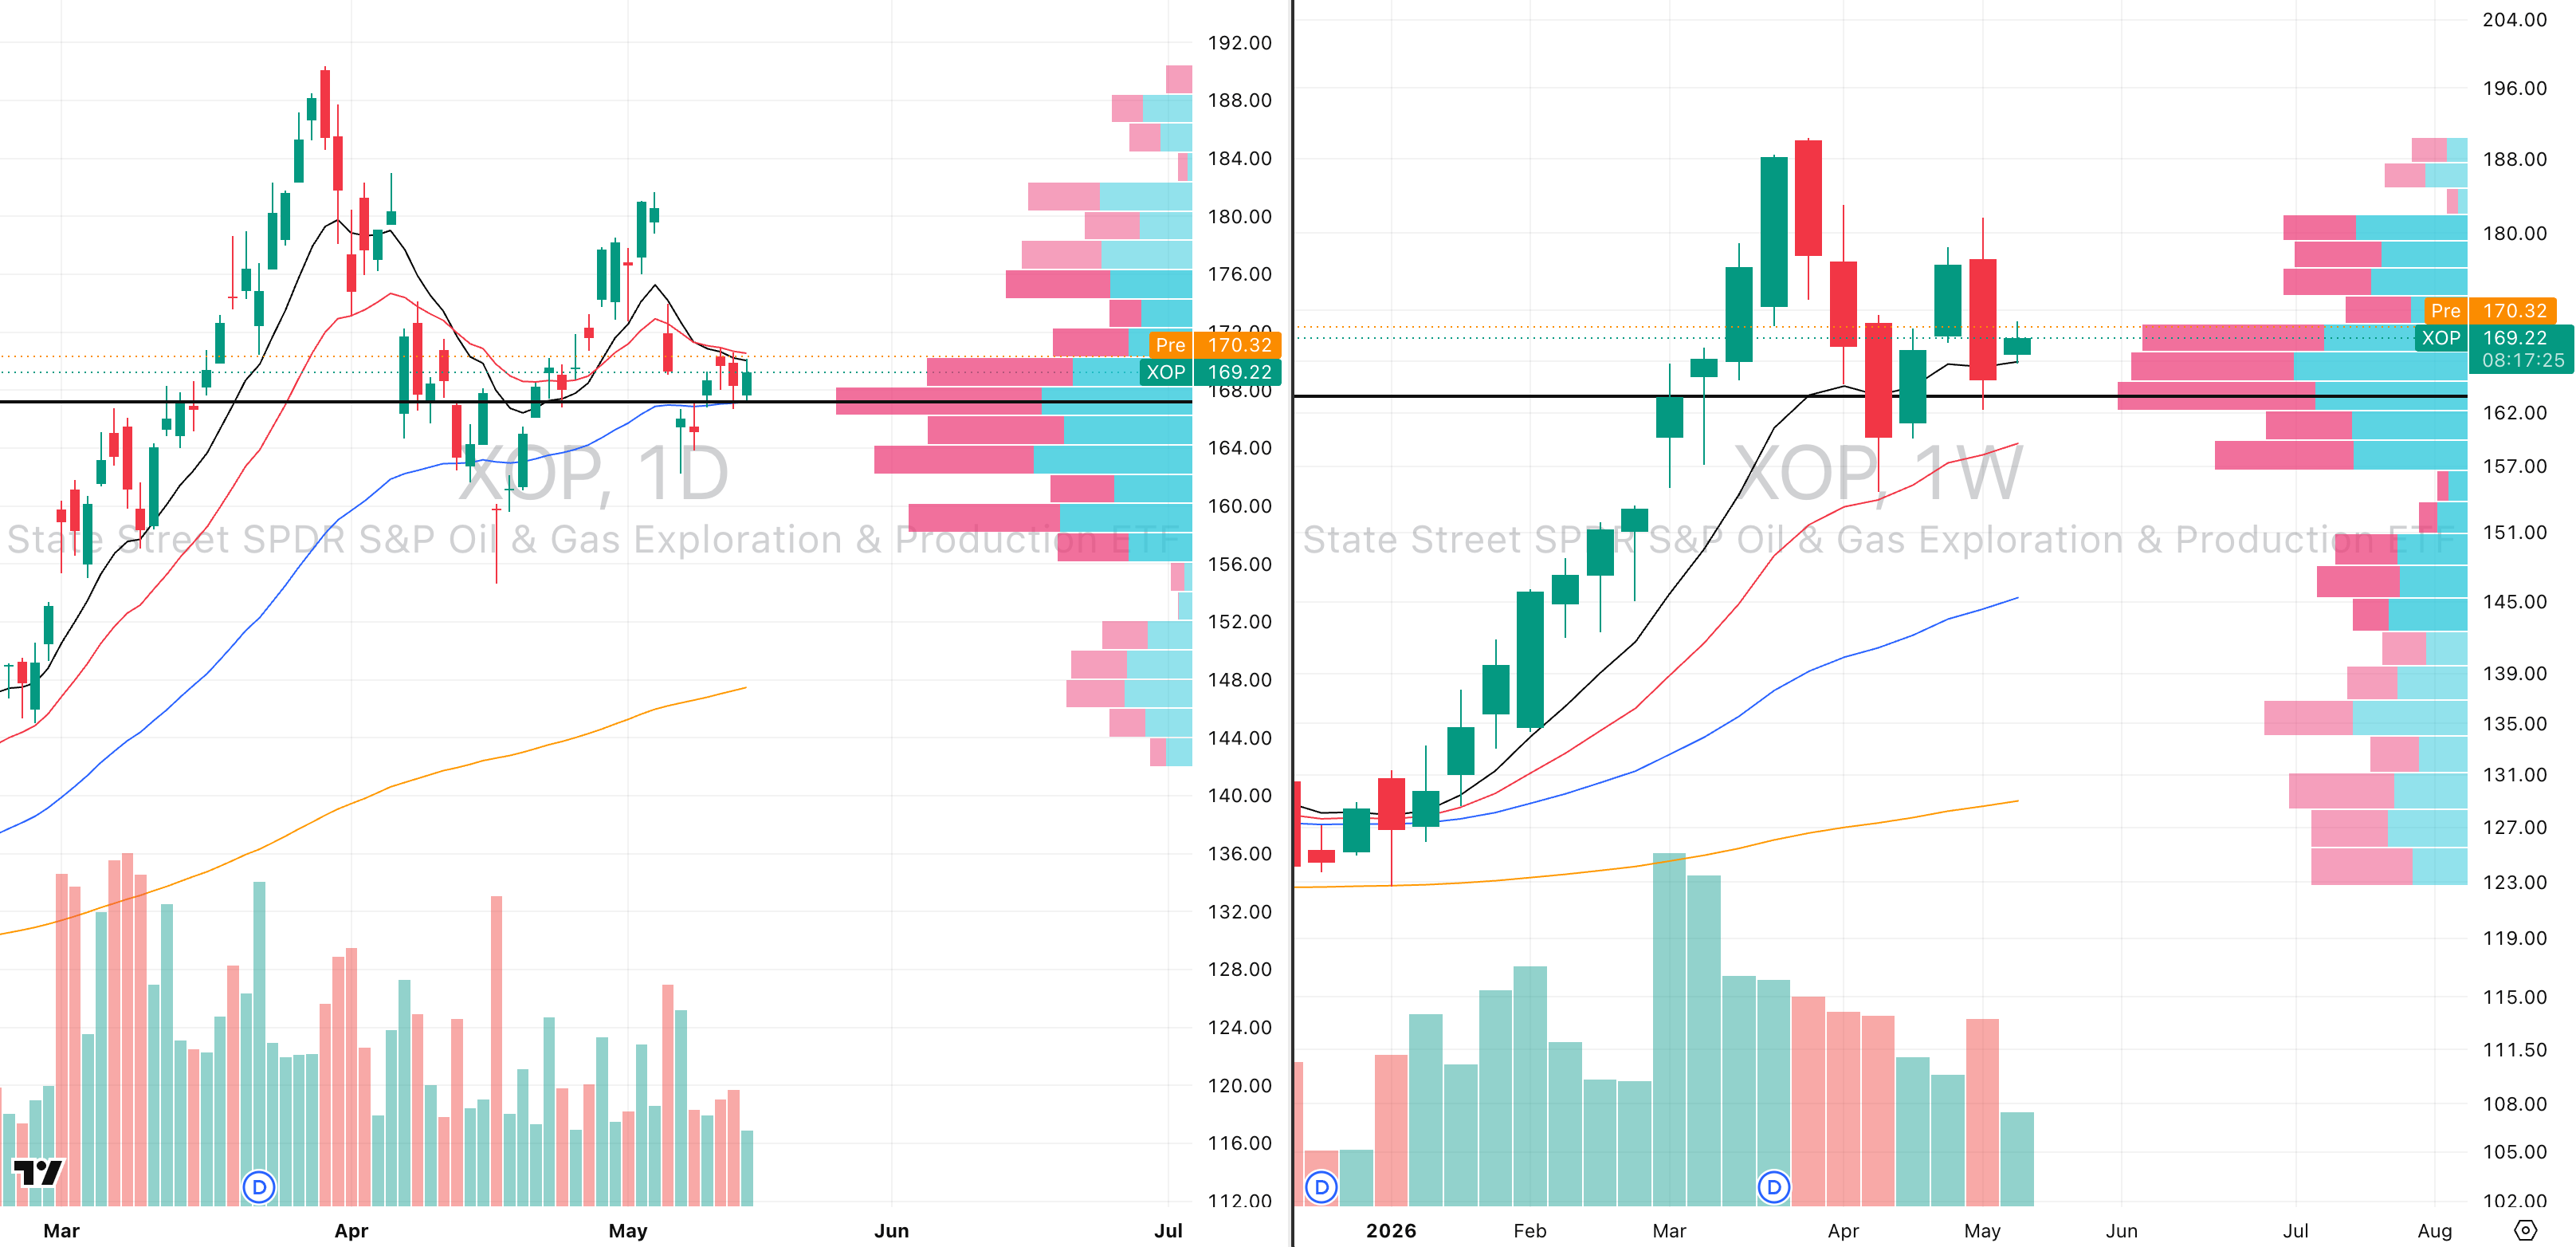
XOP VRVP Daily & Weekly Chart
XOP is also important because it broke out at the beginning of January 2026 on expanding relative volume and has now pulled back toward its rising 10 week moving average.
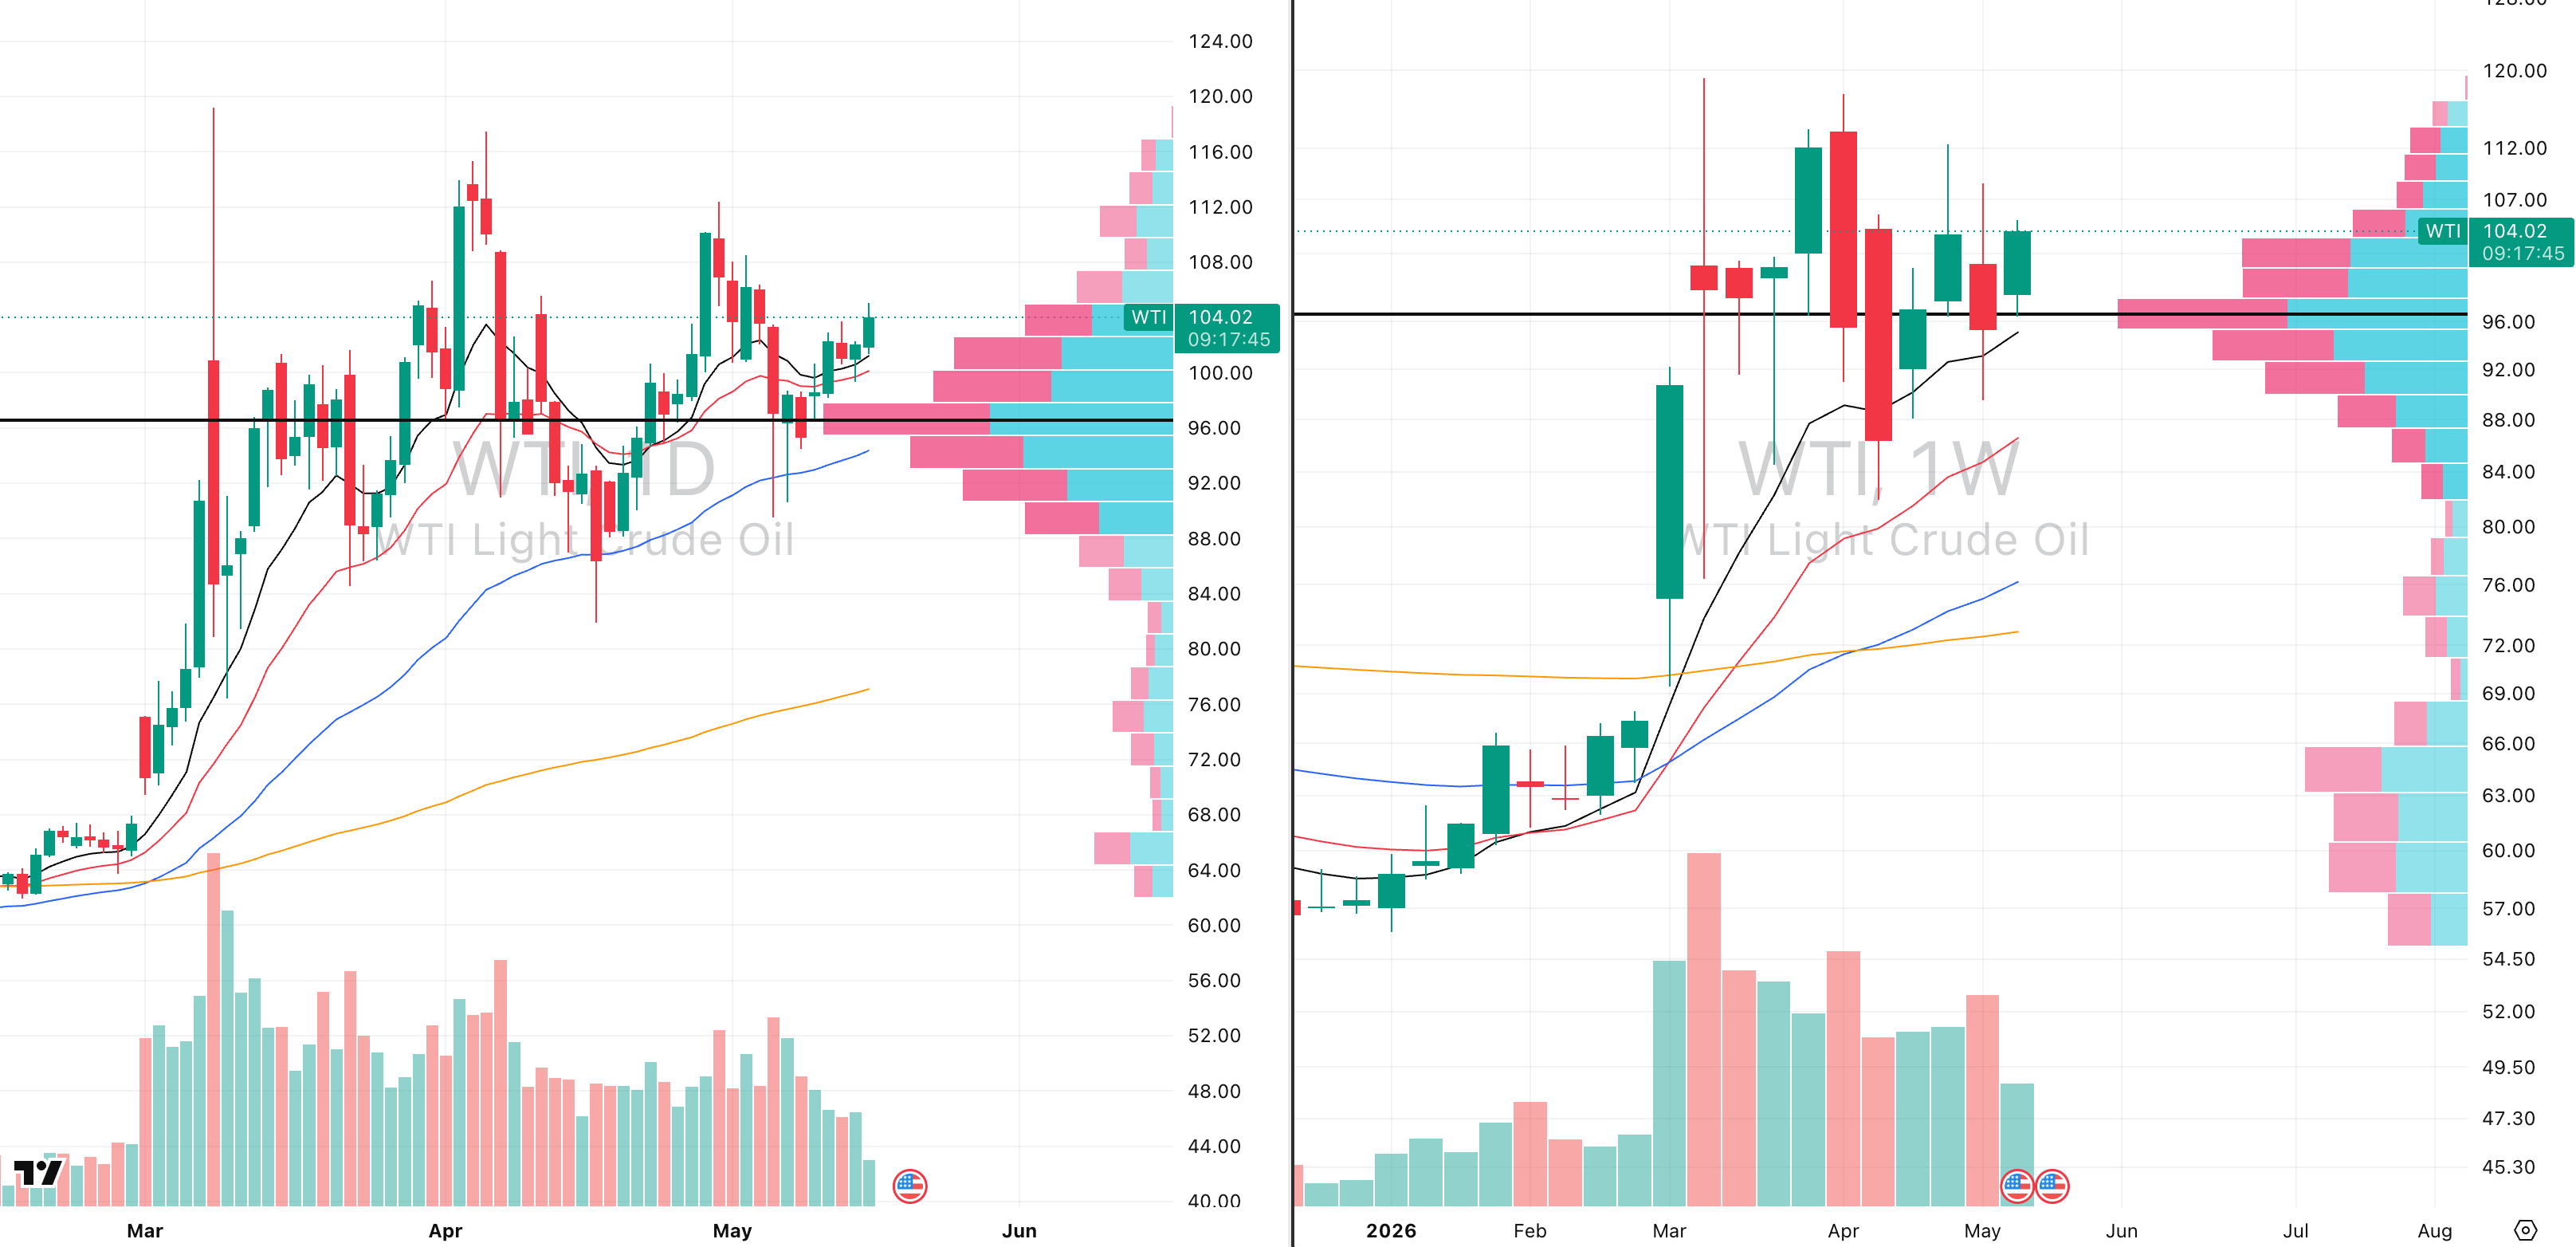
WTI VRVP Daily & Weekly Chart
That matters because WTI crude oil is also pulling back into its 10 week moving average, creating alignment between crude, XOP and the broader energy complex.
This is where rotation becomes important a growth stocks are extremely extended and need to cool off before long side asymmetry improves again.
That money does not disappear, instead it usually rotates and right now, energy looks like one of the more logical destinations for that rotation.
We would be tracking WTI, XLE, XOP and XES closely from here and if crude oil begins expanding out of its weekly contraction, the strongest stocks inside XOP and XES should follow.

Did you find value in today's publication?This helps us better design our content for our readers |
Reply