- Swingly
- Posts
- Today Will Be Volatile: How To Handle It
Today Will Be Volatile: How To Handle It
In partnership with

MARKET ANALYSIS
Here’s What You Need To Know
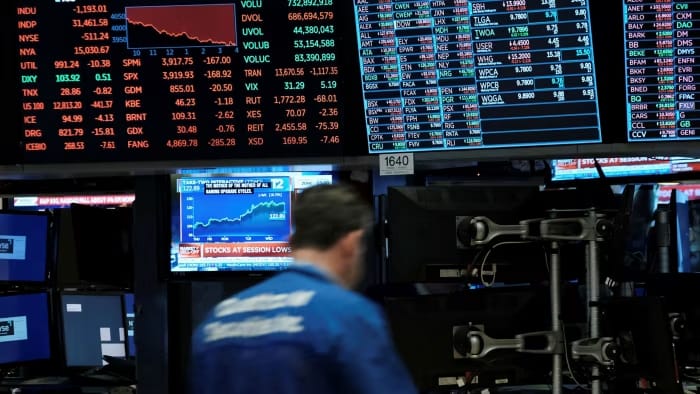
Futures unchanged into the decision. Index futures across Dow, S&P 500, and Nasdaq are essentially flat. This is expected pre-FOMC compression with a 90%-priced cut already embedded in curves. No pre-event de-risking.
Fed expected to cut 25bp for a third consecutive meeting. The cut is not the catalyst. The tone, dots, and Powell’s stance on 2026 policy are the event. Market cares about trajectory, not today’s move.
FOMC remains divided beneath the surface. Some members want additional easing to support labor data; others fear cutting too aggressively re-anchors inflation. This internal split increases the importance of communication risk.
Recent equity tape reflects stalling, not stress. S&P 500 and Dow closed slightly red yesterday; Nasdaq marginally green. All three held structure despite low relative volume. No evidence of supply expansion.
S&P 500 sits 0.7% below its record. Last rate cut (Oct 29) triggered a “hawkish-cut” reaction and a short correction. Markets have since recovered into the December meeting. This memory matters.
Breadth continues to widen beneath headline indices. Rate-sensitive groups are responding cleanly to easing expectations. This rotation is a core bull-market characteristic.
Structural case for continued small-cap participation improves. Wells Fargo notes the widening breadth aligns with expectations of 2026 acceleration tied to tax refunds, deregulation, continued Fed easing, and tech capex expansion.
Labor data this morning supports the easing path. Employment Cost Index rose only 0.8%—below estimates and tied for the lowest gain since Q3 2020. Annual wages now 3.5% YoY. Wage-driven inflation pressure remains soft.
Fed chair selection noise continues but has no immediate market impact. Trump restarts final interviews for Fed chair candidates (Warsh, Hassett). Markets expect Hassett, but survey respondents prefer Waller. For today’s meeting, this is irrelevant but important for 2026–27 macro regime shaping.
No signs of stress in credit or industrial leadership. Oracle’s AI-infra debt load remains a concern for credit desks, but equity markets are not pricing systemic risk. Tech capex remains a tailwind.
Nasdaq, mid-caps, and small-caps are all moving in sync, which signals broad market participation rather than isolated strength.
Volume across indices continues to contract rather than expand, reflecting hesitation rather than distribution.
This alignment across market caps adds confidence that current price action represents digestion, not deterioration.
Until proven otherwise by the close, the market remains in a controlled, constructive pause rather than a breakdown.
Nasdaq

QQQ VRVP Daily & Weekly Chart
62.37%: over 20 EMA | 50.49%: over 50 EMA | 56.43%: over 200 EMA
The Nasdaq had a very low-participation session yesterday, which was largely expected ahead of today’s FOMC decision. Price continues to stall at the 625 supply area, with repeated attempts to push higher failing to stick.
The pullback itself was not concerning. Volume came in at roughly 64% of the 20-day average, which tells us sellers were not aggressive. This was more a function of inactivity than distribution.
Buyers continue to step in on weakness, particularly since Dec 2, as price has remained above the rising 10-day EMA around 620. That behavior is important and remains intact for now.
Despite sitting directly beneath supply, the Nasdaq has not lost short-term trend support and has not seen expanding volume to the downside. Given the proximity to a major macro event, that stability is notable.
On the weekly chart, structure remains healthy. Price is still above rising weekly moving averages, and there is no evidence yet that higher-timeframe participants are exiting positions.
The main risk is not what has already happened, but what could happen if today goes wrong. If the market fails to hold the 10-day and selling accelerates, there is a clear lack of meaningful support until the ~611 area, as shown on the visible range volume profile.
That move would not require panic selling. It would simply reflect a thin area of prior participation, which could allow price to move lower faster than expected.
This is why today is not about intraday action. It is about how the market closes after the Fed decision and Powell’s remarks.
A volatile session that ultimately closes back above 620 would reinforce the idea that buyers remain in control. A rejection that closes below short-term trend support would materially change the near-term risk picture.
As things stand, the Nasdaq is holding up well given where it is, but that does not justify taking new risk ahead of policy clarity.
S&P 400 Midcap

MDY VRVP Daily & Weekly Chart
60.09%: over 20 EMA | 52.61%: over 50 EMA | 57.35%: over 200 EMA
Mid-caps had a broadly similar session to the Nasdaq, but the rejection from supply was notably stronger.
Price rejected cleanly from the 609 supply zone, printing a clear gravestone-style candle on just under 100% relative volume.
Despite that rejection, MDY remains above the rising 10-day EMA, which keeps the short-term structure intact.
There is a realistic probability of an undercut toward the 600 level, which aligns with a well-defined demand shelf.
This 600 zone has acted as support repeatedly since the breakout on November 25, with roughly five successful tests.
It is also a psychological level, so any dip into that area should be expected rather than feared, especially around FOMC.
Since late November, MDY has continued to print higher lows, which is a constructive characteristic during consolidation.
Importantly, sell-side pressure at supply has not been aggressive, and downside volume has remained contained.
The sharpest volume expansion occurred during the November 20–21 capitulation lows, followed by steady drift and digestion higher.
Overall, mid-caps are pausing rather than failing, and this remains a healthy consolidation as long as demand continues to absorb pullbacks.
Russell 2000
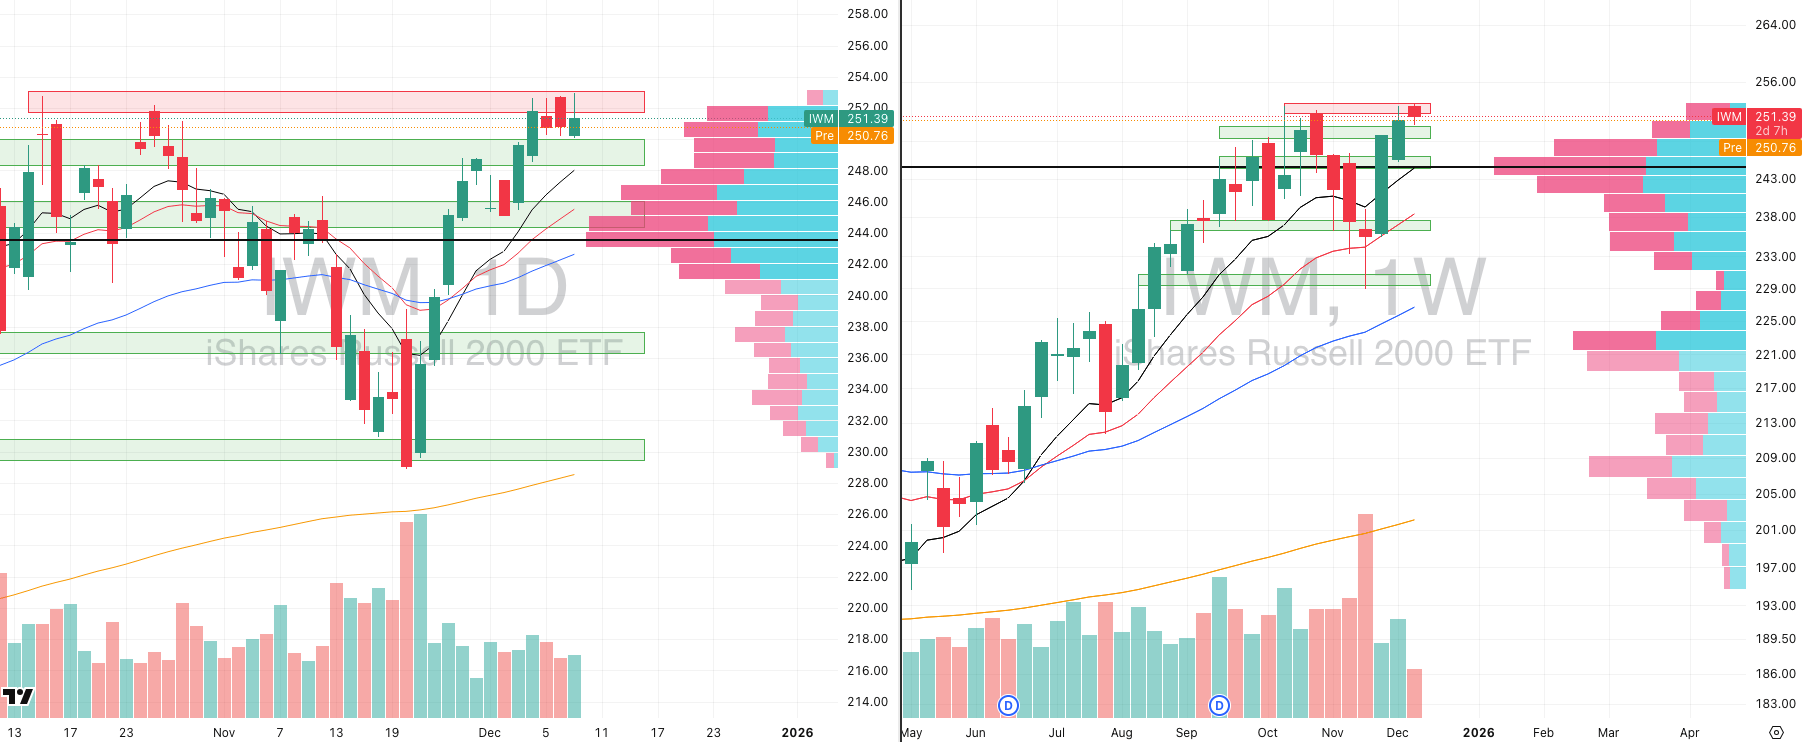
IWM VRVP Daily & Weekly Chart
72.97%: over 20 EMA | 59.13%: over 50 EMA | 62.06%: over 200 EMA
Yesterday’s session printed around 73% of the 20-day average volume, reinforcing that sellers are not pressing.
IWM has now held above the 250 demand level for three consecutive sessions, which is an important behavioral signal.
Supply continues to appear around the 252–253 zone, but that supply is being absorbed rather than causing displacement lower.
Price action is tightening, with higher lows forming beneath resistance, creating a clearly defined ascending structure.
A pullback of around 1% toward the rising 10-day EMA would be entirely normal ahead of the FOMC decision.
The 247 area stands out as the next meaningful zone where demand would be expected to step in if tested.
Structurally, there is substantial support beneath price, and the trend remains well-defined on the weekly timeframe.
Intraday price action today should largely be ignored, as volatility will be driven by event risk rather than positioning.
The most important information will come from the close, particularly during the final 90 minutes of trading around Powell’s press conference.
What Happens When $4.7T in Real Estate Debt Comes Due?

A wave of properties hit the market for up to 40% less than recent values. AARE is buying these income-producing buildings at a discount for its new REIT, which plans to pay at least 90% of its income to investors. And you can be one of them.
This is a paid advertisement for AARE Regulation CF offering. Please read the offering circular at https://invest.aare.com/
FOCUSED STOCK
QBTS: The Fast Movers Getting Tight

QBTS VRVP Daily & Weekly Chart
ADR%: 10.02% | Off 52-week high: -39.4% | Above 52-week low: +663.6%
QBTS has been one of the strongest names in the quantum computing space, and it earned focus after the structure that developed into early December.
We highlighted QBTS on December 2nd following the morning star formation between November 20th and 24th, which marked a clear shift in character after sustained downside pressure.
After that base was set, the stock tightened just below its 10-day EMA and then broke out decisively above 23, doing so on expanding relative volume.
That breakout pushed QBTS above its 10-week EMA and, importantly, above every major daily and weekly moving average, confirming a meaningful trend transition rather than a short-term bounce.
Since last Friday, the stock has entered a three-day range contraction, with volatility compressing and volume steadily declining, which is exactly what you want to see after a strong expansion move.
Price is continuing to hold higher lows and remain tight just below current levels, which visually resembles a short handle forming after the initial push higher.
From a structure perspective, the most important detail is the lack of nearby volume resistance above the current zone. Above roughly 29, there is a noticeable gap in traded volume that extends toward the low-to-mid 30s, implying that any momentum expansion could travel quickly.
Seeing this kind of compression and strength into an FOMC decision—especially in a highly speculative stock and sector—adds weight to the idea that risk appetite remains present beneath the surface.
FOCUSED GROUP
URA: Why Uranium Will Rally With Growth
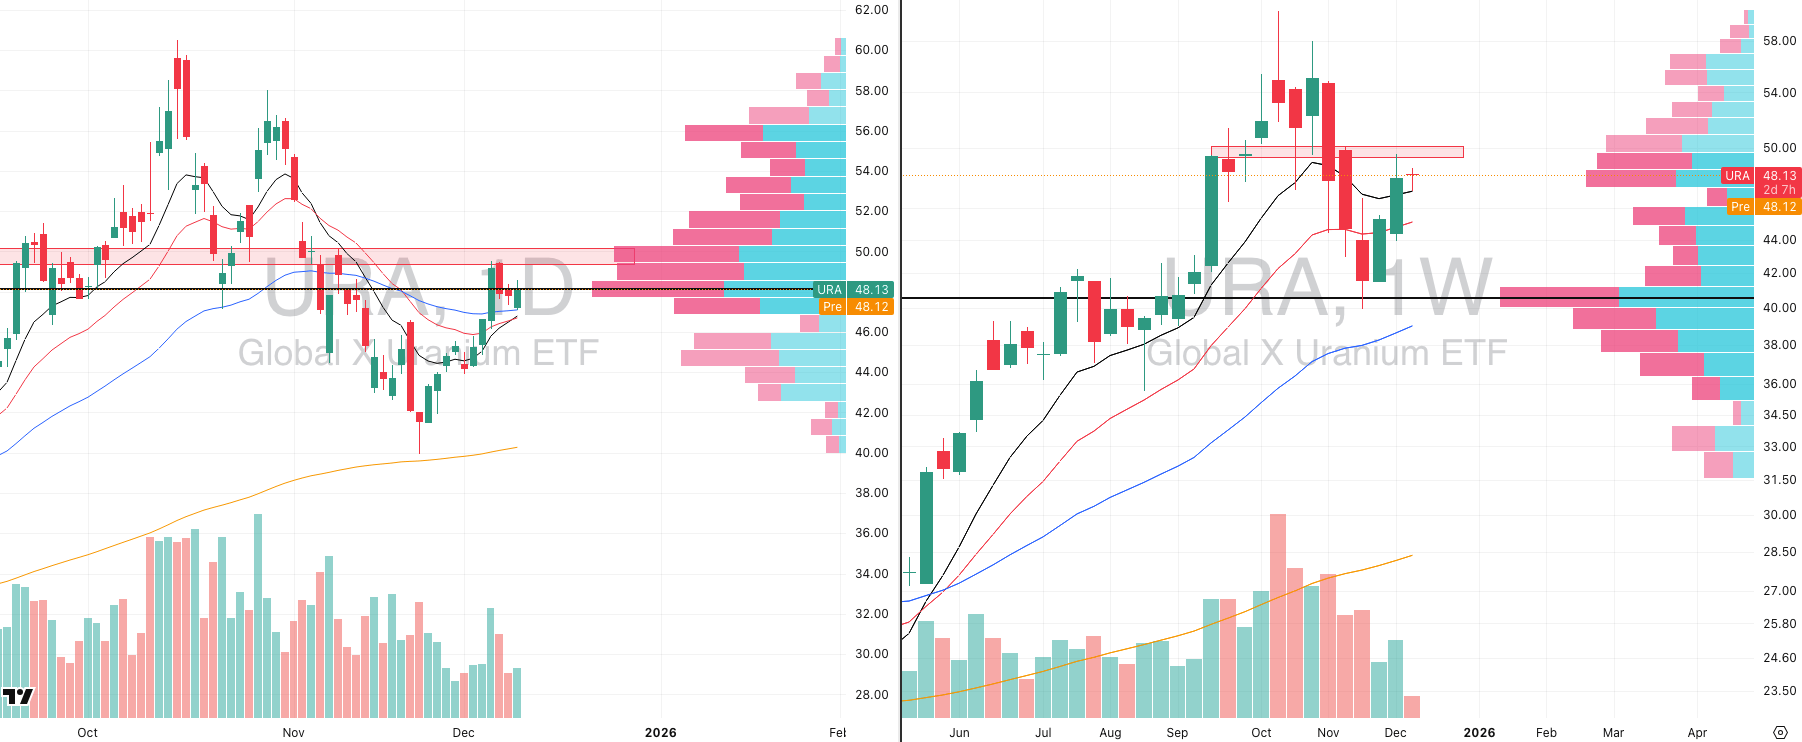
URA VRVP Daily & Weekly Chart
Uranium continues to behave more like a growth proxy than a defensive commodity, which is why we are treating it as a focus group rather than a standalone macro trade.
URA has been consolidating just above its point of control around 48, with price holding above key moving averages and refusing to break down despite recent market hesitation.
The structure is defined by tightening ranges and declining volume, which suggests that sellers are being absorbed rather than actively pressing downside.
What makes Uranium particularly relevant right now is its increasing correlation with growth-adjacent themes, especially power demand tied to AI infrastructure.
A growing number of technology companies are exploring modular nuclear solutions to support AI workloads, which is pulling Uranium into the same conversation as speculative growth and advanced technology plays.
Political alignment also matters here, with renewed emphasis on domestic nuclear leadership and energy independence acting as a longer-term tailwind rather than a short-term catalyst.
The technical structure in URA mirrors what we are seeing in some leading individual names within the space, where consolidation is taking place after strong upside extensions.

OKLO VRVP Daily & Weekly Chart
We have previously highlighted OKLO, which shares a very similar formation to QBTS, reinforcing the idea that this is a group-level behavior rather than isolated stock action.
As with QBTS, the goal is not to front-run a breakout but to track how this contraction resolves, especially in the context of broader risk sentiment following the Fed decision.
If Uranium fails alongside growth after FOMC, that would be meaningful information. If it holds or breaks higher, it strengthens the case that speculative leadership remains intact.

Did you find value in today's publication?This helps us better design our content for our readers |
Reply