- Swingly
- Posts
- Today’s Market, Stripped of the Noise
Today’s Market, Stripped of the Noise


MARKET ANALYSIS
Here’s All You Need To Know

There is a lot of headline noise in the market right now, and that is increasingly showing up in short-term volatility, particularly at the index level.
Futures are modestly lower this morning, with the S&P 500, Dow, and Nasdaq all pulling back slightly after recent record highs.
Importantly, this weakness is not being driven by a single macro shock, but rather by a stacking of narratives that are creating short-term uncertainty.
Earnings season is now fully underway, with major banks reporting this morning. Financials were the weakest group in the prior session following disappointment around investment banking revenues, which contributed to the broader index pullback.
At the same time, inflation data remains in focus, with December PPI due before the open, adding another layer of wait-and-see behavior from market participants.
Beyond earnings and inflation, political headlines continue to inject volatility. Ongoing pressure from the White House on the Federal Reserve, including renewed attacks on Chair Powell and questions around Fed independence, have clearly unsettled parts of the market.
Add to that geopolitical developments involving Iran and Greenland, along with new policy proposals around credit card rate caps, defense contractors, and housing ownership, and it is not surprising that index-level price action looks messy.
That said, it is important to separate noise from structure. While the indices are chopping and reacting to headlines, this does not resemble broad risk-off behavior.
Energy stocks are rallying alongside higher oil prices, precious metals continue to attract capital, European equities are making new highs, and select areas of the U.S. market are still seeing steady accumulation.
The presence of noise does not invalidate the broader trend, but it does reinforce the need to avoid momentum chasing at index highs and instead focus on where relative strength is actually being rewarded.
Nasdaq

QQQ VRVP Daily & Weekly Chart
52.94%: over 20 EMA | 53.92%: over 50 EMA | 59.80%: over 200 EMA
Starting with the NASDAQ, the QQQ continues to lag relative to the other major indices we track. Yesterday’s session was choppy but, importantly, constructive.
We initially pushed lower, tested the rising 10-day EMA at 623, and saw buyers step in at that level. The session ultimately closed as a doji, which many will interpret as indecision.
However, despite slightly elevated uncertainty and a modest pickup in volatility, the NASDAQ closed at or just above Monday’s close and pushed into multi-month highs which are levels not seen since early November.
Supply clearly showed up at those highs, and we did reject that zone, but price remains only ~1.6% from all-time highs. The intermediary trend continues to tighten aggressively. We are holding above the weekly point of control, and price is compressing in a way that strongly suggests a resolution is approaching.
This has been a difficult environment for breakout traders. Opening-range strength has consistently failed, while pullbacks have continued to offer far better asymmetry.
That dynamic remains intact and while we have not yet seen the type of aggressive expansion many are waiting for, the broader structure remains constructive. A decisive move, higher or lower, is coming, but for now, the NASDAQ is coiling rather than breaking down which is why we suspect a big push higher around the corner.
S&P 400 Midcap
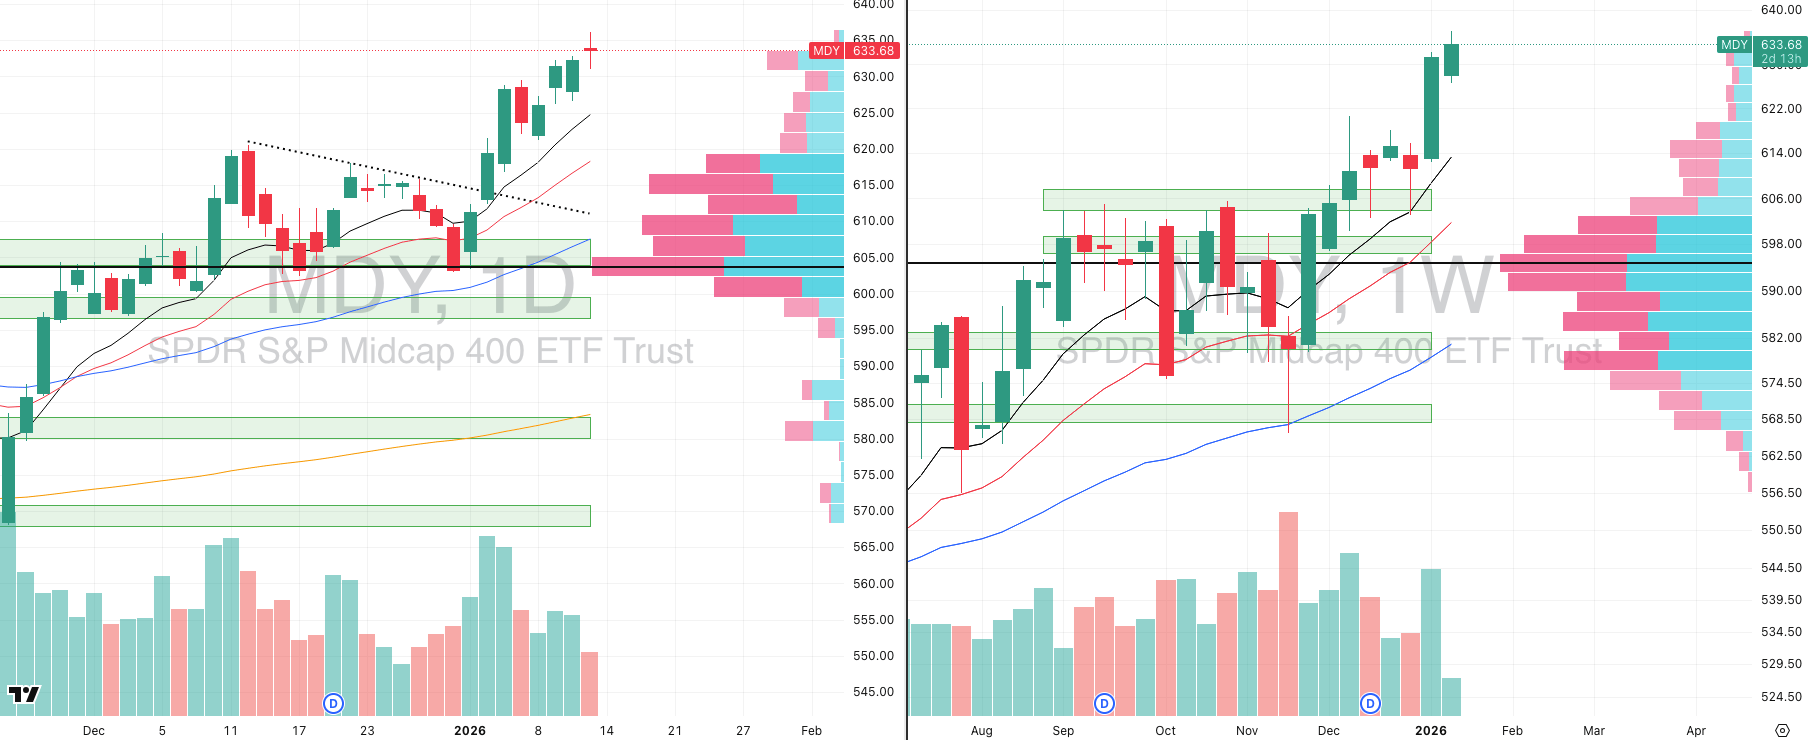
MDY VRVP Daily & Weekly Chart
69.42%: over 20 EMA | 74.43%: over 50 EMA | 65.66%: over 200 EMA
Turning to the mid-caps, the MDY is behaving largely as expected. Since the January 5 breakout above 615, price has extended roughly 4% above the rising 10-week EMA.
At the same time, relative volume has been declining on the most recent pushes higher. That combination with extension plus waning volume does often precedes mean reversion.
From our perspective, the mid-caps are now short-term stretched. A pullback of roughly 1.5% to the rising 10-day EMA near 624.50 would be entirely normal and, frankly, healthy. Given the breadth picture with roughly 70% of stocks above the 20 EMA and ~74% above the 50 EMA, conditions are hot.
That does not imply a breakdown, but it does increase the probability of either a time-based consolidation or a sharper, but likely brief, flush lower.
The ideal outcome would be a sideways digestion that allows moving averages to catch up. A faster downside move is also possible, particularly given how one-sided positioning has become in the short term.
Either way, the odds favor some form of pause rather than continued straight-line upside from here.
Russell 2000
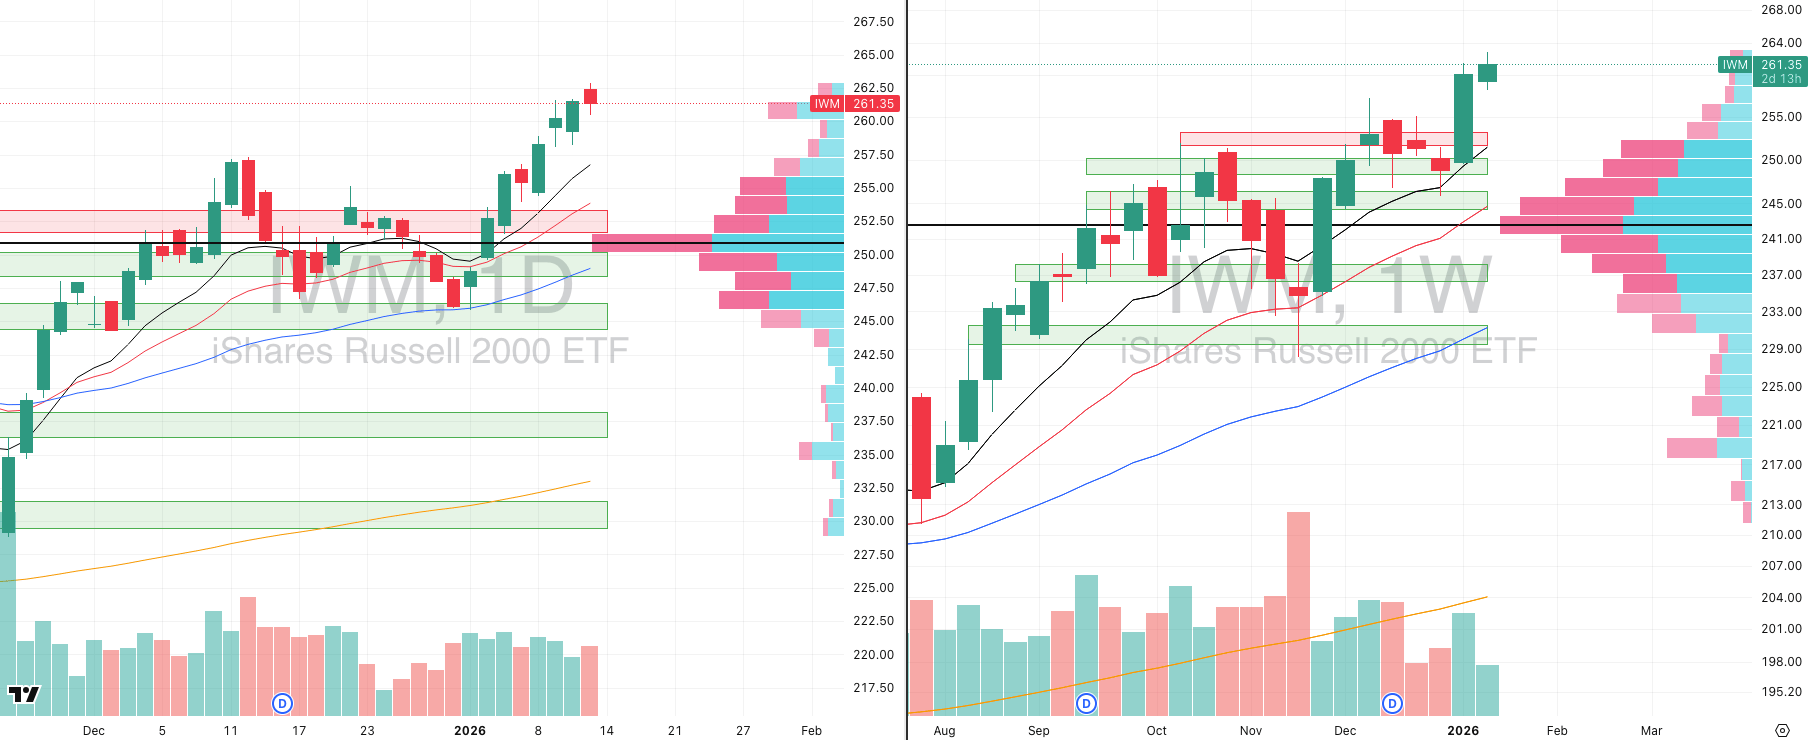
IWM VRVP Daily & Weekly Chart
59.49%: over 20 EMA | 67.42%: over 50 EMA | 65.36%: over 200 EMA
The small caps (IWM) are telling a similar story as they have been exceptionally strong but are now extended on a short-term basis. Price is roughly 2.3% above the 10-day EMA and close to 4% above the 10-week EMA. The move has been nearly vertical, up roughly 7% across seven of the last eleven sessions.
That type of ascent is unsustainable without interruption. As with the mid-caps, a pause or rotation would be the most logical next phase. One potential outcome is a rotation back toward the NASDAQ, which has lagged and remains tightly coiled.
That would align with the broader theme we’ve been seeing: leadership rotating rather than capital exiting the market.
Overall, the environment remains selective by no means is this is a market where aggressive momentum chasing is being rewarded. However, for traders willing to stay patient, focus on pullbacks, and operate on weakness rather than strength, opportunity still exists.
FOCUSED STOCK
MSTR: The Prior Crypto Leader is Back?
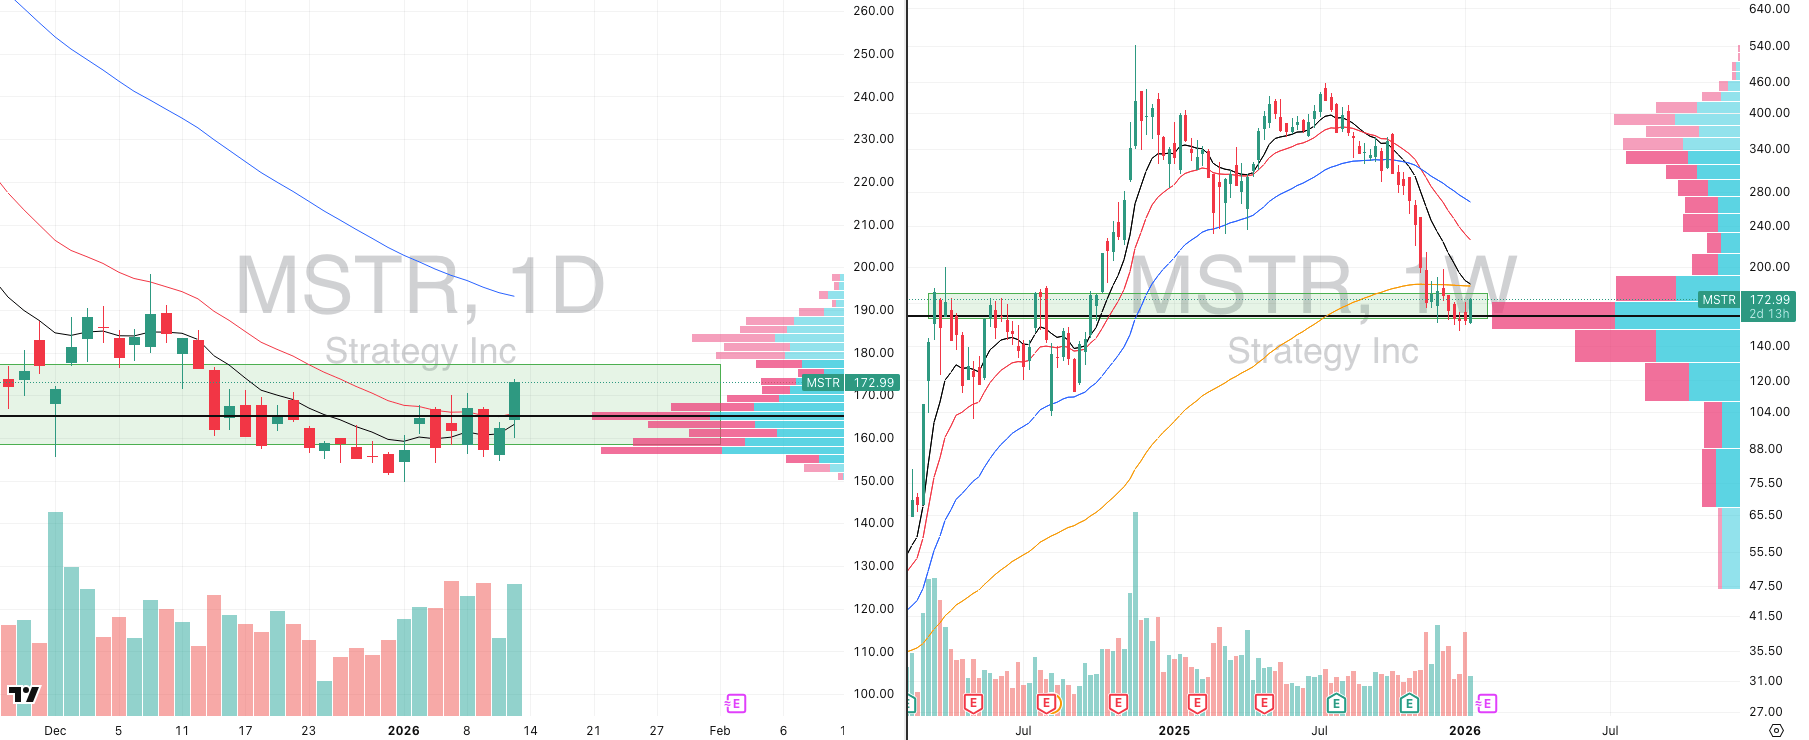
MSTR VRVP Daily & Weekly Chart
ADR%: 5.97% | Off 52-week high: -62.2% | Above 52-week low: +15.5%
Some of you will be surprised to see MicroStrategy on today’s focus list, and that reaction is completely understandable.
MSTR currently carries a relative strength rating of just 2 versus the S&P 500, which clearly places it among the weakest names on a pure momentum basis. This is not a leadership trade at all.
The reason we are highlighting it today is due to a developing character change after an extreme drawdown.
Since the breakdown that began around August 11, the stock has lost roughly 60% of its value, placing it firmly in deeply oversold territory on multiple timeframes.
Since January 2, relative volume has been steadily expanding, and price is now up approximately 16% from those early January lows.
Yesterday, we saw a decisive expansion on 141% of relative volume, coinciding with renewed strength across crypto-linked assets as both Bitcoin and Ethereum begin to expand again.
From a structural standpoint, MSTR is sitting directly on a major demand zone that dates back to March 11, 2024. This level, highlighted on the weekly chart, previously acted as supply and has now been functioning as demand since mid-November.
Price has repeatedly held this area since entering the zone, which is not insignificant given the magnitude of the prior decline.
On the longer-term charts, there is additional context worth noting. On the monthly timeframe, MSTR is attempting to reclaim the 50-month EMA, which further reinforces the idea that downside momentum is slowing and that a base may be forming.
To be clear, this is not a breakout setup, nor is it a momentum leader. There are multiple cryptocurrency-related equities with far superior relative strength, and those remain the preferred vehicles if your mandate is strict leadership-only exposure. That is still our primary approach at Swingly.
MSTR is being highlighted strictly as a deep pullback candidate within a resurgent crypto environment. In markets like these, where selectivity matters, oversold names at major demand levels can sometimes offer meaningful countertrend or recovery moves.
FOCUSED GROUP
XLRE: Real Estate in a Primary Trend Flag

XLRE VRVP Daily & Weekly Chart
From a price perspective, real estate has largely moved sideways since peaking on September 16, 2024, near the 43.29 area.
That means we are now looking at roughly 16 months of base building, which is significant when viewed through an intermediary and primary trend lens.
From a macro standpoint, real estate is one of the segments that typically benefits when interest rates stabilize or move lower, which is exactly the environment we are currently in.
Last week, we saw a notably strong relative volume expansion on the weekly chart, and yesterday’s session added further confirmation.
Price sold off sharply at the open, dropping roughly 0.9%, which is close to one full average daily range for the group. Instead of accelerating lower, demand stepped in aggressively, and real estate rallied 1.79% off the lows, reclaiming key levels by the close.
On the higher timeframes, the structure is becoming clearer. Real estate has been consolidating above the rising 20-month EMA, which sits around the 40 level and also aligns with the monthly point of control.
That level has consistently acted as support throughout this entire basing process. More recently, price has reclaimed both the 10-week and 20-week EMAs, with those averages now beginning to flatten and turn higher.
This does not mean real estate is suddenly an easy trade. The group remains choppy, and false starts have been common over the past year.
That said, when you see a base of this magnitude form on the intermediary and primary trends, combined with improving volume behavior and reclaiming key moving averages, it becomes a segment that deserves attention.
At the very least, real estate is moving back onto the focus list. If expansion does occur, these long, compressed structures are often the ones that produce sustained moves once they finally resolve.

Did you find value in today's publication?This helps us better design our content for our readers |
Reply