- Swingly
- Posts
- Today’s Gap Down Isn’t the Whole Story
Today’s Gap Down Isn’t the Whole Story
In partnership with


MARKET ANALYSIS
Here’s All You Need To Know

From a macro perspective, this morning’s session is starting on a very different footing to what we have seen over the past week. We are seeing a large gap down across U.S. equity futures, with volatility spiking meaningfully in early trade.
Importantly, this weakness is not being driven by economic data, but rather by a renewed surge in headline-driven uncertainty, which is something markets have been extremely sensitive to recently.
Overnight, geopolitical risk re-entered the equation, with increased tension surrounding Greenland, alongside a much more material development on the domestic front.
Federal Reserve Chair Jerome Powell confirmed that the Fed has been served with grand jury subpoenas from the Department of Justice, raising the possibility of a criminal indictment related to his prior congressional testimony.
While the details remain unclear, Powell framed the move as part of broader political pressure on the Federal Reserve, reinforcing concerns around the independence of monetary policy.
Markets reacted swiftly to the news. Equity futures sold off, the dollar weakened, and gold pushed to fresh record highs, all the classic risk-off responses to institutional and political uncertainty. This type of event-driven volatility is difficult to price in and tends to create sharp, emotional moves in the short term, particularly at index level.
That said, it is important to keep some perspective. While the headline risk is real, and today’s gap down should not be ignored, this does not automatically translate into a broad-based market breakdown.
What it does reinforce is the environment we have been consistently highlighting: choppy, news-sensitive conditions where index-level exposure is harder to manage, and where stock selection and position management matter far more than directional conviction.
As always in sessions like this, the close matters far more than the open. Large gaps driven by uncertainty can either resolve quickly as fear is absorbed, or they can deteriorate into trend days lower.
The way price behaves into the close will give far clearer information about whether this move is simply another volatility event within a broader rotation-driven market, or something more structural.
Nasdaq
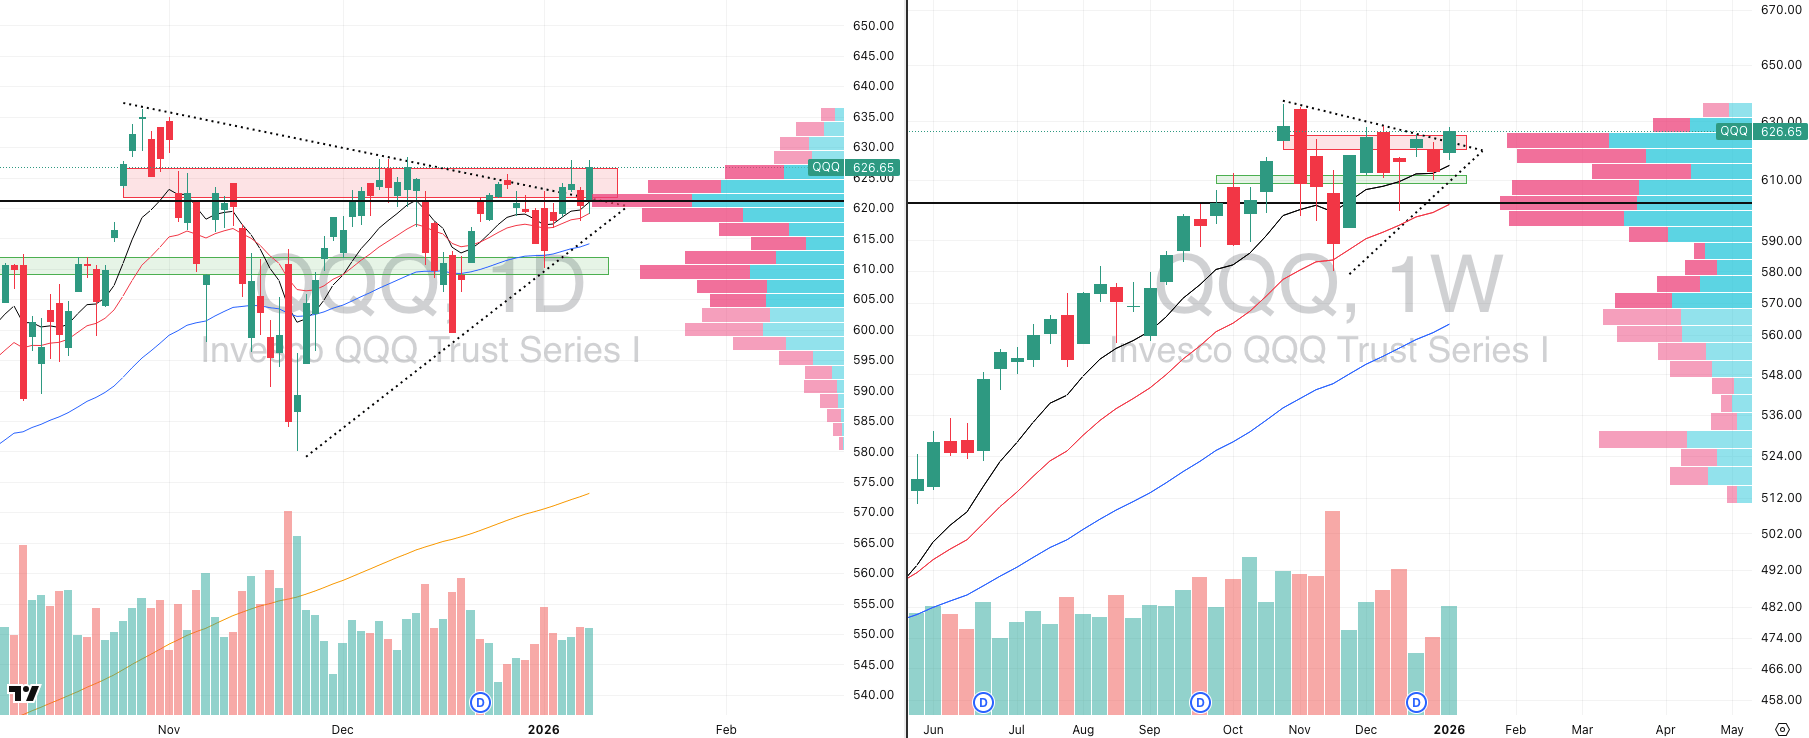
QQQ VRVP Daily & Weekly Chart

QQQE VRVP Daily & Weekly Chart
58.82%: over 20 EMA | 56.86%: over 50 EMA | 60.78%: over 200 EMA
Looking first at the Nasdaq, we are unfortunately seeing a gap down this morning of roughly 1%, following what was otherwise a fairly constructive week last week.
During that week, price pushed up into the 628 area, repeatedly bouncing off the 10- and 20-day moving averages, as well as the 10-week EMA near 615, with relative volume expanding on those advances.
That said, it is important to be very clear here: supply was not cleared. There remains meaningful overhead supply all the way up to approximately 628.52, and price failed to push decisively through that zone.
We also need to contextualize this within the broader Nasdaq complex. Large- and mega-cap technology continued to lag last week, which is why we want to draw attention again to the QQQE, the equal-weighted variant of the Nasdaq.
The difference in behavior here is very telling. QQQE actually broke out last week, doing so on Tuesday, January 6, and then came back down to retest the breakout level around 104, which was prior supply and also where the point of control is located. That level held cleanly, and price immediately pushed higher again on Friday.
The underperformance is concentrated in the mega-cap names, while the more evenly weighted technology components are showing relative strength and follow-through.
If you are looking to express technology exposure, it makes far more sense right now to avoid the mega-cap concentration and instead focus on non-mega-cap tech. This also aligns with what we have been consistently emphasizing in our reports: strength is lower down the capitalization curve, not at the very top.
S&P 400 Midcap

MDY VRVP Daily & Weekly Chart
73.68%: over 20 EMA | 76.94%: over 50 EMA | 66.42%: over 200 EMA
MDY put in a massive breakout week last week, supported by extremely strong relative volume, with the weekly candle coming in at 116% of average volume.
The weekly range expanded to just over 3.17%, well above the typical average weekly range of around 2.8%. The initial breakout occurred on Monday with strong volume, followed by a pullback on lighter volume into the 10-day EMA, and then a renewed push higher on Friday with expanding relative volume once again.
That is exactly the sequence you want to see: expansion through resistance, shallow pullbacks on low volume, and continuation higher.
Given this structure, and given where relative strength is currently concentrated, we believe the mid-caps are very likely to continue holding up well, even if broader market volatility persists. Any downside pressure that is currently hitting the Nasdaq appears far less impactful here.
Russell 2000

IWM VRVP Daily & Weekly Chart
60.10%: over 20 EMA | 68.53%: over 50 EMA | 66.42%: over 200 EMA
IWM also had a very strong week, although it continues to lag the mid-caps slightly. Relative volume expanded to 107% of the 20-week average, with a wide weekly range of approximately 4.8%, which is more than 1% above its average weekly range. That is a meaningful expansion.
At the same time, small caps had become somewhat short-term extended, sitting roughly 3% above the 10-week EMA, so a pullback here is not only normal but healthy.
What we want to see across all of these segments now is contraction, not acceleration. And above all else, the most important data point today is the close, not the intraday volatility.
How the market closes will tell us whether this gap down is being absorbed constructively or whether downside momentum is beginning to build. If strength is reclaimed into the close, that is the signal that matters most.
Looking for unbiased, fact-based news? Join 1440 today.
Join over 4 million Americans who start their day with 1440 – your daily digest for unbiased, fact-centric news. From politics to sports, we cover it all by analyzing over 100 sources. Our concise, 5-minute read lands in your inbox each morning at no cost. Experience news without the noise; let 1440 help you make up your own mind. Sign up now and invite your friends and family to be part of the informed.
FOCUSED STOCK
AVGO: The Next Semiconductor Breakout?

AVGO VRVP Daily & Weekly Chart
ADR%: 3.80% | Off 52-week high: -16.6% | Above 52-week low: +151.3%
AVGO is currently forming a double bottom structure right around the 20-week EMA. The first bottom formed during the sharp selloff on December 17, while the second bottom developed into Thursday–Friday, January 8–9, with price holding firmly around the 330 level.
That second test is particularly important, as it occurred during a red hammer week on extremely high relative volume, roughly 100% of the 20-week average, which helped confirm demand stepping in at that level.
It is also important to frame this setup correctly within the broader semiconductor landscape. Large and mega-cap semiconductors have not been the momentum leaders recently.
While NVIDIA remains the most watched name, it is not the momentum leader. That title currently belongs to Micron (MU), which has been showing the strongest relative momentum within the group.
AVGO itself is at a very interesting inflection point. At the time of writing, it is gapping down approximately 1.7% in premarket, which keeps both directional outcomes firmly on the table.
From here, there are two clean, asymmetric scenarios:
Bullish scenario: If price pushes back toward 330 and holds, this sets up a very attractive pullback entry against clearly defined support, with tight risk and strong upside optionality if the double bottom resolves higher.
Bearish scenario: If 330 fails, AVGO opens up a very clean downside path toward its rising 200-day EMA near 304, representing roughly 8% downside. There is also a visible range volume profile gap into that level, which would likely get filled on a breakdown.
The reason we are highlighting AVGO today is not because we have a fixed directional bias. It is because this is a point of maximum asymmetry.
As traders, the goal is not prediction but preparation. Tight price contraction, expanding volatility potential, and clearly defined levels allow for precise entries and tight stops, which mathematically increases return potential through favorable risk-to-reward dynamics.
FOCUSED GROUP
PBW: Clean Energy Beginning To Push
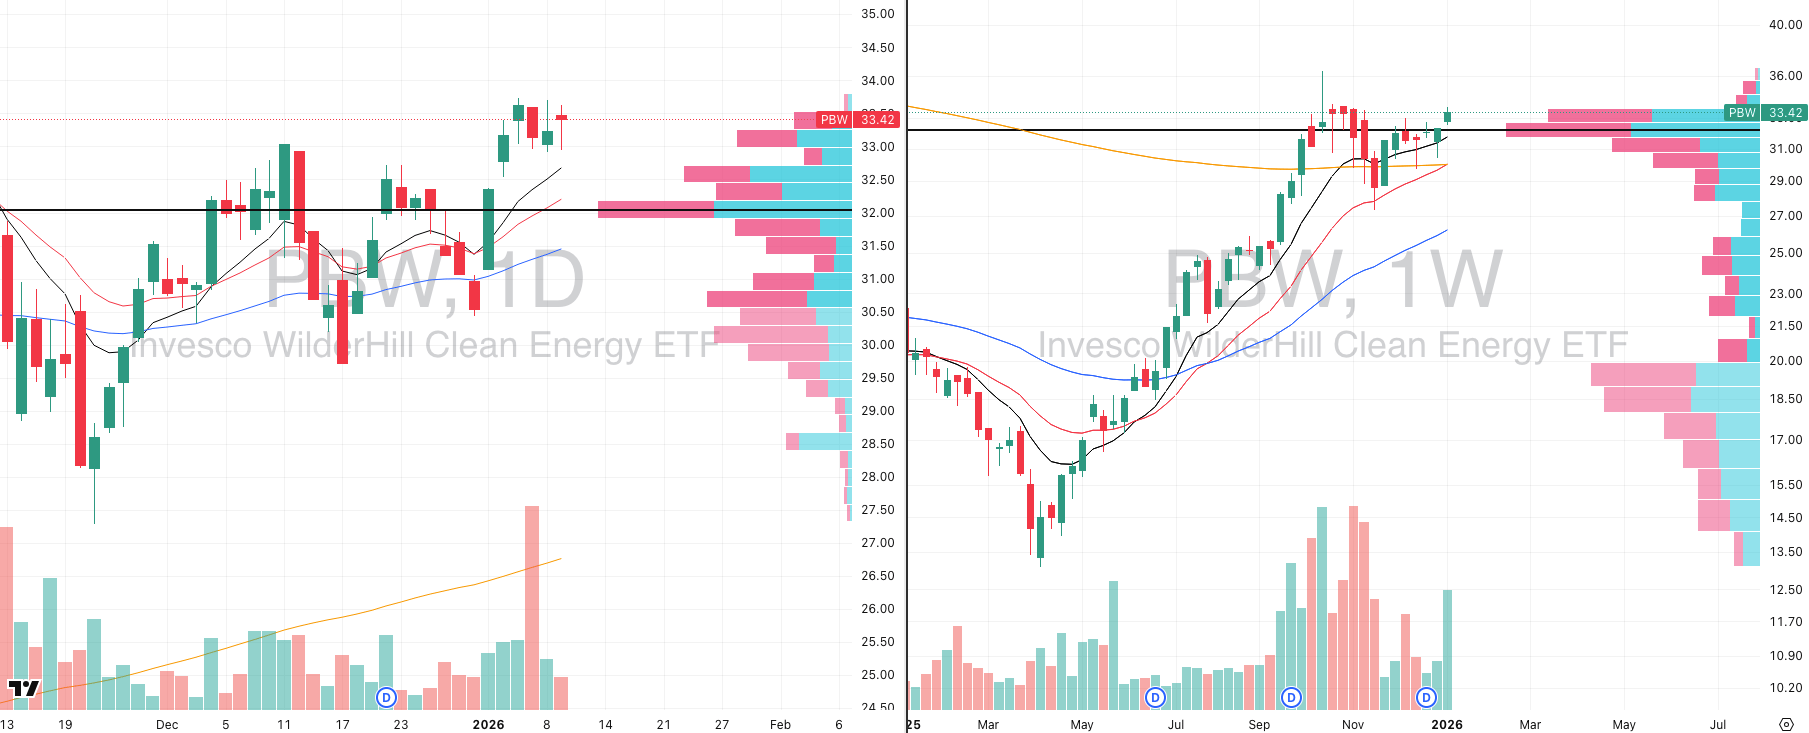
PBW VRVP Daily & Weekly Chart
PBW broke out on Friday, January 2, and since that breakout, it has transitioned into a high-tight flag / volatility contraction pattern. Price is now compressing between roughly 32.95 and 33.75, sitting just above the 10-day EMA, while supply remains overhead up to approximately 33.80.
Last week’s weekly breakout printed on approximately 175% relative volume, which is a significant institutional-grade expansion signal.
More importantly, PBW has now reclaimed and held above its 200-week moving average at 29.99. The 10-week EMA crossed above the 200-week EMA back on October 27, and the 20-week EMA is now crossing above the 200-week EMA as well.
That combination marks the transition into a new primary uptrend and it is these moments are rare and extremely important. When an ETF or sector emerges from a prolonged contraction and aligns across weekly and primary trend timeframes, the asymmetry shifts dramatically in favor of trend continuation. This is often where the largest multi-month moves begin, before the group becomes widely discussed or crowded.
This strength is not isolated to PBW either. Other clean energy ETFs, such as ICLN, are also pushing higher and, in some cases, outperforming PBW, which adds further confirmation that capital is rotating into the broader clean energy space.

Did you find value in today's publication?This helps us better design our content for our readers |
Reply