- Swingly
- Posts
- This Week Could Flip the Entire Market Narrative
This Week Could Flip the Entire Market Narrative
In partnership with

OVERVIEW
What You Need To Know
Macro
Markets are attempting a rebound, but liquidity is thin and confidence remains fragile after a heavy November drawdown.
Rotation is shifting away from Nasdaq/AI leadership and toward broad-market groups (RSP, MDY, IWM).
Tuesday’s Retail Sales + PPI are the only meaningful catalysts; Fed enters December FOMC without CPI, increasing uncertainty.
Nasdaq
Friday’s bounce followed a 242% RVOL weekly breakdown, with QQQ failing to reclaim the 10-week EMA and fading into the close.
The structure still shows strong opens → weak closes and a potential right-shoulder forming — buyers have shown zero control.
Risk of assuming a bottom remains high until QQQ can reclaim $600 and hold it on closing strength.
S&P 400 Midcap (MDY)
MDY reversed hard off the $570 demand zone / 50-week EMA, printing a strong high-RVOL reaction.
Despite strength, it failed at the declining 20-week EMA and weekly POC, signalling reactive demand, not trend leadership yet.
Needs a decisive reclaim over $585–$590 to confirm a character shift.
Russell 2000 (IWM)
Strong high-RVOL reversal off $230 with a reclaim of the 20-week EMA, showing earlier broad-market demand than Nasdaq.
Bounce stalled at $237 supply + 10-day EMA + 10-week EMA, keeping it below trend inflection.
Watch for a breakout over $237 with rising RVOL to confirm true leadership rotation.
Focused Stock: BTSG
BTSG continues to act like a true leader, rebounding cleanly off its rising 10-week EMA with expanding demand.
Strong fundamentals + controlled pullbacks + high-quality weekly structure signal active institutional accumulation.
In the strongest sector of the market, BTSG remains one of the cleanest setups.
Focused Group: XLB
XLB has formed a double bottom on the rising 200-week EMA, with both lows defended by elevated volume.
Daily structure shows repeating demand absorption — early signs of cyclical sector stabilization.
Not actionable yet, but a breakout on rising RVOL would create a highly asymmetric long opportunity.

MARKET ANALYSIS
Nasdaq Weak, Broad Market Strengthening

Markets are attempting a rebound, but confidence remains thin. Friday’s bounce helped stabilise sentiment, but the tape is still digesting a sharp November drawdown with low holiday-week liquidity with a combination that naturally produces choppy, unreliable opens.
The AI/Nasdaq leadership unwind is the dominant macro theme. Nasdaq is down 6.1% MTD, and mega-cap AI names continue to de-rate. Importantly, we are now seeing a major relative strength surge in the broad market (equal-weight, midcaps, small caps) versus the Nasdaq tech complex.
Only meaningful catalysts this week are Tuesday’s Retail Sales + PPI. With CPI delayed until after the December FOMC, the Fed will enter its final meeting without its primary inflation datapoint thus naturally raising policy uncertainty and market sensitivity to Tuesday’s prints.
Rate-cut expectations jumped after John Williams hinted at “further adjustment.” Markets now price a ~70% chance of a December cut (vs. 44% last week). Good for RSP/IWM if confirmed by data and sustained by breadth. Too early to treat as a policy pivot.
Investor confidence still fragile despite Friday’s move. Participants are unwilling to chase strength until volatility compresses and the market proves it can hold gains into the close, not just the open.
Bottom line: This is a low-liquidity, rotation-driven environment where strength is shifting away from the Nasdaq and into broader S&P components. Macro catalysts are thin, uncertainty is elevated, and patience still carries the edge until breadth + volume confirm a durable turn.
Nasdaq
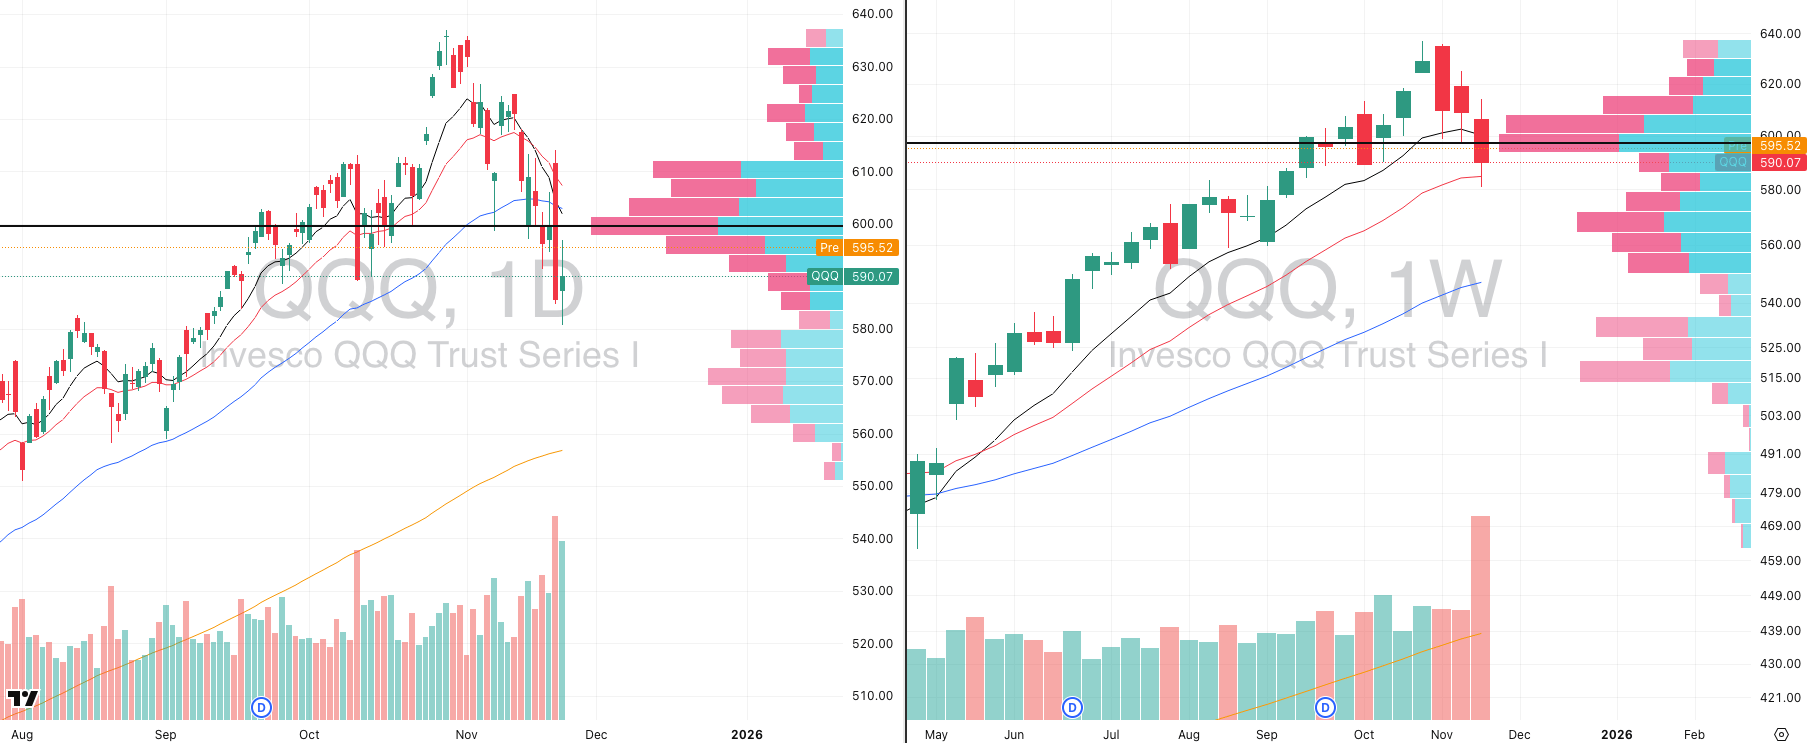
QQQ VRVP Daily & Weekly Chart
% over 20 EMA: 29.41% | % over 50 EMA: 30.39% | % over 200 EMA: 50.98%
Friday delivered a meaningful high-relative-volume bounce, but context matters as this came in a 242% relative-volume weekly breakdown that pushed QQQ decisively below the $600 POC and the declining 10-week EMA.
The only structural layer that held was the 20-week EMA at ~$580, which is where buyers finally stepped in. This is the same level of volume that caught QQQ during the April 2025 capitulation, underscoring just how elevated last week’s participation was on the sell side.
Despite Friday’s rebound, demand faded sharply into the close and the QQQ failed to reclaim the 10-week EMA and slid back toward $590, signalling no shift in character yet.
The past three weeks have followed an identical pattern: strong opens → weak closes → no control from buyers. Until this reverses, assuming a bottom is premature.
Structurally, QQQ is at real risk of forming a right shoulder on an emerging intermediate-term head and shoulders pattern and we believe it is very early to call a durable low. Participation was large, but it was sell-side dominant.
S&P 400 Midcap
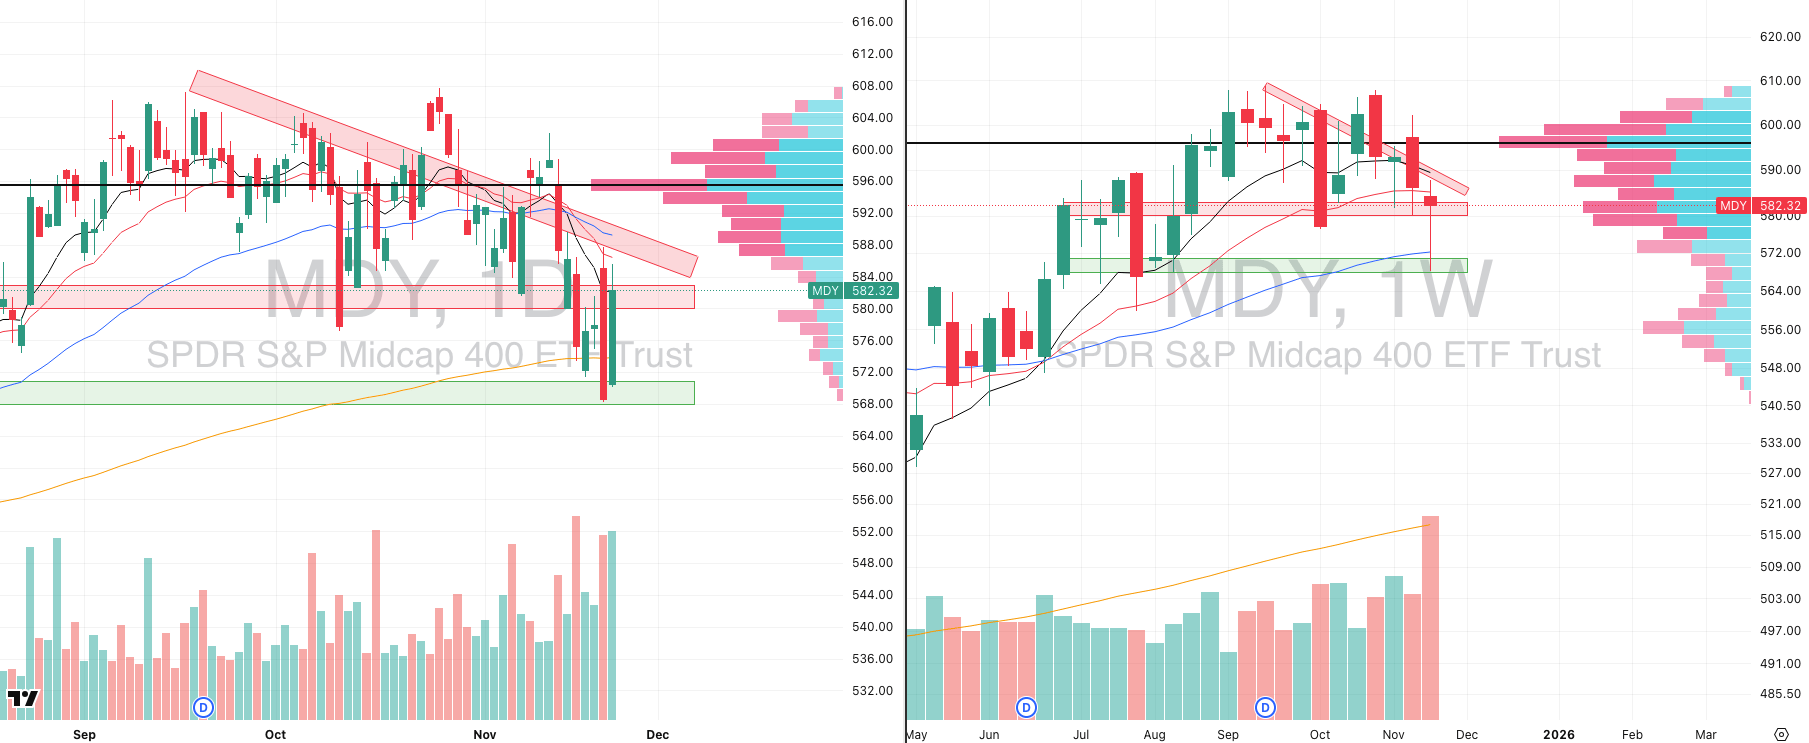
MDY VRVP Daily & Weekly Chart
% over 20 EMA: 48.25% | % over 50 EMA: 39.00% | % over 200 EMA: 52.50%
Friday delivered a meaningful high-relative-volume reversal, but this bounce came after a heavy-participation breakdown earlier in the week that drove MDY directly into its $570 demand zone and briefly undercut the 50-week EMA, a level not violated since mid-2024.
The weekly candle itself printed 186% relative volume, recovering almost the entire weekly drawdown in a single session which is a response that stands in stark contrast to what we saw in the Nasdaq complex. The 50-week EMA at ~$570 was the only structural layer that truly held, and buyers stepped in decisively at that level.
Despite the strength of the reversal, MDY still failed to reclaim the declining 20-week EMA, and the bounce stalled directly beneath the weekly POC and rejected the declining resistance at $585.
This tells us participation was large, but not yet indicative of a full character shift as it was reactive demand at a key long-term level, not trend leadership (yet).
Russell 2000
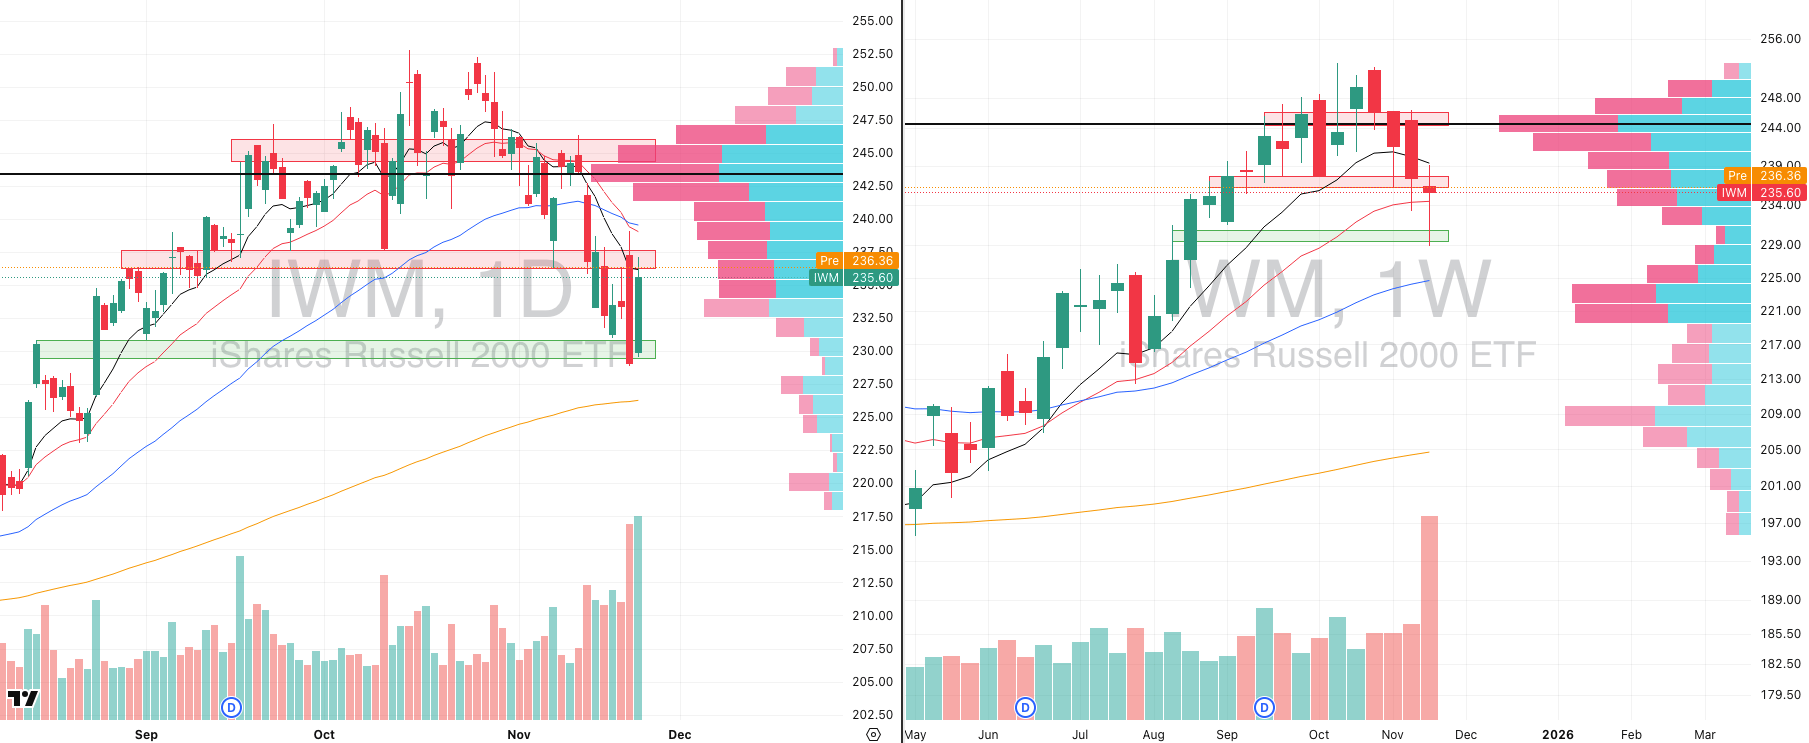
IWM VRVP Daily & Weekly Chart
% over 20 EMA: 47.30% | % over 50 EMA: 40.30% | % over 200 EMA: 52.44%
Friday delivered a forceful high-relative-volume reversal and this bounce emerged inside a 275% relative-volume weekly selloff, which drove IWM firmly into the $230 demand zone.
The reaction off $230 was materially stronger than what we saw in the Nasdaq, with IWM reclaiming the 20-week EMA on the rebound and finishing the week +2.5% off the lows and mirrors the dynamic seen in the mid-caps with broad-market demand is showing up earlier and cleaner than in large-cap tech.
Despite the strength, the bounce immediately ran into layered overhead supply:
former $237 demand → now supply,
the declining 10-day EMA,
and the declining 10-week EMA. This confluence acted as a hard ceiling and halted the advance, keeping IWM below the trend inflection.
Friday’s 229% relative-volume daily candle is important because it confirms real participation on the reversal, but participation does not equal a new uptrend. Much like MDY, we need to see whether buyers can convert this strength into clean, high-relative-volume breakouts over the overhead supply shelf.
Structurally, IWM is far healthier than QQQ but we are not calling a tradable bottom yet as the character of the tape still demands confirmation:
A sustained reclaim over $237,
A close above the declining 10-week EMA,
And ideally a breadth expansion accompanied by rising upside relative volume, not just downside capitulation.
We are actively watching IWM (and MDY) as the first potential leadership candidates if a genuine market-wide rotation away from mega-cap tech takes hold, but for now, the posture remains disciplined and evidence-based.
If we begin to see high-relative-volume breakouts over the supply zones in IWM and MDY, the entire risk landscape changes. For now, we wait.
The Smartest Free Crypto Event You’ll Join This Year

Curious about crypto but still feeling stuck scrolling endless threads? People who get in early aren’t just lucky—they understand the why, when, and how of crypto.
Join our free 3‑day virtual summit and meet the crypto experts who can help you build out your portfolio. You’ll walk away with smart, actionable insights from analysts, developers, and seasoned crypto investors who’ve created fortunes using smart strategies and deep research.
No hype. No FOMO. Just the clear steps you need to move from intrigued to informed about crypto.
FOCUSED STOCK
BTSG: Another Healthcare Leader Pushing
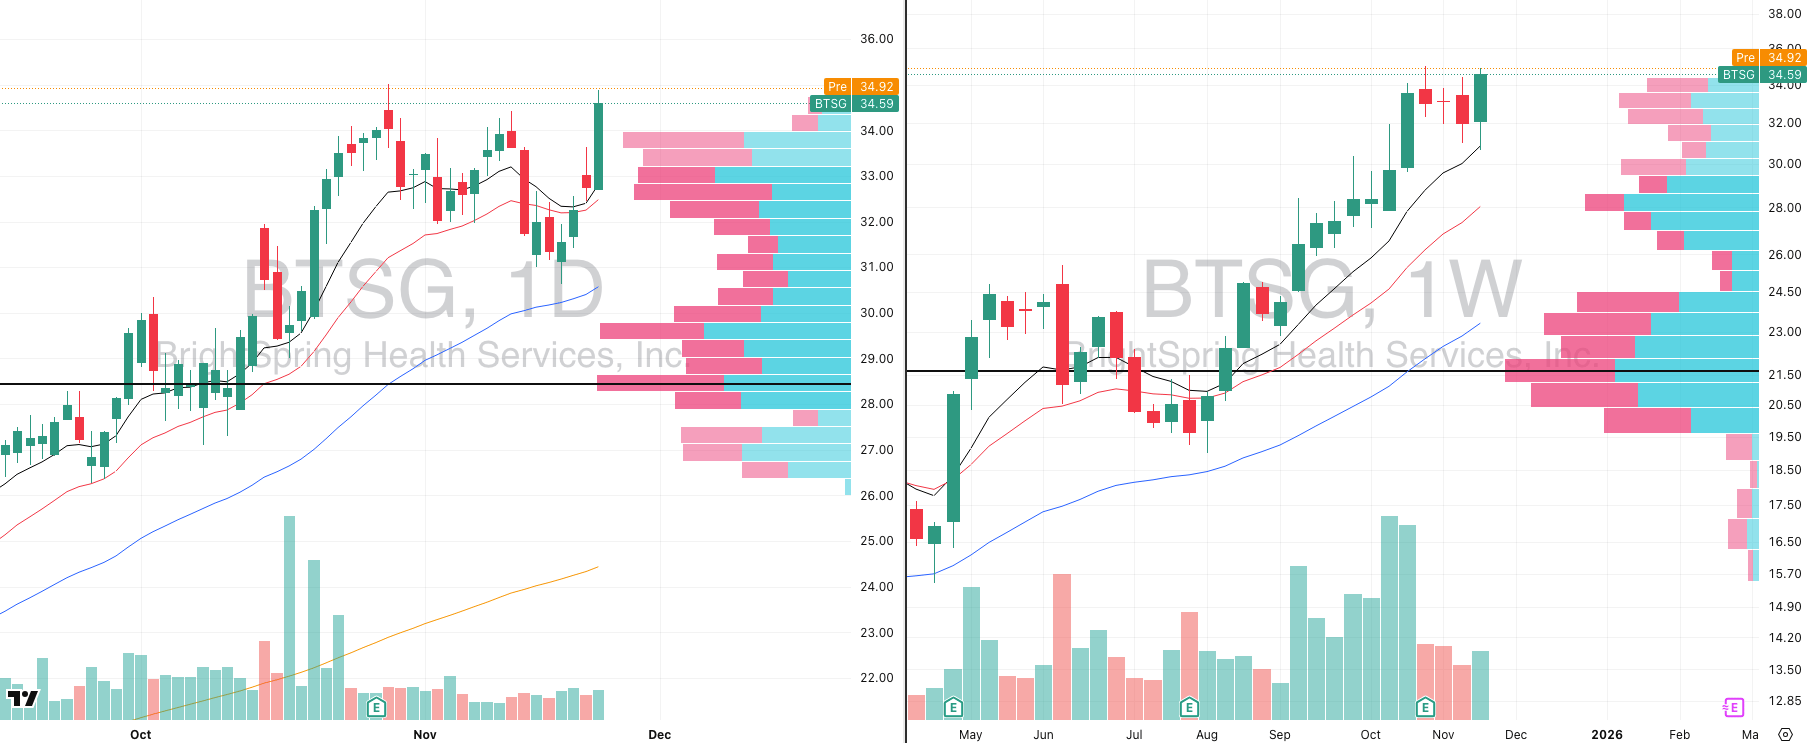
BTSG VRVP Daily & Weekly Chart
ADR%: 3.95% | Off 52-week high: -1.2% | Above 52-week low: +126.7%
Healthcare remains the strongest group in the entire market, both in absolute trend strength and in relative strength versus the broader indices.
BTSG continues to stand out as one of the most technically sound names in the group as the stock delivered a very clean rebound last week off the rising 10-week EMA, showing buyers were ready and waiting at the first logical area of support.
Friday’s breakout came on meaningful participation, confirming that demand is not only intact but accelerating. In a market where the vast majority of charts are fractured, BTSG is demonstrating the opposite with controlled pullbacks, rising support, and decisive expansion when broad conditions allow it.
Fundamentally, BTSG pairs strong technicals with robust revenue growth, reinforcing why institutions continue to accumulate it. When a stock shows both trend stability and accelerating fundamentals inside the strongest sector, that is where leadership typically forms.
FOCUSED GROUP
XLB: Materials Bottoming Out
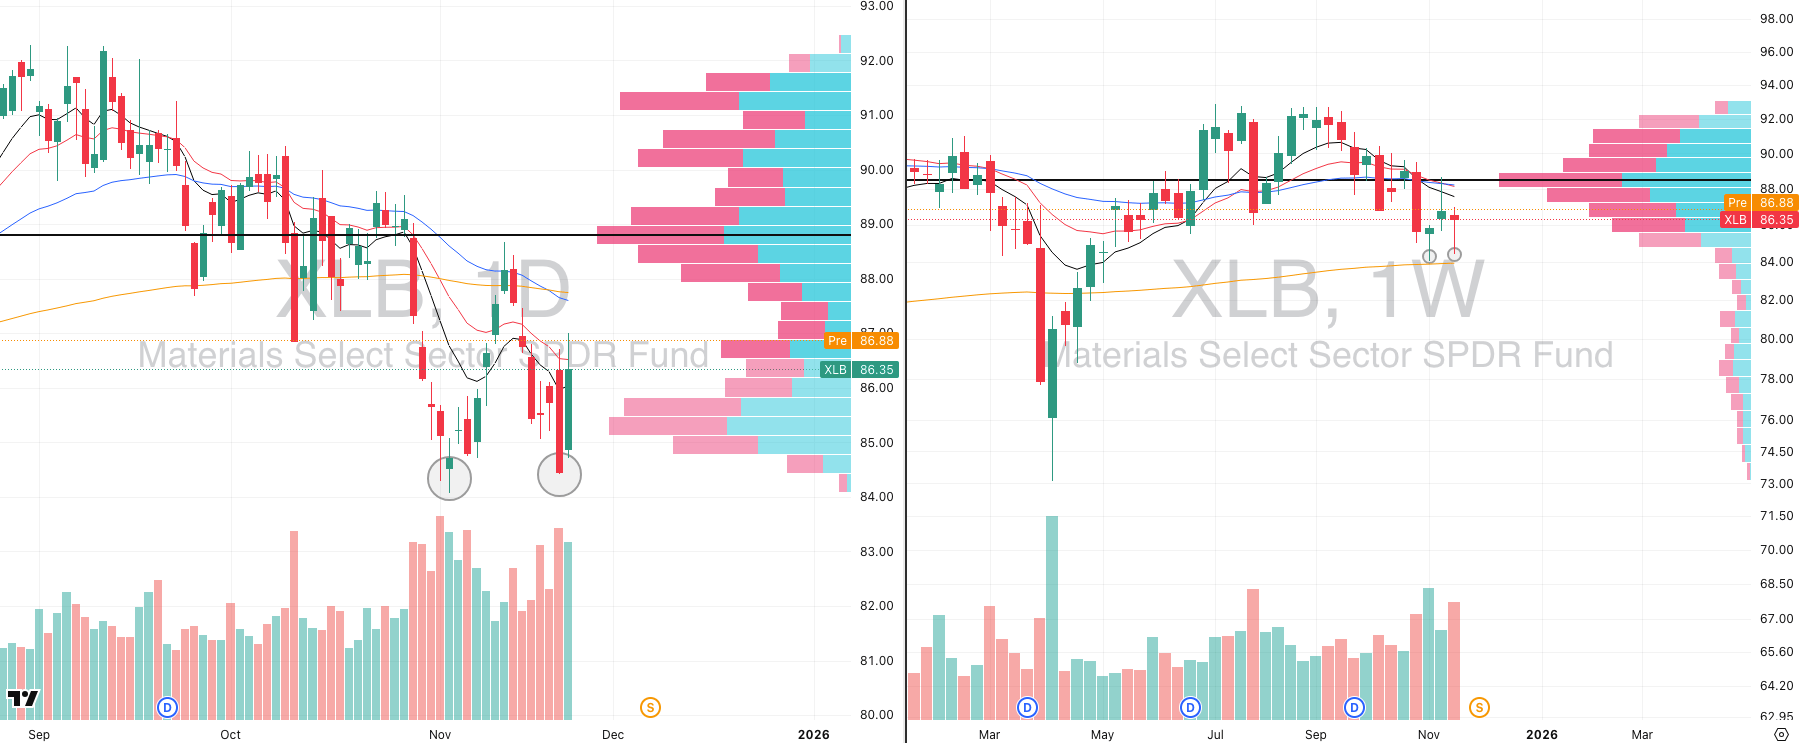
XLB VRVP Daily & Weekly Chart
XLB has now printed a clear double-bottom along the rising 200-week EMA, and this is the first time in this corrective period that we’re seeing buyers show up at a meaningful long-term trend level.
Both lows were defended with distinctly elevated volume, which is exactly what you want to see when a major ETF is testing a primary moving average that has defined its trend for years.
On the daily chart, the character shift is obvious: the first bottom saw a high-volume flush that reversed aggressively, and the second test replicated the same demand response.
While this is not yet an actionable breakout, XLB is one of the first cyclical sectors showing structural evidence of demand at a long-term moving average, and it aligns with the broad-market RS surge vs. the Nasdaq we highlighted earlier.
This is absolutely something we want to track closely as if XLB starts to break above overhead supply on rising relative volume especially given how asymmetrical a long play would be after such a heavy sector sell off.

Did you find value in today's publication?This helps us better design our content for our readers |
Reply