- Swingly
- Posts
- This Week Could Define Q3- Here’s What to Watch
This Week Could Define Q3- Here’s What to Watch
In partnership with
OVERVIEW
Markets at Highs, But This Is the Real Test
🟢 Risk-On
Markets enter the week strong, but the real test is Big Tech earnings. Breadth remains healthy, major indices are holding near highs, and recent shakeouts have been absorbed.
📈 Earnings-Driven Regime
We're not in headline territory-we’re in earnings land now. With Alphabet and Tesla reporting this week, we’ll get a verdict on whether the AI-led rally has legs or stalls under valuation pressure. These two names will heavily influence the entire tone of QQQ and SPX this week.
📊 Breadth + Internals Holding Firm
Net New Highs vs. Lows (NH/NL) surged to +2.77% while the McClellan Volume Summation Index (VSI) holds firmly above 1600 confirming healthy participation across the board.
⚠️ Sentiment Frothy, Vol Still Compressed
No breakdowns, but stopout risk remains elevated near highs. Watch how price reacts, not just earnings results- a “beat and drop” from mega-caps could spark volatility.

MARKET ANALYSIS
Earnings, Extremes, and the Real Driver

Markets are drifting slightly higher into this week, but the real test is just beginning.
We’re heading into big tech earnings season, and while futures are green this morning, the actual catalyst to watch isn’t trade noise or headlines, it’s earnings delivery from the Magnificent Seven.
So far, 62 S&P 500 companies have reported — and over 85% have beaten expectations. This is statistically strong, with Q2 EPS growth tracking +5% YoY, but here's the key: that growth is heavily skewed.
According to FactSet, the Magnificent Seven are projected to post +14% EPS growth this quarter, compared to just +3.4% from the other 493 companies. That means this week’s results from Alphabet and Tesla will disproportionately influence market tone and index direction.
Meanwhile, tariff rhetoric resurfaced over the weekend, with the White House reiterating a hardline stance heading into August. But from a market structure lens, this is noise, not signal unless it escalates sharply, earnings will drive outcomes this week.
Technically, the S&P 500 and Nasdaq are sitting at all-time highs, and we’re entering this reporting period with frothy sentiment and limited margin for error. Any major disappointments from the leaders could trigger sharp reactions, especially with implied volatility still compressed.
What we’re watching:
Whether earnings justify current valuation multiples, especially in tech
The reaction, not the results as a “beat and drop” could signal exhaustion
Leadership rotation beneath the surface if mega-cap growth stumbles
🧠 The trend remains intact but the burden of proof is on the bulls to defend these prices through earnings.
Nasdaq
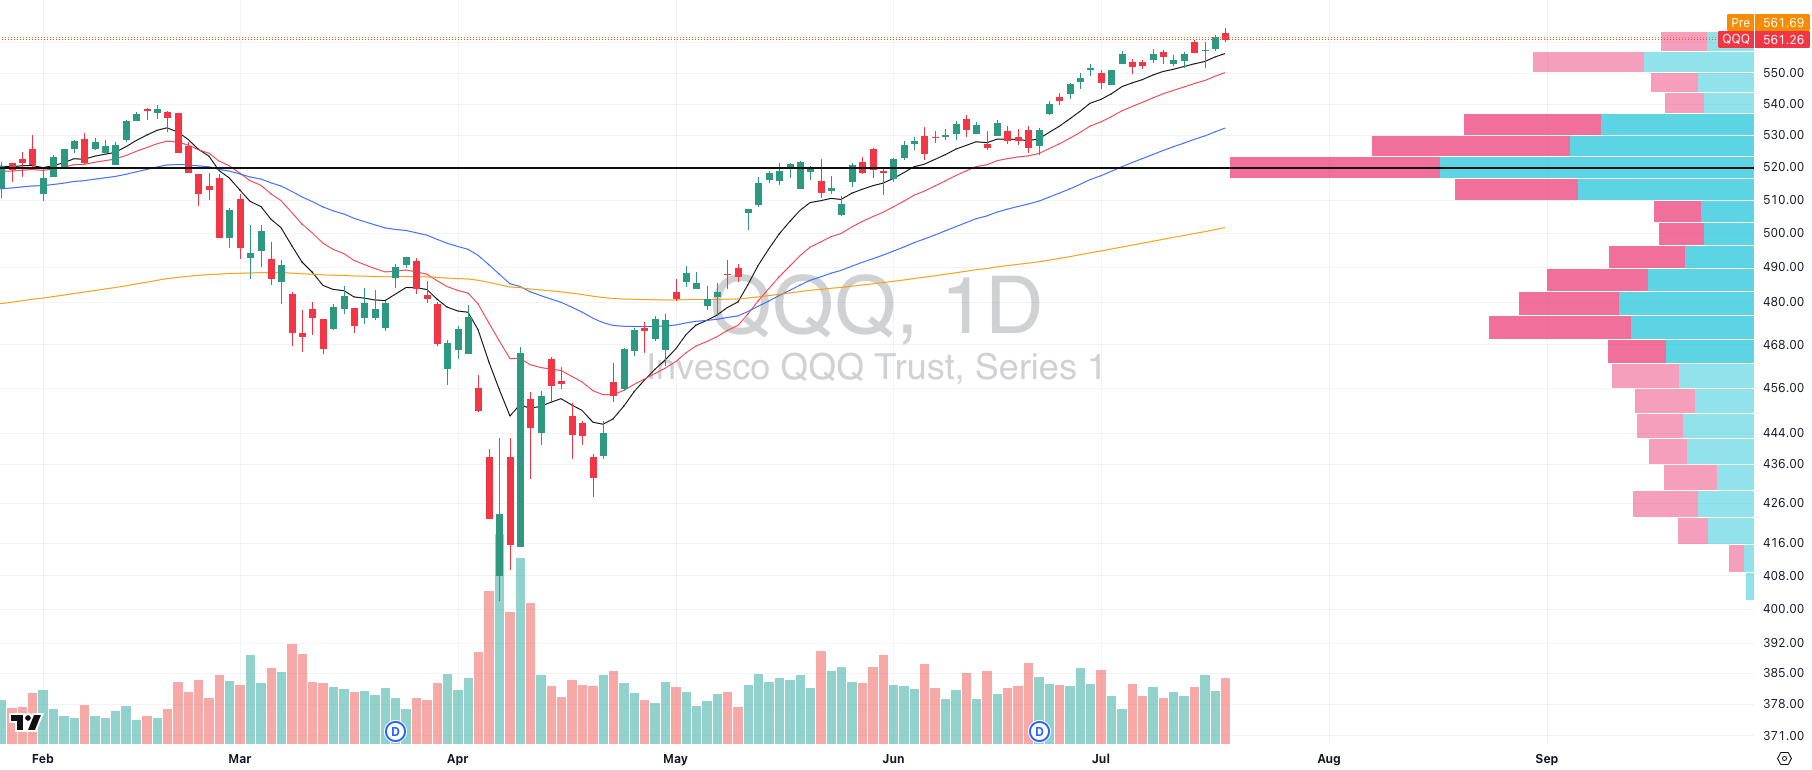
QQQ VRVP Daily Chart
Despite Friday’s red candle on elevated relative volume, the QQQ posted what was effectively a neutral doji, holding the prior day’s gains and maintaining its tight consolidation. Structurally, this appears to be nothing more than healthy digestion at highs, following a very strong run from late June through mid-July.
The technical posture remains dominant: QQQ is still leading all major indices, and we’re not seeing any signs of meaningful distribution. Volume has remained elevated, but not in a way that suggests aggressive selling, it’s consistent with consolidation near highs.
📆 This Week: High Stakes
This week will be critical, with Big Tech earnings (Alphabet, Tesla, etc.) kicking off. These names make up a significant portion of QQQ’s weighting and are core to the broader AI-led trade- arguably the strongest thematic driver of this entire market leg.
🧠 Why This Matters:
Nearly every major momentum theme- AI, cloud, semiconductors, and software- is concentrated in QQQ. Whether or not the current uptrend continues in size will largely be determined by how these earnings are received.
S&P 400 Midcap
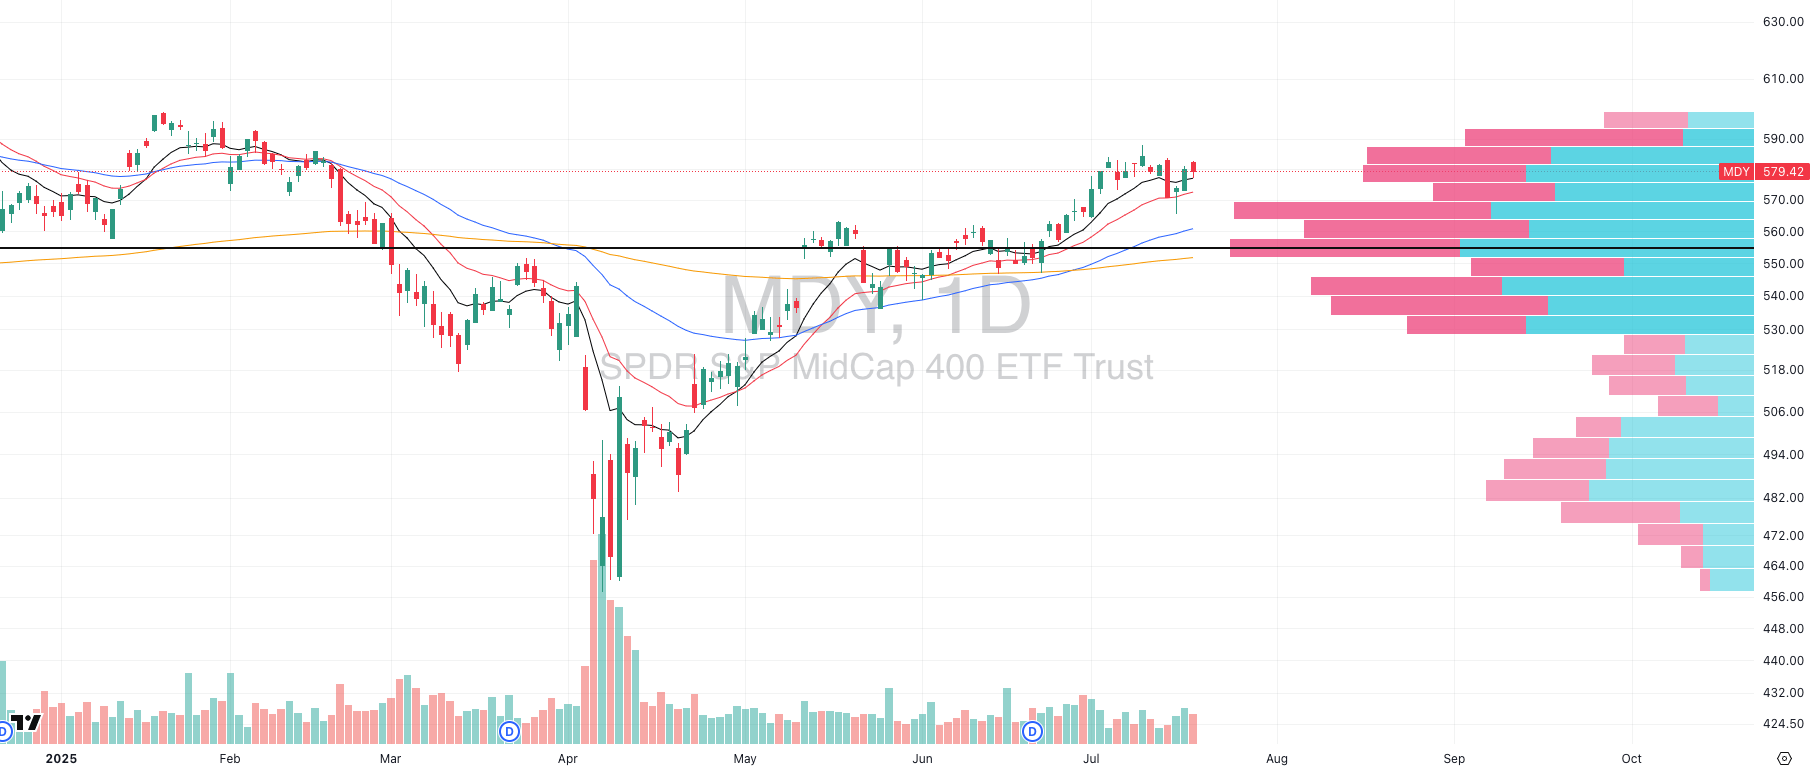
MDY VRVP Daily Chart
Midcaps continue to tread water failing to generate meaningful upside momentum on Friday despite a broad market bounce. That said, there’s one key technical development worth highlighting: the $578 level, previously a major resistance on the Visible Range Volume Profile (VRVP), held as support.
This is not insignificant. Turning prior resistance into support is classic Stage 2 behavior, and Friday’s bounce off that level, despite lackluster overall volume, keeps the uptrend intact for now. It’s also a reason we aren’t bearish here, even though midcaps are clearly lagging relative to large- and mega-caps.
📊 What’s Missing?
What we haven’t seen yet is decisive demand stepping in to push MDY through the dense overhead supply, which still stretches from roughly $578 to $590. Without strong breadth or volume expansion, this segment remains vulnerable to rotation or stagnation, particularly with Big Tech earnings looming this week.
🧠 Strategic Note:
In environments like this, where prior resistance is being retested as support but upside momentum is muted, patience is the edge. The base-building structure is healthy, but conviction will require volume so dont chop your account up here.
Russell 2000
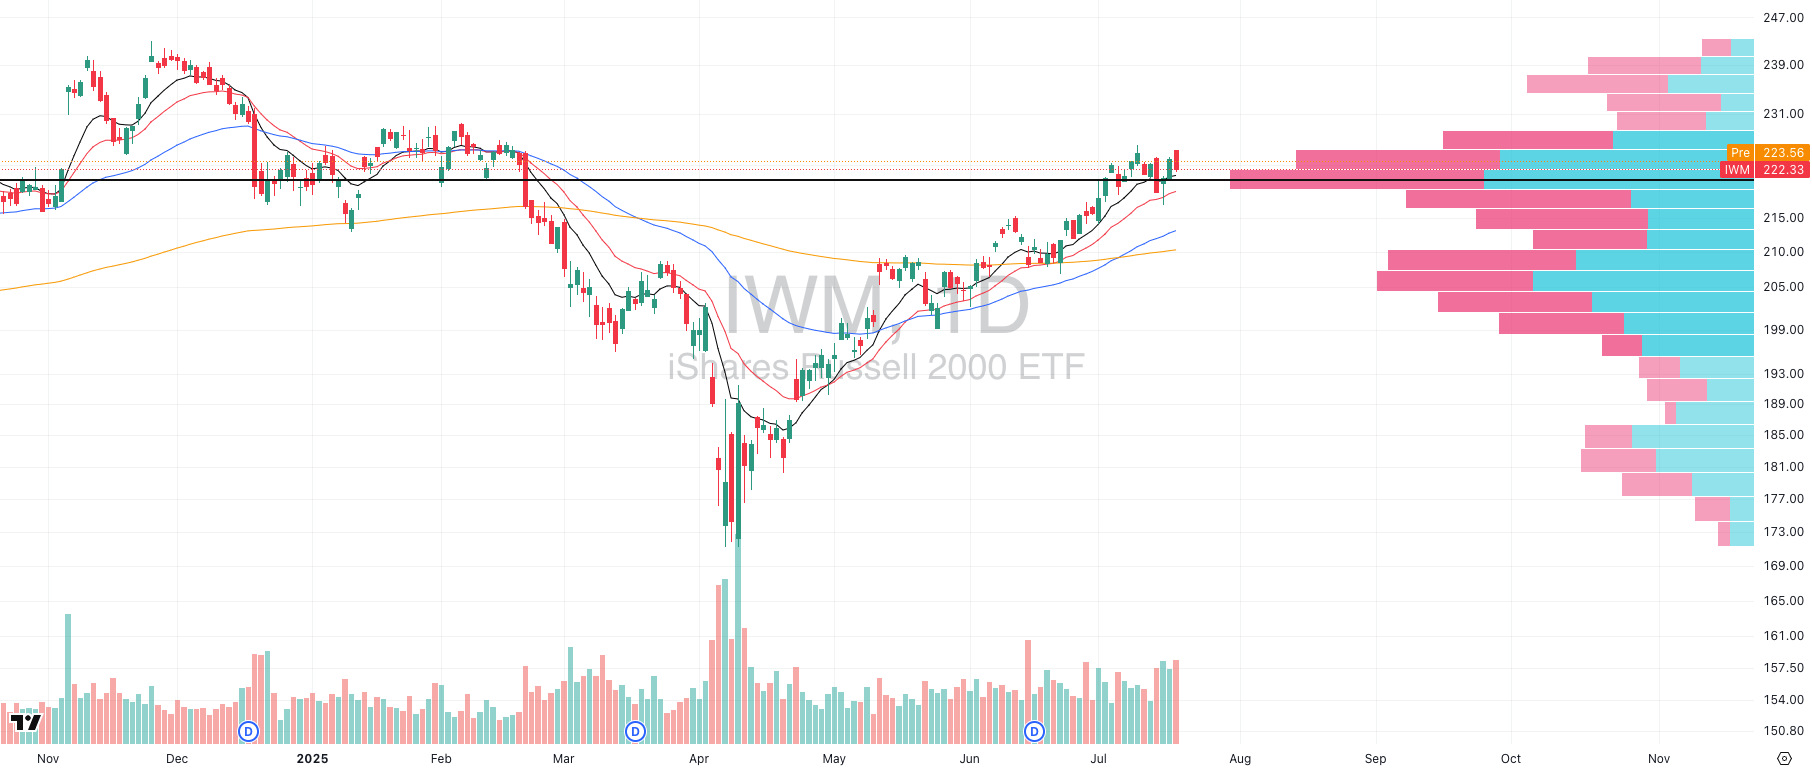
IWM VRVP Daily Chart
Small caps attempted a breakout over the $226 level on Friday but were firmly rejected on high relative volume, signaling strong profit-taking at a well-known supply zone. If you look left on the Visible Range Volume Profile (VRVP), this exact level acted as heavy resistance between December 2024 and March 2025, marking it as a historically important battleground.
We’re not seeing a breakdown, but we are in a delicate chop zone where consolidation risk is high. The rising 10-day EMA sits around $221, which is the next key support level to monitor for a potential retest. Until we break meaningfully above $226, expect volatility within this band.
🧠 Candlestick Edge: Last week’s Tuesday–Thursday Morning Star pattern remains valid and should not be ignored. According to Thomas Bulkowski’s exhaustive candlestick research:
Morning Star has a 78% historical success rate as a bullish reversal.
It ranks 12th out of 103 for overall effectiveness.
It's particularly reliable in choppy pullback phases, like the one we’re in now.
The context matters: we’ve seen no major trend violation, and moving averages are still being respected, but the burden of proof remains on the bulls to push IWM cleanly above this dense supply.
Stop Drowning in Market News. Focus On Making Money.

Every day: 847 financial headlines, 2,300 Reddit stock mentions, 156 Twitter trading threads, 12 IPO updates, 94 crypto developments.
Your problem isn't lack of information; you have too much.
While you're scanning headlines wondering what matters, profitable trades slip by. The signal gets buried in noise.
What if someone did the heavy lifting for you?
Stocks & Income reads everything:
Twitter traders
Reddit buzz
IPO announcements
Crypto insider takes
Crowdfunding opportunities
Market news
Then we send you only what can actually move your portfolio.
No fluff. No useless news. Just actionable stock insights in 5 minutes.
We track every source so you don't have to. You get the 3-5 opportunities worth your time, delivered daily.
Stop wasting time on useless “investing news” and start thinking critically about real opportunities in the stock market.
Stocks & Income is for informational purposes only and is not intended to be used as investment advice. Do your own research.
FOCUSED STOCK
ALAB: Semiconductors Pushing Again?
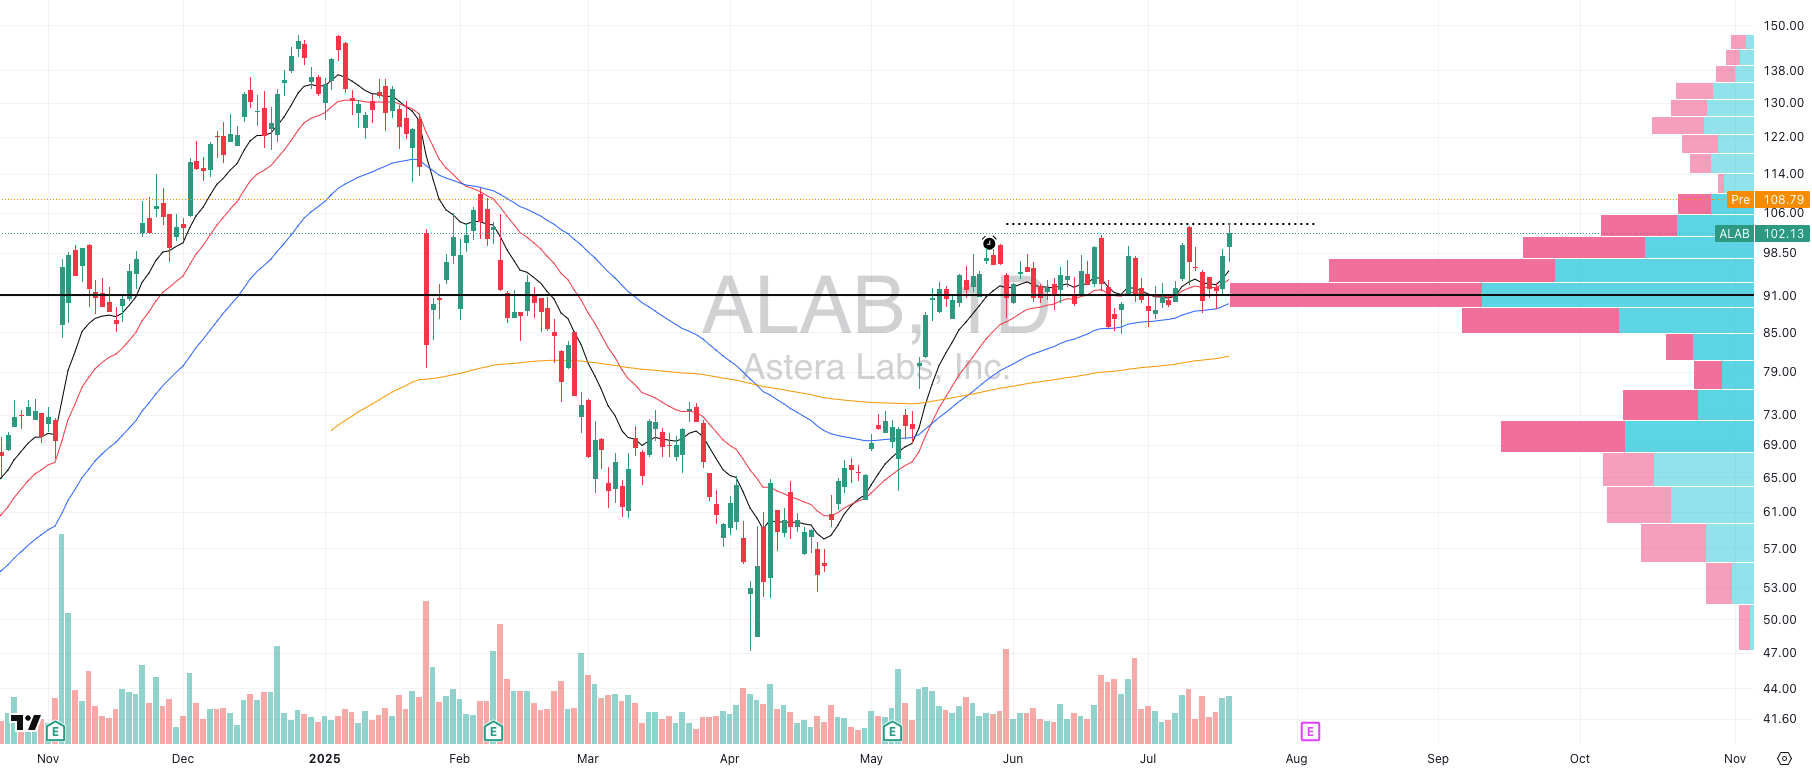
ALAB VRVP Daily Chart
Unless you’ve been living under a rock, you’re well aware that AI and semiconductor leadership has reasserted itself as the dominant trade of the last few weeks. Among the standouts, ALAB is beginning to look like a potential next leg Stage 2 continuation.
After forming a textbook cup-and-handle base stretching back to May (post-earnings), ALAB broke above its Point of Control (POC) last Thursday, signaling renewed institutional interest. The structure here is strong: a clean multi-month base, constructive consolidation, and breakout on solid volume.
🚀 What’s happening now: ALAB is gapping up into a low-volume zone, potentially setting the stage for price discovery and expansion if it can clear today’s opening range. This is a key area to watch as many breakout moves stall or fake out on the first gap-up unless they confirm with intraday follow-through.
⚠️ Execution Tip: Don’t blindly chase the gap. Let ALAB prove it wants higher by establishing a strong ORH (Opening Range High) and holding above (we use the 5-min). Use that structure as your pivot- the true edge is in waiting for confirmation, not guessing at continuation.
FOCUSED GROUP
XLU: Major Utilities Breakout
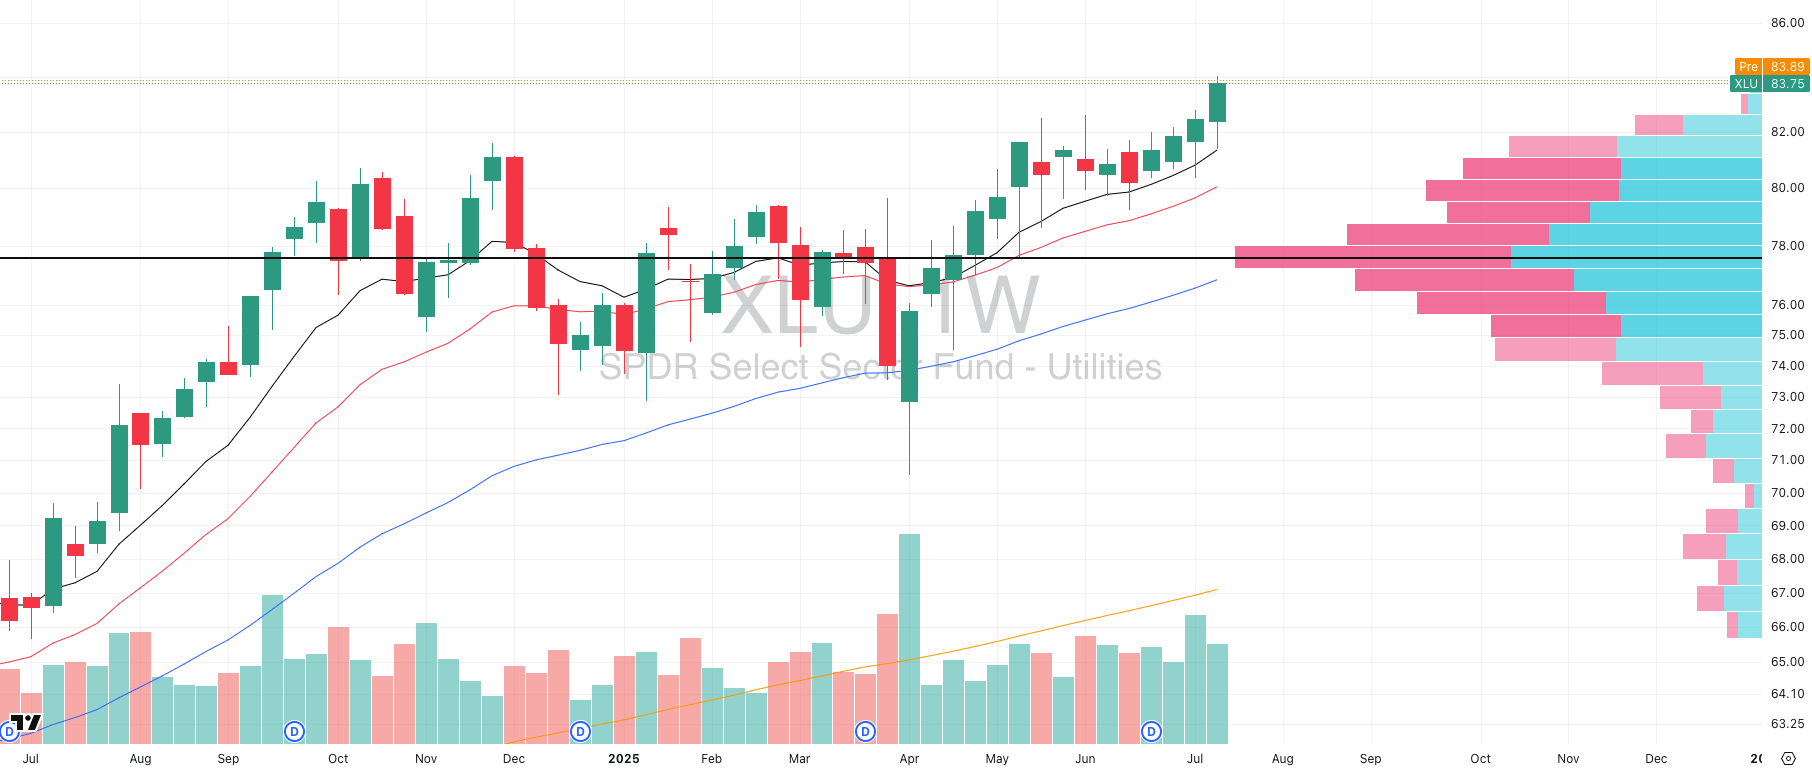
XLU VRVP Weekly Chart
The Utilities sector (XLU) has quietly re-emerged as one of the more technically interesting groups, and it’s doing so with confirmation from both price action and volume behavior.
After breaking out in April 2025 alongside most other sectors during the market-wide bottoming and capitalization rotation, Utilities led briefly into early May before stalling into a wide, choppy consolidation.
We didn’t see volatility contract during this time, and volume remained elevated and erratic, which usually signals two things:
Passive money staying put (not selling),
Institutional positioning shifting beneath the surface.
Last week, that changed. XLU printed a sharp rally off its rising 10-week EMA- a level it tested intraweek- with relative volume expanding meaningfully. That kind of volume-backed bounce out of a broad base typically marks the start of acceleration rather than just another chop cycle.
🧠 Contextual Insight: Utilities tend to attract flows in rate-sensitive or volatility-fading environments.

Q&A
Got a trading question? Hit reply and ask!
Q: “Why wait for breakout confirmation when you could accumulate during the base?”
🔍 1. The Illusion of Pre-Breakout Accumulation
When a stock is consolidating tightly, whether forming a VCP, a base-on-base, or a standard flat base, there is no statistical guarantee it will break higher. In fact, according to our discretionary backtested breakout dataset (4,000+ trades from 2019–2024 using volatility-adjusted bases):
Only ~39% of tight contraction patterns resulted in a successful breakout within the next 15 sessions.
Of those, just 26% produced a move greater than +10% without first faking out or undercutting the range.
Contrast this with confirmed breakout setups, where:
Win rate rises to ~47–51%, depending on volume and breadth confirmation.
Risk-adjusted returns (R-multiples) improve dramatically, with average winners reaching +3.1R vs. 1.7R in early-entry plays.
Standard deviation of outcomes tightens post-breakout, meaning more predictable trade behavior and less emotional churn.
📈 2. Signal Strength & Risk Curve Management
Entering early in a base means you are assuming event risk without the signal. This introduces negative asymmetry:
You're risking capital before the probability has improved.
There's no momentum yet. Liquidity is thin, slippage risk is higher, and stop placements become ambiguous.
Chop zones (inside the base) have historically shown a stop-out rate of 2.6x higher than entries triggered on breakout above prior highs with volume confirmation.
From a math perspective, early entries mean you’re multiplying your base win rate (already sub-50%) by a second uncertainty filter (i.e., will it even break out?). That’s compounding uncertainty.
In short: you’re reducing your expected value (EV) even further:

If you enter early:
WinRate drops from ~40% → ~25–30%
AvgWin contracts
AvgLoss increases (because you often get shaken out before the real move even begins)
The EV collapses.
🧠 3. Why Breakouts Win Over Time
The breakout isn’t just a trigger, it’s a filter and a confirmation that buyers are stepping in, that volume has shifted, and that the market has made a decision. If you think about breakouts as conditional probability triggers, then the job of the trader is to respond to that conditional signal, not anticipate it.
It’s the difference between trying to call the coin flip, vs waiting until the coin is already 80% of the way to the ground and seeing the outcome form in real time.
And yes, the best systems we’ve seen and built are designed around fewer trades, tighter criteria, and real confirmation.
✔️ Breakouts give you cleaner setups with tighter risk.
✔️ Predicting breakouts is statistically inferior — both in win rate and payoff ratio.
✔️ Entering in the base opens you up to chop, slippage, drawdown, and failure without signal.
✔️ In a low-win-rate system like ours, signal quality is everything.
This is the kind of logic behind how we structure the Swingly PRO entries. We’d rather take 10 A+ setups than 50 C+ ones because the system isn’t just built for action, it’s built for edge.
Want the full breakdown, trade reviews, and complete daily setups in real time?
That’s all inside Swingly Pro → see what’s included
Reply