- Swingly
- Posts
- This Selloff Isn’t Finished
This Selloff Isn’t Finished

MARKET ANALYSIS
What You Need To Know

Oil remains the dominant macro force this morning, and the market is making it clear that the latest intervention has not materially eased immediate pressure.
The International Energy Agency agreed to release 400 million barrels from emergency reserves (the largest coordinated release on record) yet Brent Crude still pushed back toward the $100 area, which tells you traders are still pricing real supply disruption rather than simply reacting to policy headlines.
The reason that release failed to calm markets is because reserve supply helps with timing, but it does not solve the core issue, which remains disruption around the Strait of Hormuz.
As long as shipping routes remain vulnerable and vessel attacks continue, crude will continue carrying a geopolitical premium.
The United States also announced an additional 172 million barrel release from its Strategic Petroleum Reserve, but markets largely looked through that as well because the release is spread over roughly 120 days, meaning the near-term supply stress remains unresolved.
For equities, the implication is straightforward: once oil remains elevated, the pressure spreads quickly beyond the energy complex itself. Transport costs rise, airline fuel costs rise, logistics costs rise, and margin pressure begins feeding into broader earnings expectations.
February inflation data came in exactly where expected, with CPI rising 0.3% month-on-month and 2.4% year-on-year, while core inflation also held steady. Under normal conditions that would likely have been interpreted as mildly constructive because inflation is no longer worsening.
The reason markets largely ignored the inflation print is because it already feels dated. The data reflects conditions before the latest oil spike fully entered the system, which means traders are far more focused on what the next inflation print could look like if energy prices remain elevated.
In practical terms, inflation is stable for now, but energy has reintroduced uncertainty into the next phase of inflation expectations, which limits how much relief the CPI report can offer.
At the same time, trade risk has returned quietly to the macro backdrop. The Trump administration has launched fresh Section 301 investigations targeting major trade partners including China, European Union, Japan, India and Vietnam.
These are investigations rather than immediate tariffs, but markets understand that renewed trade friction matters more when global supply chains are already dealing with elevated energy costs.
What markets are now trying to absorb is a combination that is rarely easy to price cleanly: rising oil, geopolitical instability, and fresh trade uncertainty all at the same time.
The one important observation beneath all of this is that equities still are not showing true capitulation behavior. There is weakness, but there is not disorderly liquidation, which suggests institutional selling remains controlled for now.
For now, macro explains why rallies continue to struggle, but it still does not justify aggressive conviction either way. Until oil either stabilizes meaningfully or volatility expands much more decisively, expect markets to remain highly reactive and difficult to trust intraday.
Nasdaq
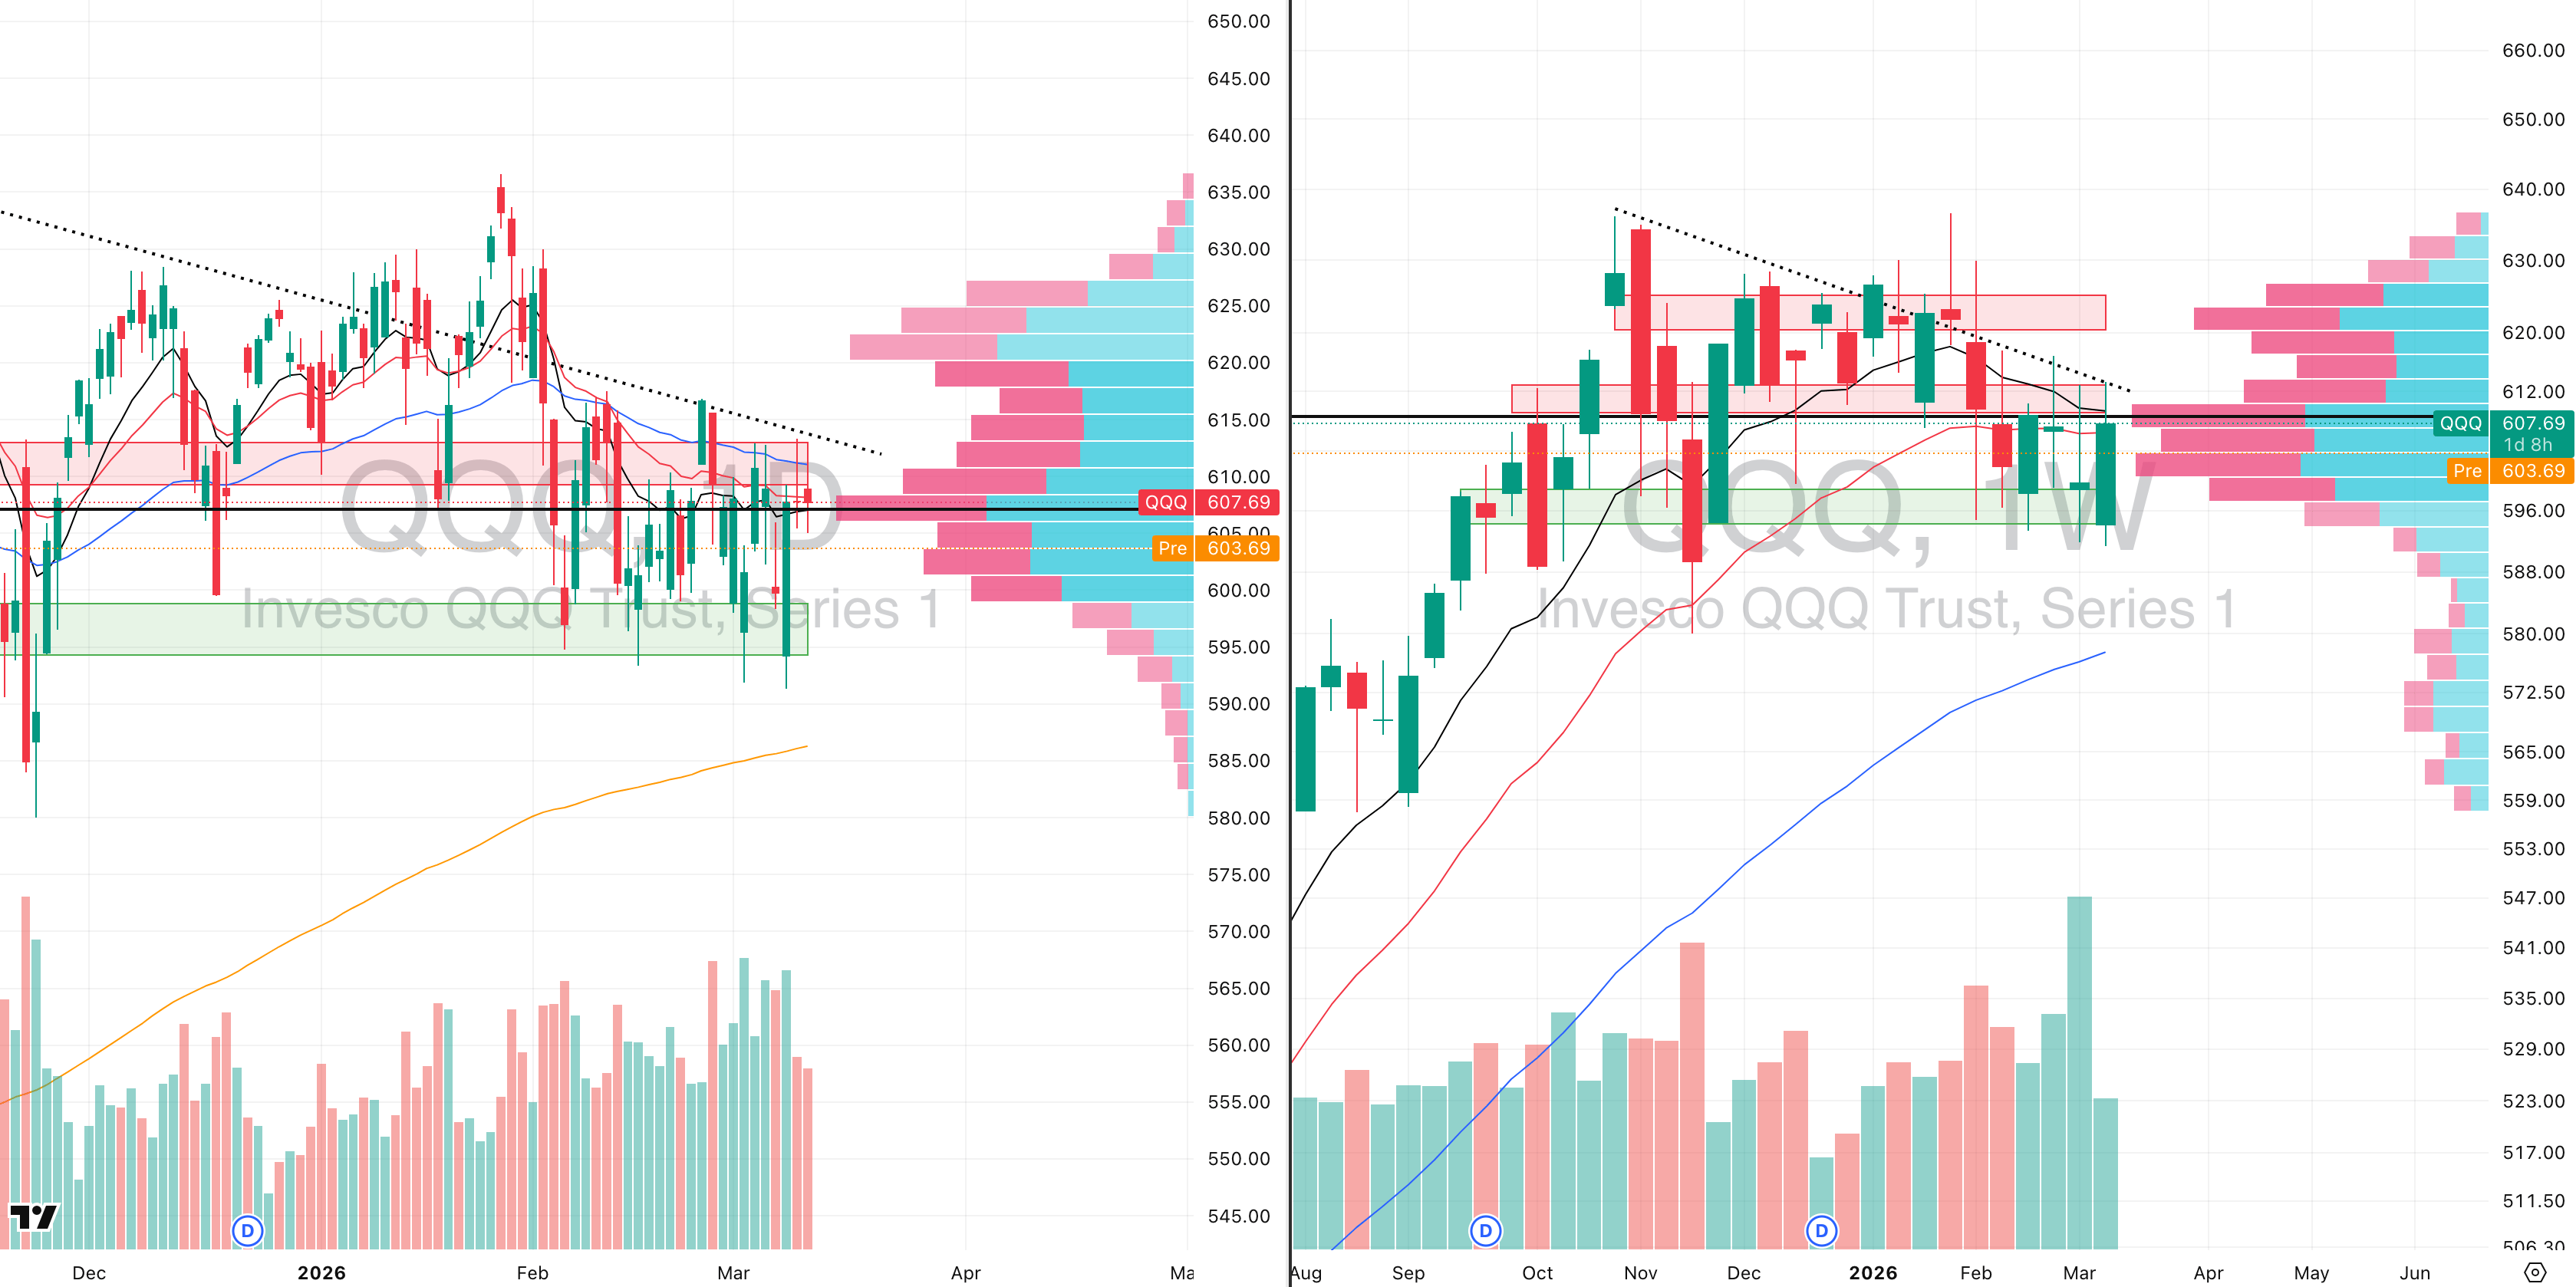
QQQ VRVP Daily & Weekly Chart
41.58%: over 20 EMA | 41.58%: over 50 EMA | 46.53%: over 200 EMA
The QQQ delivered the expected rejection at $613, which remains the most important technical ceiling in the current structure because that level is not just a short-term resistance point and it is the same descending resistance line that has now been in place since the highs of October 2025, giving us roughly 126 trading days of repeated rejection.
That level continues to matter because every meaningful rally attempt into it has failed, and yesterday once again reinforced that sellers are still active whenever price pushes into that zone.
We also closed once again below the declining 10-week EMA, which remains one of the clearest signals that the broader intermediate trend has still not been reclaimed.
One important nuance, however, is that relative volume has actually declined over the last two rejection sessions. That matters because although we still expect downside continuation, declining volume on rejection tells you the sell pressure is not accelerating aggressively.
In practical terms, that keeps the market in a limbo state: weak enough to still lean lower, but not yet showing the kind of heavy expansion that normally confirms a much steeper breakdown.
Our downside target remains unchanged at $596, which is the clearest nearby demand zone and now also aligns with the demand shelf that has repeatedly held since the beginning of February 2026.
That represents roughly 2% downside, and notably part of that unwind is already beginning to show in pre-market trading.
So far, price is still holding reasonably well relative to the rest of the market, and that remains the most important top-down observation: from a breadth perspective, the QQQ continues to materially outperform every other capitalization segment.
S&P 400 Midcap
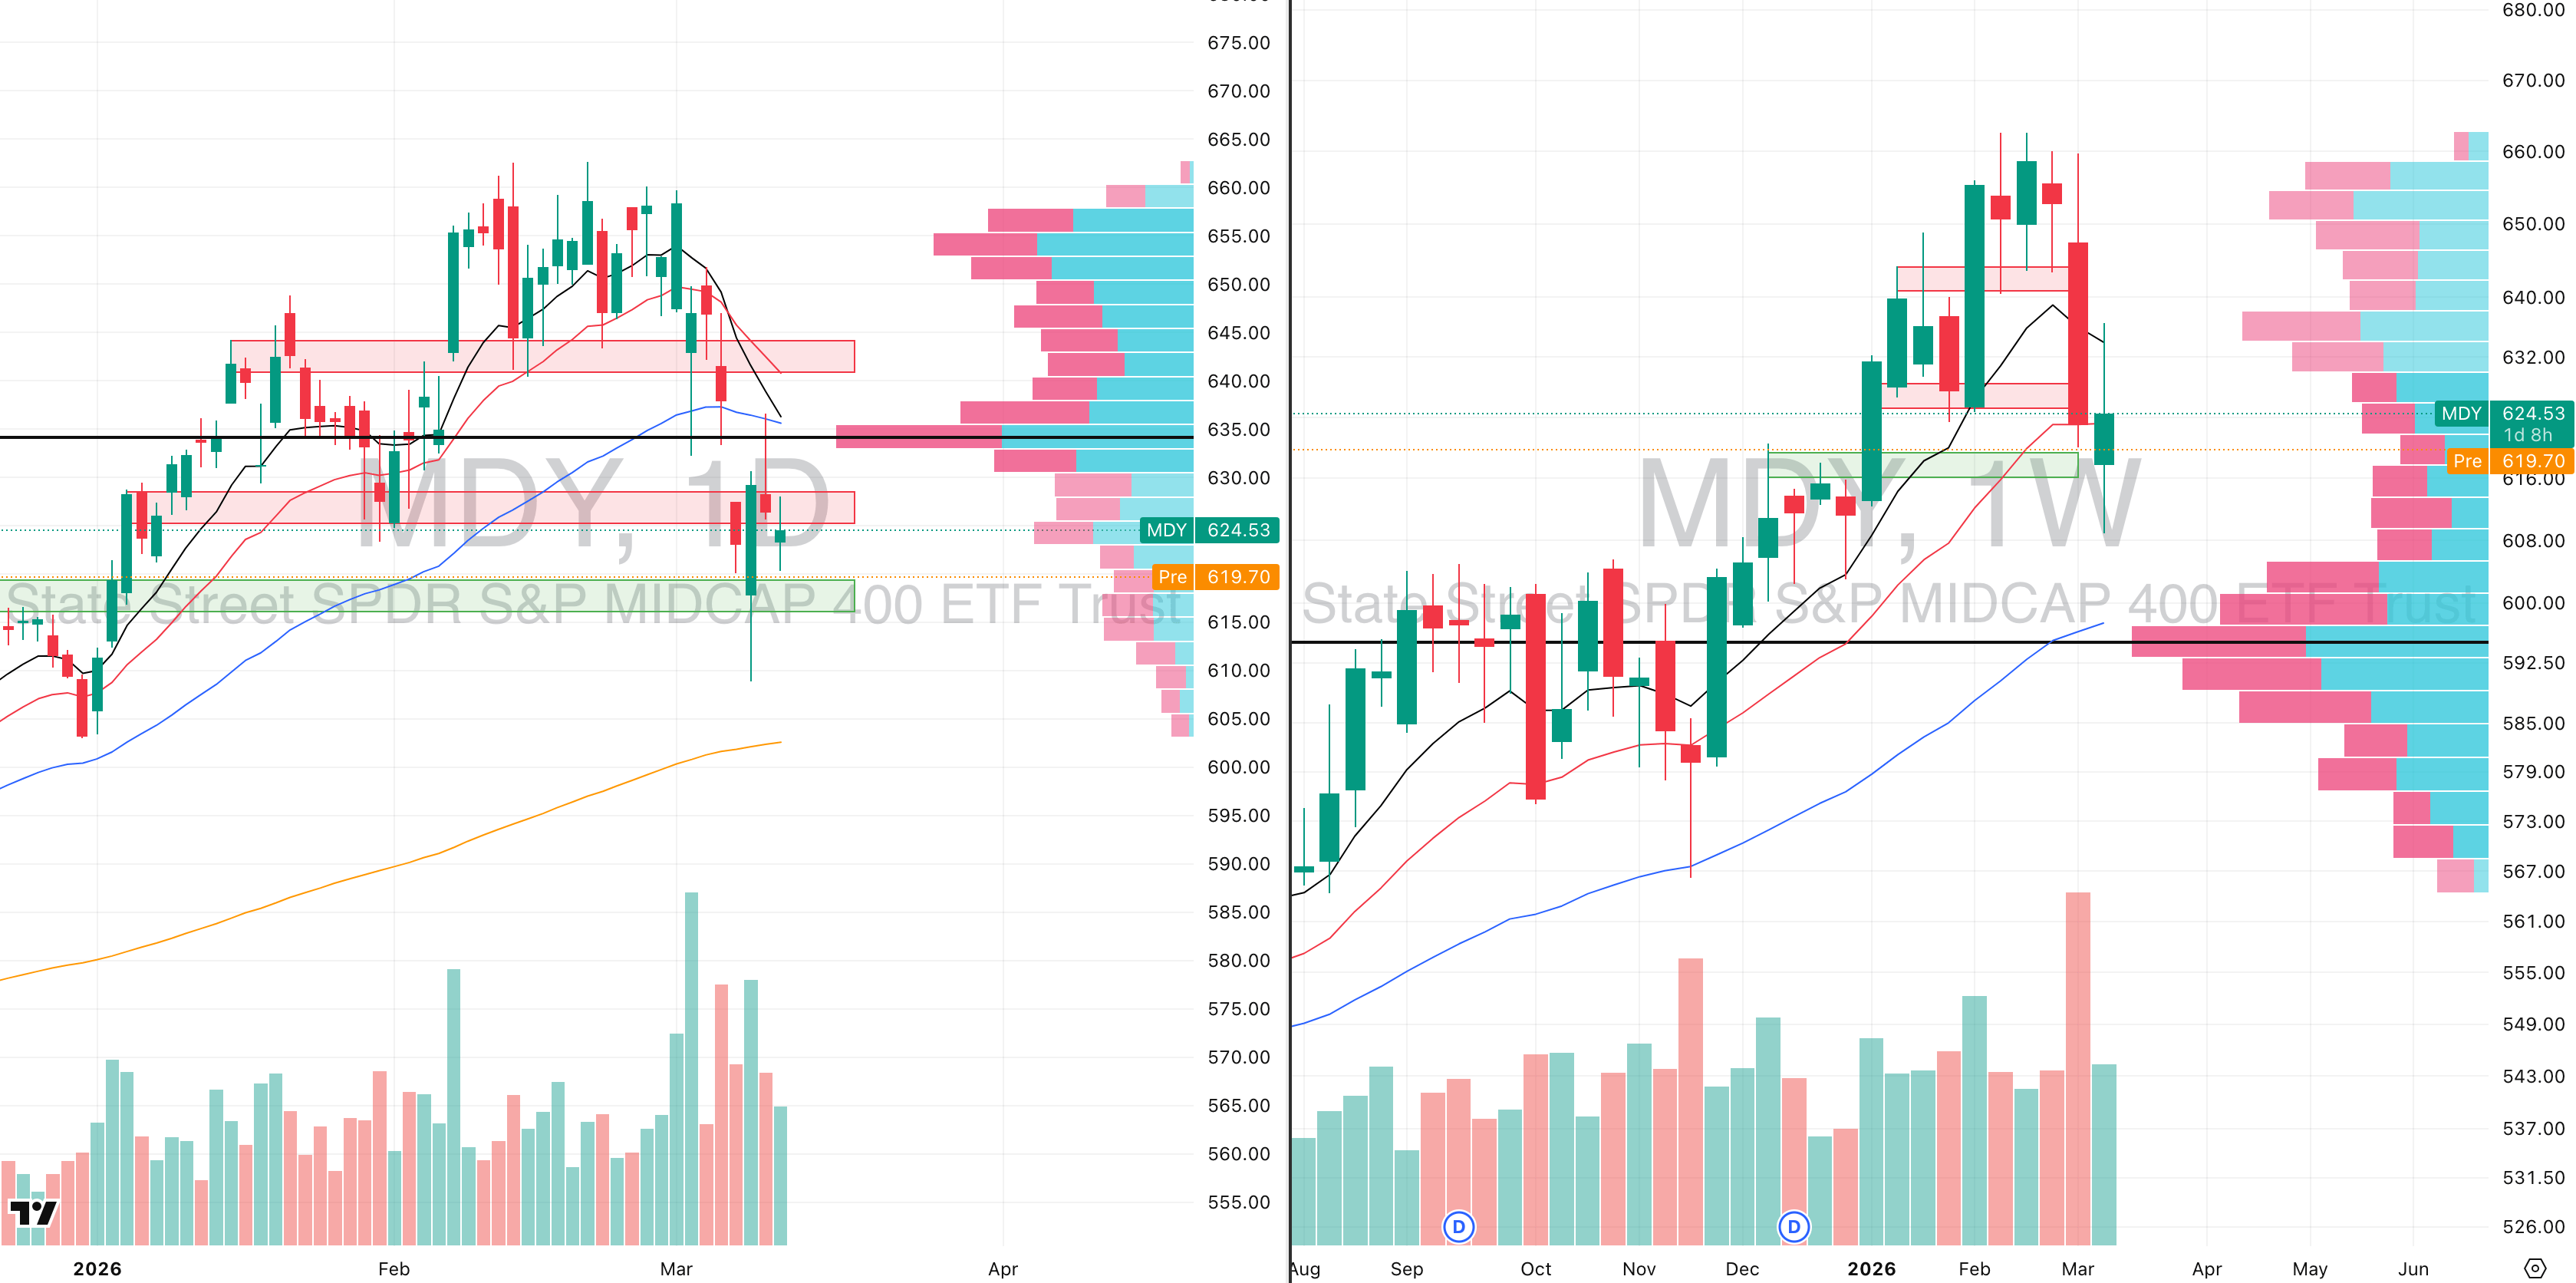
MDY VRVP Daily & Weekly Chart
20.75%: over 20 EMA | 31.75%: over 50 EMA | 50.25%: over 200 EMA
The MDY continues to show exactly the kind of weakness we expected after the aggressive selloff two sessions ago, with yesterday’s move simply extending that downside pressure back toward $615, which was the level we outlined as the natural short-term target.
The reason that move was relatively straightforward to anticipate is because the ADR% continues expanding sharply, meaning daily candle ranges remain unusually elevated and volatility is still dominating the mid-cap structure.
More importantly, there was effectively no evidence of buyers willing to hold price near $635, where every attempt at stabilization immediately failed.
The key short-term nuance now is breadth: the MDY is extremely stretched to the downside.
At present, only 21% of stocks inside the mid-cap complex are above their 20-day EMA, which is historically the type of reading where short-term mean reversion often begins to appear.
That does not automatically mean it is time to become aggressively long, but it does mean the market is now entering territory where downside becomes increasingly crowded in the short term.
For that reason, we do expect a bounce to attempt to develop around $615, simply because that level now combines technical support with very stretched breadth conditions.
Russell 2000
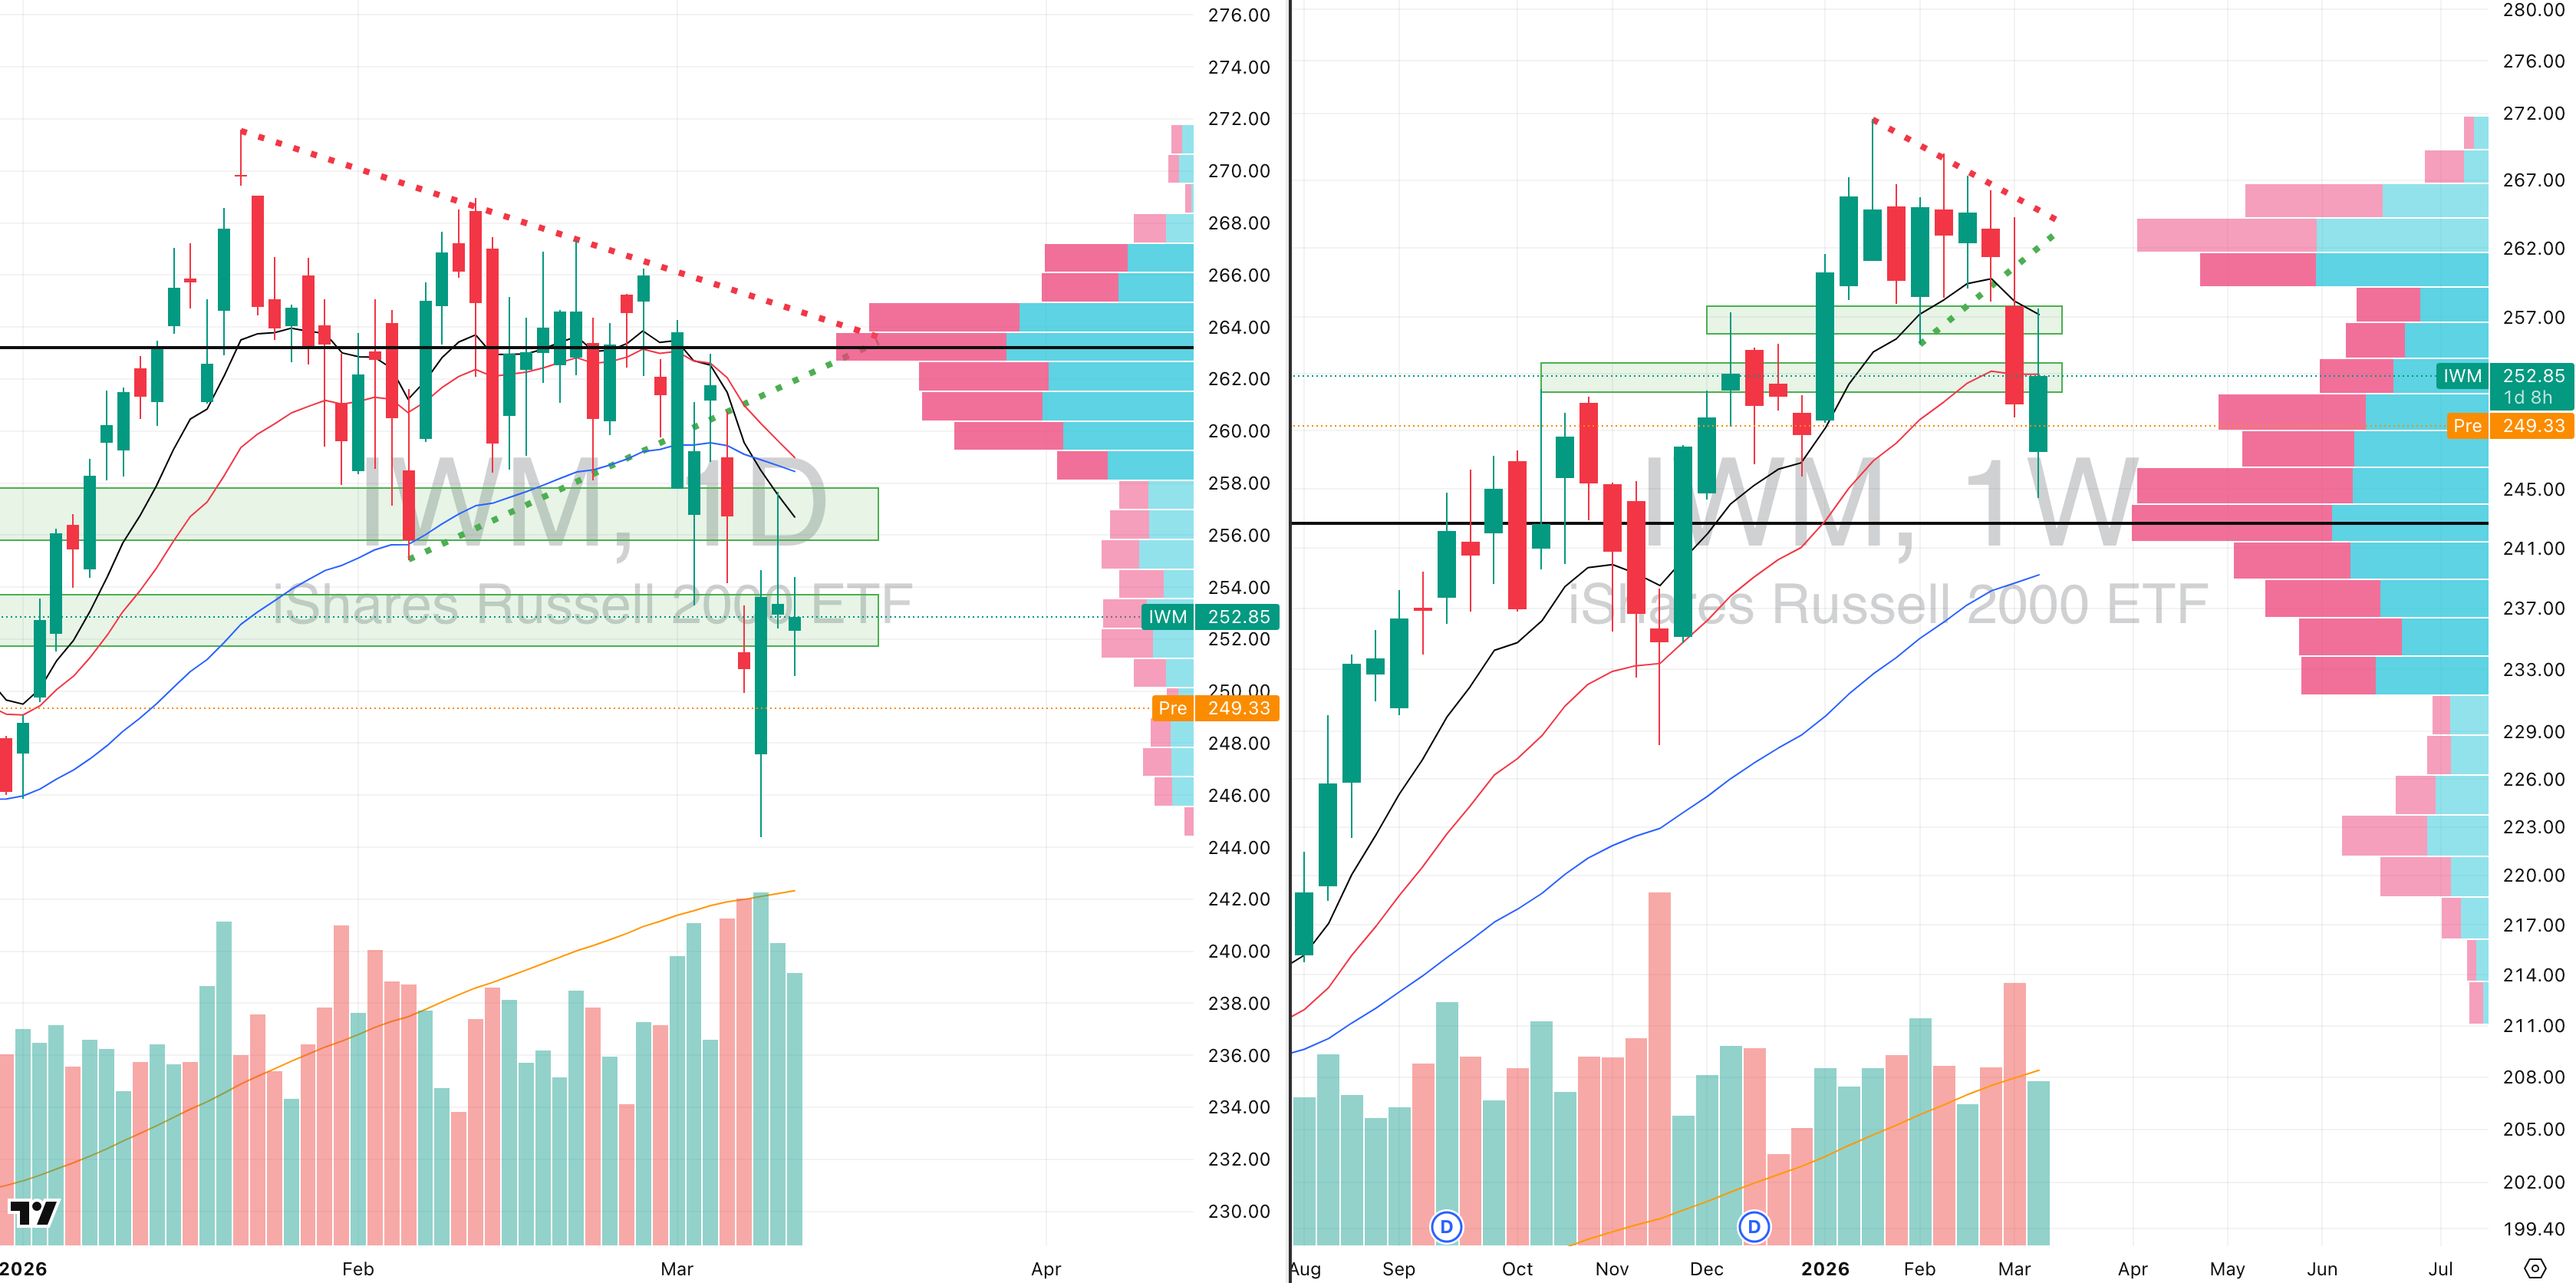
IWM VRVP Daily & Weekly Chart
28.69%: over 20 EMA | 32.81%: over 50 EMA | 51.27%: over 200 EMA
The small caps continue to mirror the MDY almost perfectly, with very similar structural weakness and the same inability to sustain any upside attempt.
Our immediate downside target remains the weekly point of control near $243, which implies roughly 2.1% additional downside from current levels.
The most important technical takeaway remains how consistently price is being rejected at the fast moving averages.
On the daily structure, price continues failing against the 100 EMA, while on the weekly structure the 10-week and 20-week EMAs are also acting as very clean ceilings.
In addition, even though daily volume itself is not expanding aggressively, volatility remains extremely elevated because ATR percentages on these candles continue running far above normal.
That tells you the market remains unstable even without heavy participation.
Like the MDY, we do expect much of today’s gap weakness to be filled intraday simply because the Russell is also becoming stretched enough to produce short-term bounce behavior.
The difference is that breadth in the IWM still sits at roughly 29% of stocks above the 20 EMA, which means it remains oversold, but not yet as extreme as what we are seeing in mid caps.
FOCUSED STOCK
COIN: Crypto Trades Back on The Table
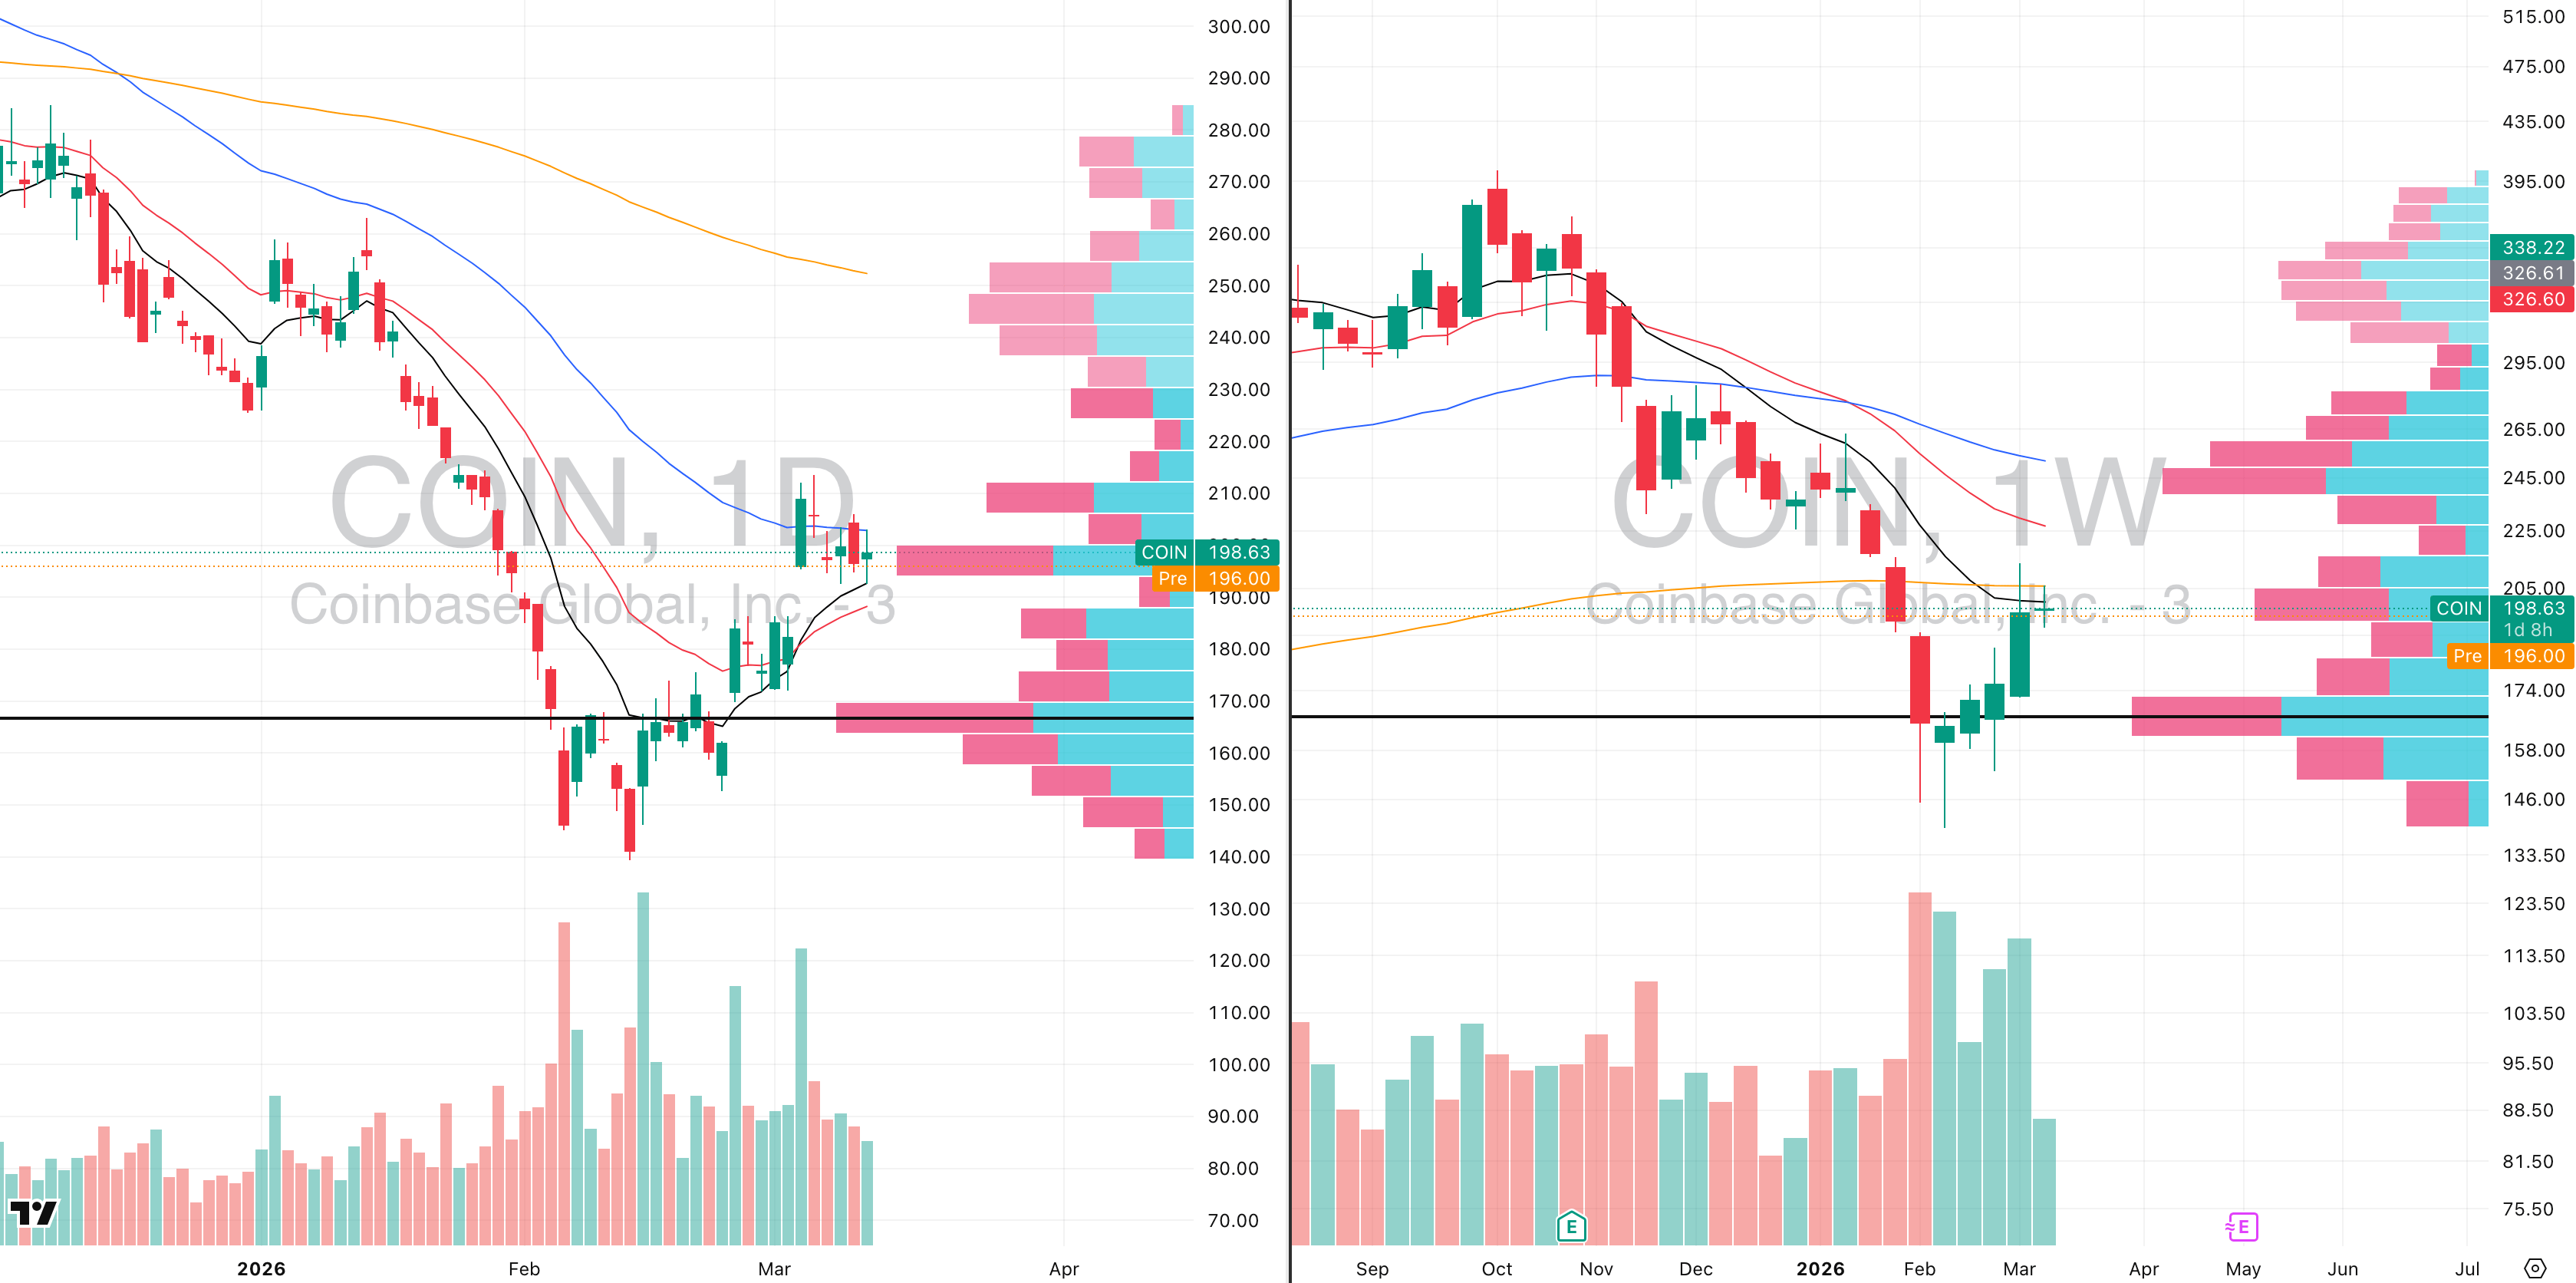
CON VRVP Daily & Weekly Chart
ADR%: 6.97% | Off 52-week high: -55.3% | Above 52-week low: +42.5%
Coinbase Global becomes increasingly interesting here because the recent improvement in crypto flows is now beginning to translate into cleaner technical behavior on the stock itself.
With major inflows returning into crypto, Coinbase naturally remains one of the first equities to reflect that change in sentiment.
Technically, the stock is beginning to tighten in a way that increasingly resembles a potential cup-and-handle structure on the daily chart, which is important because it suggests price is attempting to stabilize after a prolonged corrective phase.
In the short term, however, we still believe the downside gap toward $188 remains likely to be filled before any more meaningful expansion occurs.
That gap fill matters because it would complete the natural retracement inside the current contraction while bringing price back toward a much cleaner risk area.
Right now, Coinbase is contracting directly below the 200-week EMA at $209, while still holding above the 20-day EMA and above that $188 gap-fill zone.
That creates a very clean technical compression where price is effectively trapped between major higher-timeframe resistance and short-term support.

Did you find value in today's publication?This helps us better design our content for our readers |
Reply