- Swingly
- Posts
- This Rebound Still Doesn’t Look Trustworthy
This Rebound Still Doesn’t Look Trustworthy


MARKET ANALYSIS
What You Need To Know

The macro backdrop remains dominated by oil, and that is still the key variable driving short-term equity sentiment. After Monday’s brief reprieve, crude has turned higher again this morning, with Brent back above $100 and WTI pushing back toward the mid-$90s as the market reassesses just how realistic a U.S.-led coalition to protect shipping through the Strait of Hormuz actually is.
That is important because the market was beginning to price in the possibility that Monday’s pullback in oil marked the start of some stabilization. Instead, what we are seeing now is that the relief was temporary.
Several allies appear hesitant to commit, Trump himself admitted some countries are “less than enthusiastic,” and that uncertainty is enough to push energy back higher and keep pressure on risk assets.
The real macro issue is no longer just crude itself. It is refined products. Diesel has now moved above $5 per gallon in the United States for the first time since late 2022, and that matters far more for the real economy than many traders appreciate.
Diesel sits at the centre of freight, agriculture, logistics, and industrial transport, so once that starts moving aggressively, the inflation impulse travels much faster through the system.
That is why this current oil shock is more problematic than a normal commodity spike. The market is not just dealing with higher crude. It is dealing with supply disruptions in exactly the grades and refined products that are most important for diesel, jet fuel, and freight markets.
That makes the inflation risk much stickier than a simple headline move in Brent or WTI might suggest.
This also comes at a very awkward time for central banks. The Federal Reserve begins its two-day meeting today, and just as inflation had been showing signs of moderation, energy is now reintroducing a fresh source of uncertainty.
Markets are still overwhelmingly pricing no change in rates, but the path toward cuts is becoming much less clean if fuel costs remain elevated.
Equity futures reflect that tension. Futures are basically flat this morning despite Monday’s rebound, which tells you the market is not comfortable extending risk aggressively while oil is resuming higher. In other words, yesterday’s bounce did not create confidence. It simply relieved some immediate pressure for a few hours.
The more constructive offset this week continues to come from AI. Nvidia’s GTC event was important because Jensen Huang defended the long-term AI buildout narrative as his guidance at around $1 trillion in Blackwell and Vera Rubin orders through 2027, alongside new initiatives in autonomous driving, orbital data centres, and AI infrastructure, reinforces the idea that AI capex demand is not rolling over.
That matters because it gives the market one of the few large-scale growth narratives that still has real earnings and spending power behind it. You can already see that in premarket price action, where Nvidia remains firm, Micron is higher, and several AI-adjacent names continue to attract buyers even while the broader macro backdrop remains difficult.
There is also a notable divergence beginning to emerge beneath the surface of the market. Bitcoin and broader crypto have been acting much more resiliently than equities, oil-sensitive assets, and even in some cases gold.
That does not mean crypto is suddenly risk-free, but it is notable when one of the most volatile global asset groups begins to trade with more composure than equities during a geopolitical stress window.
On the corporate side, you are also seeing very selective evidence that the market still wants to reward operational strength. Delta raising revenue guidance despite higher fuel costs is a good example of that. It tells you that demand has not collapsed across the real economy, even if macro risks are rising.
The broader takeaway is that the market is still trying to balance two competing forces. On one side, you have higher oil, geopolitical uncertainty, and a central bank backdrop that is getting more complicated again.
On the other side, you still have resilient earnings in parts of the economy, a very powerful AI spending cycle, and early signs that some of the most beaten-down risk areas are starting to stabilize.
For now, oil remains the swing factor. If energy continues to grind higher, it will keep pressure on equities and especially on anything rate-sensitive or margin-sensitive.
If it stabilizes, the market has enough oversold conditions and enough surviving leadership in AI and crypto to support a technical rebound. That is why this remains a market where macro is still setting the tone, but the quality of internal leadership is becoming increasingly important.
Nasdaq
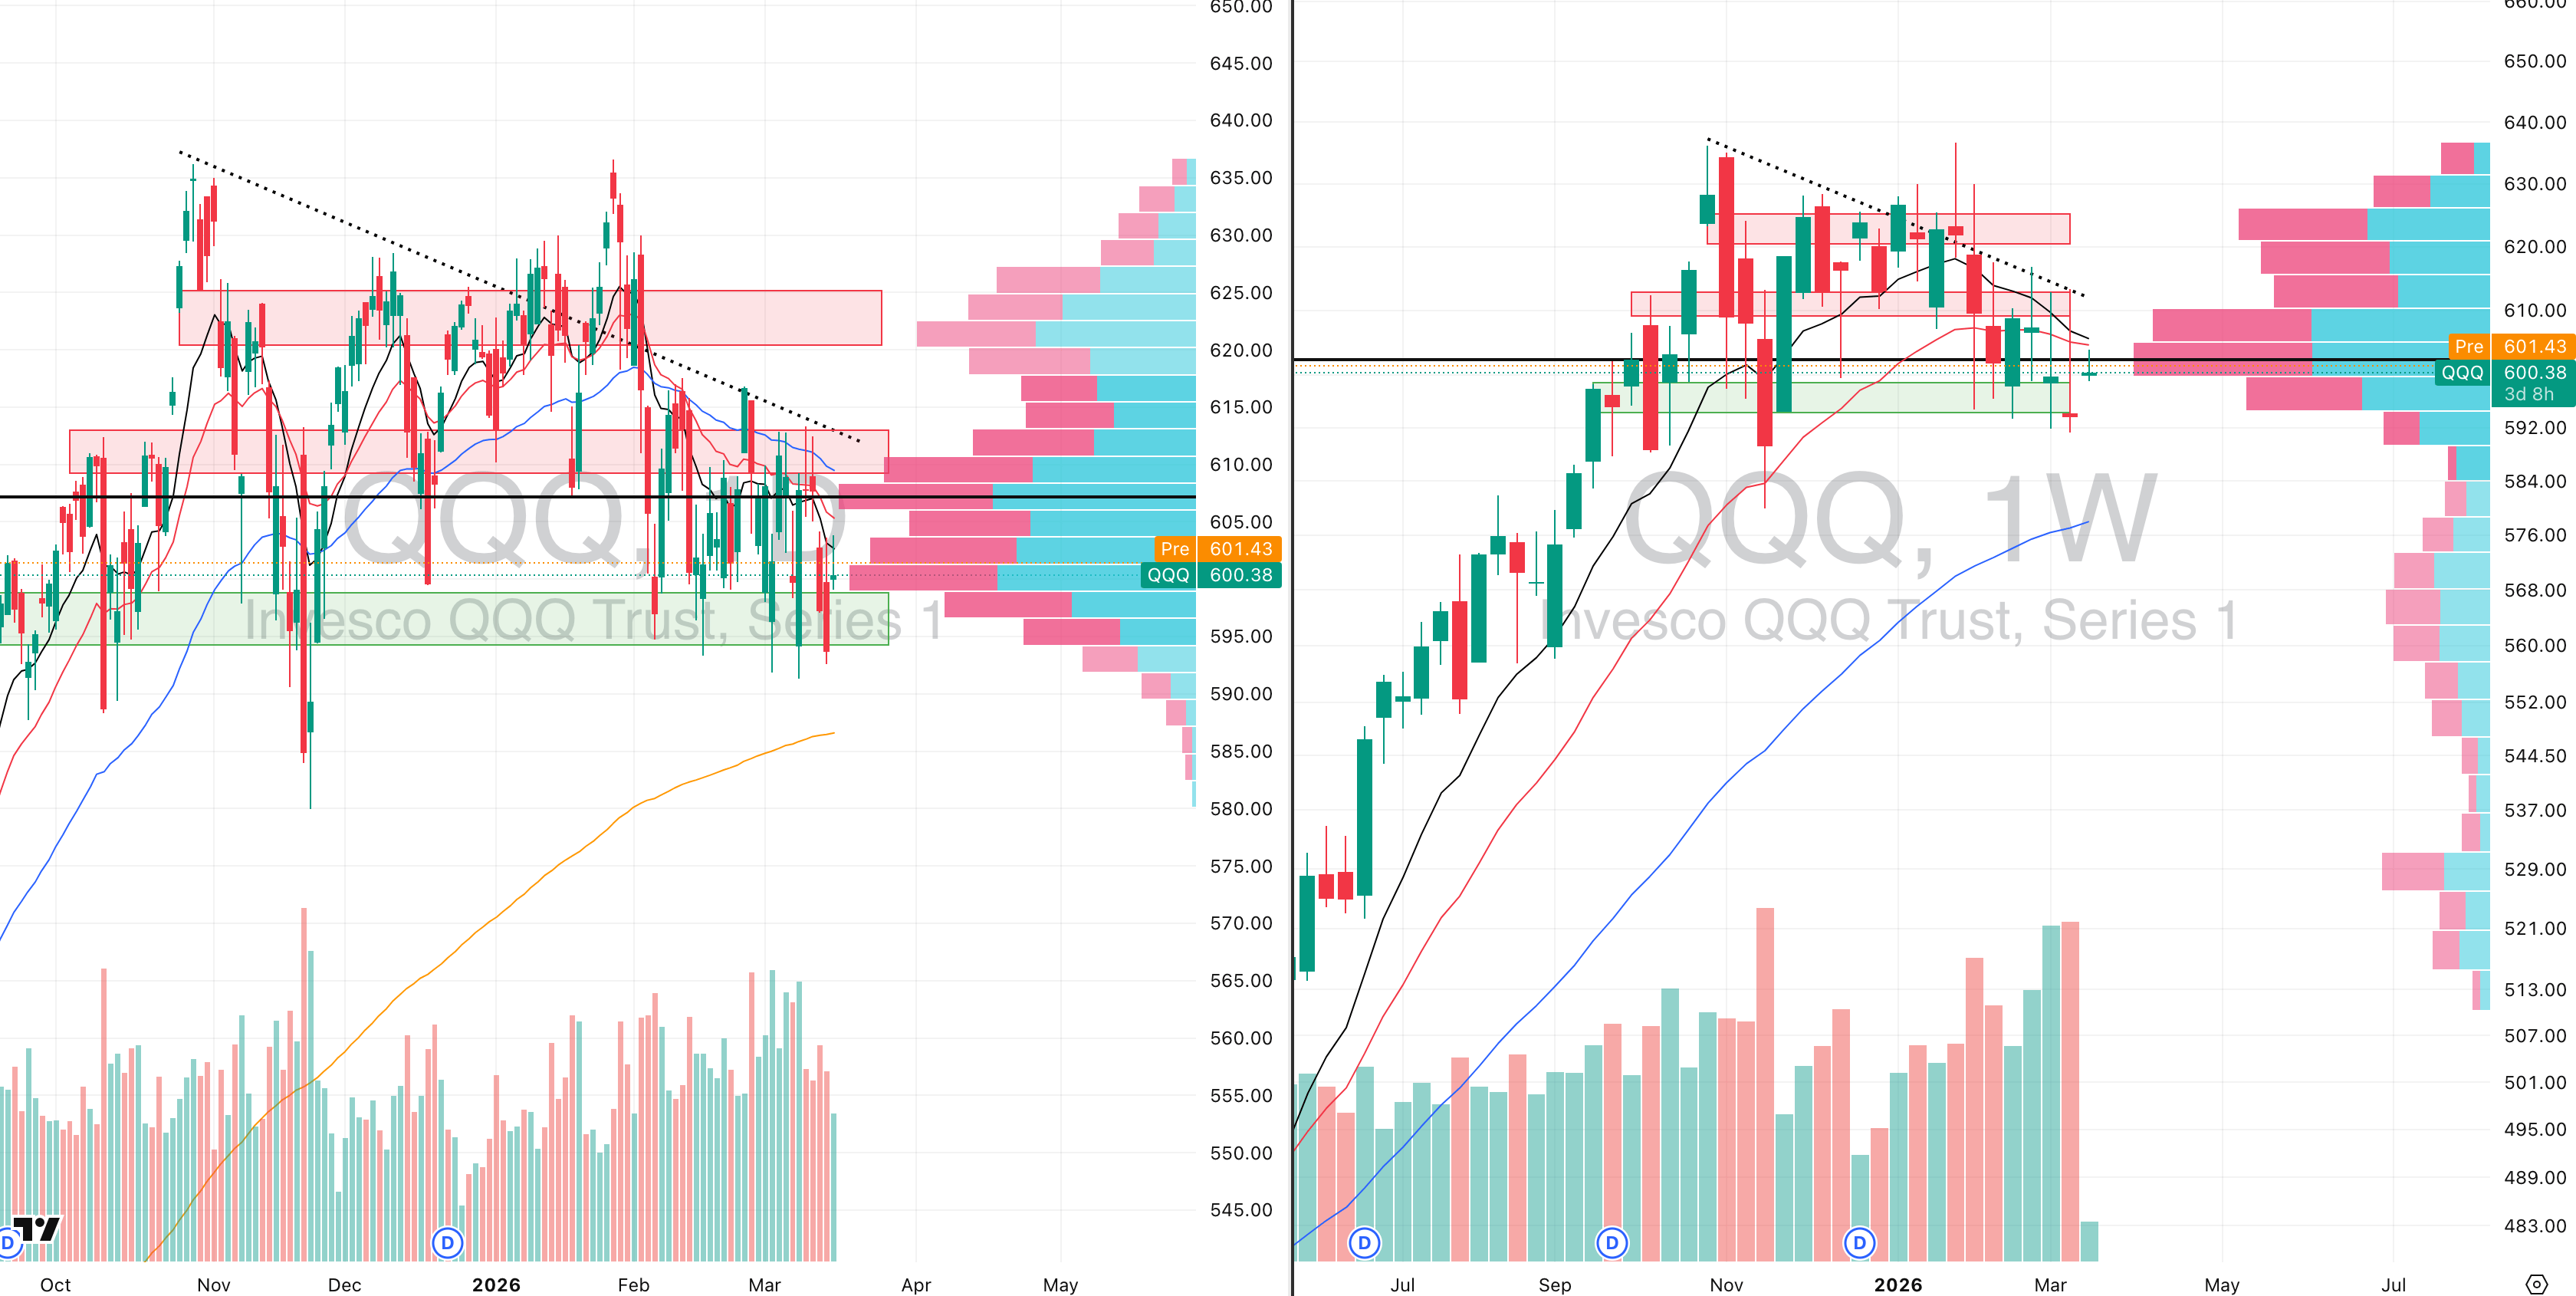
QQQ VRVP Daily & Weekly Chart
29.70%: over 20 EMA | 30.69%: over 50 EMA | 45.54%: over 200 EMA
The QQQ rejected the declining 10-day EMA again yesterday, while also failing once more at the same declining 10- and 20-week EMA cluster that has capped every meaningful bounce attempt.
That makes it two consecutive sessions of rejection from the same area, and more importantly it keeps the weekly repair process from becoming anything more than a weak countertrend bounce.
What is interesting is that the rejection came on only about 76% of the 20-day average relative volume. That tells you the selling itself was not especially aggressive yesterday, but it also tells you something else just as important: there is very little real appetite from buyers to press exposure here. In other words, the market is not being rejected by huge active selling alone; it is also failing because there is simply not enough conviction on the long side.
If the last three weeks are any guide, the path of least resistance still appears lower. Each attempt to reclaim the 20-week EMA cluster near 608 has failed, and although the QQQ has managed to hold that 595 demand shelf for over a month now, the longer a level is tested inside a weak trend the less reliable it becomes.
The key issue is that relative volume has expanded on downside pressure over the broader structure, which is much more consistent with distribution than with quiet consolidation. That makes the probability of 595 continuing to hold indefinitely rather low, especially if the broader tape remains under pressure.
For now, the QQQ still has support underneath it, but the burden of proof remains on buyers. Until price can actually reclaim and hold above that 20-week EMA cluster, this remains a weak market bouncing into supply rather than a market rebuilding trend.
S&P 400 Midcap

MDY VRVP Daily & Weekly Chart
17.25%: over 20 EMA | 27.75%: over 50 EMA | 46.75%: over 200 EMA
The QQQ rejected the declining 10-day EMA again yesterday, while also failing once more at the same declining 10- and 20-week EMA cluster that has capped every meaningful bounce attempt. That makes it two consecutive sessions of rejection from the same area, and more importantly it keeps the weekly repair process from becoming anything more than a weak countertrend bounce.
What is interesting is that the rejection came on only about 76% of the 20-day average relative volume. That tells you the selling itself was not especially aggressive yesterday, but it also tells you something else just as important: there is very little real appetite from buyers to press exposure here. In other words, the market is not being rejected by huge active selling alone; it is also failing because there is simply not enough conviction on the long side.
If the last three weeks are any guide, the path of least resistance still appears lower. Each attempt to reclaim the 20-week EMA cluster near 608 has failed, and although the QQQ has managed to hold that 595 demand shelf for over a month now, the longer a level is tested inside a weak trend the less reliable it becomes.
The key issue is that relative volume has expanded on downside pressure over the broader structure, which is much more consistent with distribution than with quiet consolidation. That makes the probability of 595 continuing to hold indefinitely rather low, especially if the broader tape remains under pressure.
For now, the QQQ still has support underneath it, but the burden of proof remains on buyers. Until price can actually reclaim and hold above that 20-week EMA cluster, this remains a weak market bouncing into supply rather than a market rebuilding trend.
Russell 2000

IWM VRVP Daily & Weekly Chart
23.90%: over 20 EMA | 29.22%: over 50 EMA | 48.48%: over 200 EMA
The IWM is showing a similar broad pattern to the mid-caps, even if the structure is a little less severe. We did see a bounce off the point of control near 243 last week, and there has been a slight uptick so far this week, but the more important takeaway is that supply continues to build aggressively into every push higher.
The visible range volume profile makes that very clear. At yesterday’s highs, roughly 7 million shares traded red versus only about 3.88 million shares traded green. That is a substantial imbalance, and it tells you that sellers are still leaning very heavily into rallies rather than being forced to cover.
That type of overhead supply dramatically increases the probability that the IWM continues lower rather than resolving into a clean base. The current bounce may persist for a little while, but it is not showing the kind of volume quality you would want to see if a genuine reversal were underway.
Our base case remains a move lower toward 242, which is where the rising 200-day EMA sits. That implies roughly another 2.9% downside from current levels, and from a structural standpoint that remains the most likely next support zone for price to test.
Just like the broader market, the issue here is not that IWM cannot bounce. It is that rallies are still being sold into, and until that changes, support levels are more likely to be retested than left behind.
FOCUSED STOCK
PLTR: A Cup & Handle Reversal Forming

PLTR VRVP Daily & Weekly Chart
ADR%: 4.20% | Off 52-week high: -26.4% | Above 52-week low: +131.0%
Palantir Technologies is beginning to stand out again because the weekly structure is now developing into what increasingly resembles a cup-and-handle formation.
The most important technical shift is that price has pushed decisively back above the 10-week, 20-week, and 50-week moving averages in one sequence. When a stock reclaims all three of those intermediate trend references together, especially after a multi-week reset, it usually signals that institutional demand is returning rather than simply short covering.
The handle itself is developing through contraction rather than disorder. Relative volume has been declining as price tightens, which is exactly what you want to see inside this type of pattern because it suggests supply is drying up rather than expanding.
In practical terms, that means fewer participants are willing to sell shares even as price compresses near the upper part of the base. That often creates the conditions for a stronger expansion move if the handle resolves higher.
Fundamentally, the immediate bid in Palantir is also understandable. The stock is responding partly to the geopolitical backdrop, because historically names tied to defence infrastructure, intelligence systems, and government-linked software tend to attract capital during periods of military escalation or elevated geopolitical uncertainty.
Unfortunately, what is happening in the Middle East naturally reinforces that narrative. Palantir remains one of the clearest listed vehicles tied to defence-grade data systems, battlefield intelligence architecture, and military software deployment, so capital often rotates there when geopolitical stress rises.
What matters technically is that this strength is not random. It is occurring while much of growth remains under pressure, which immediately makes the relative strength profile more important.
If the current handle continues tightening above these reclaimed weekly moving averages, Palantir remains one of the cleaner higher-quality setups in the market.

Did you find value in today's publication?This helps us better design our content for our readers |
Reply