- Swingly
- Posts
- This Rally Just Became Harder to Fade
This Rally Just Became Harder to Fade
In partnership with

OVERVIEW
🟢 Leadership + Breadth in Sync
Macro: Markets keep grinding higher despite the shutdown. Historical precedent says shutdowns rarely derail trends; the bigger driver is the Fed leaning toward cuts.
Nasdaq: QQQ flipped $602 from resistance to support, while QQQE ripped on strong relative volume. Breadth expansion confirms leadership is broadening.
Midcaps (MDY): Buyers defended $595 with a hammer close. Structure points to a +1.2% move into $607 supply zone.
Small Caps (IWM): Stronger than midcaps. Bounce off the 10-EMA with little supply overhead. A test of $247.50 highs looks likely.
Focused Stock (SHOP): Clean two-month base breakout setup inside leading sector (XLY). Best play: wait out opening volatility, target pullback entries.
Focused Group (XLRE): Real estate quietly coiled for 406 days. Weekly base, declining volume, and rates turning lower set up a powerful breakout above $42.50.

MARKET ANALYSIS
Alignment Across QQQ, MDY, and IWM

Markets continue to climb despite the ongoing government shutdown. All major indexes hit fresh records Thursday, led by another surge in AI giants like Nvidia. Investors appear more focused on momentum than macro risks — at least for now.
Still, the shutdown adds uncertainty. Key economic reports, including the monthly jobs data, are on hold, giving the Federal Reserve less clarity ahead of its October meeting. Treasury officials warn a prolonged standoff could dent growth, while President Trump has floated sweeping federal layoffs.
Historically, shutdowns haven’t derailed markets, and traders seem to be betting that pattern holds. With the S&P 500 up more than 1% this week and AI enthusiasm still running hot, fear of missing out is beating fear of a slowdown.
Nasdaq
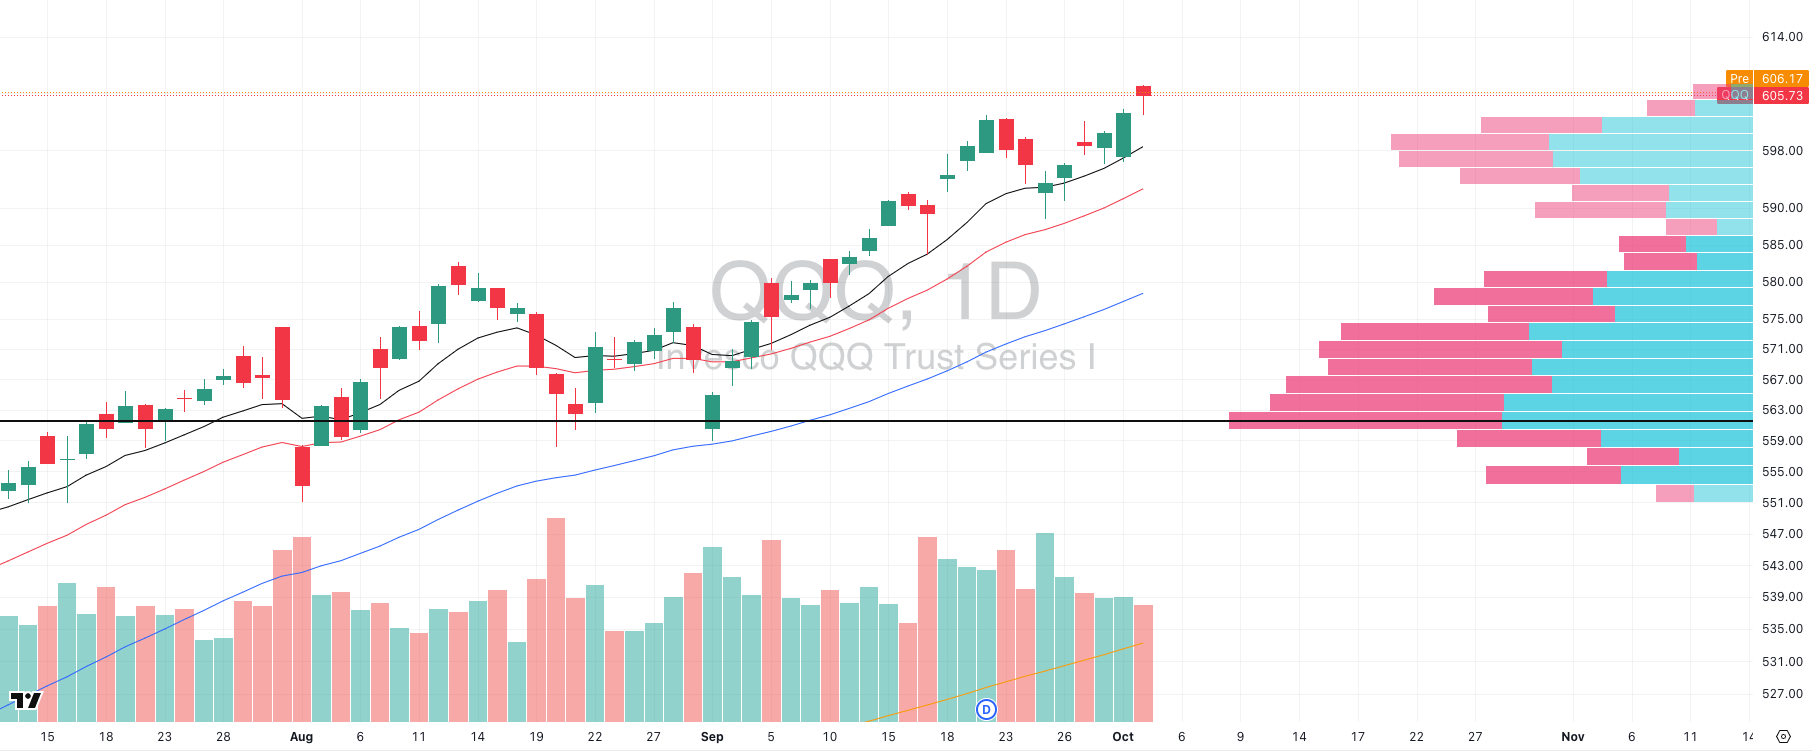
QQQ VRVP Daily Chart
% over 20 EMA: 59.40% | % over 50 EMA: 55.44% | % over 200 EMA: 62.37%
On QQQ, the tape gave us exactly the kind of character change you want to see at highs. The index pulled back intraday to retest the prior resistance zone around $602, consolidated there, and then closed back above it.
What had been a ceiling is now acting as a floor, that’s how strong trends mature.
Volume came in light (89% 20 day average), but that in itself is telling: there was no wave of supply hitting the tape. Sellers tested the level and demand absorbed it cleanly.
QQQE (Equal-Weight Nasdaq)
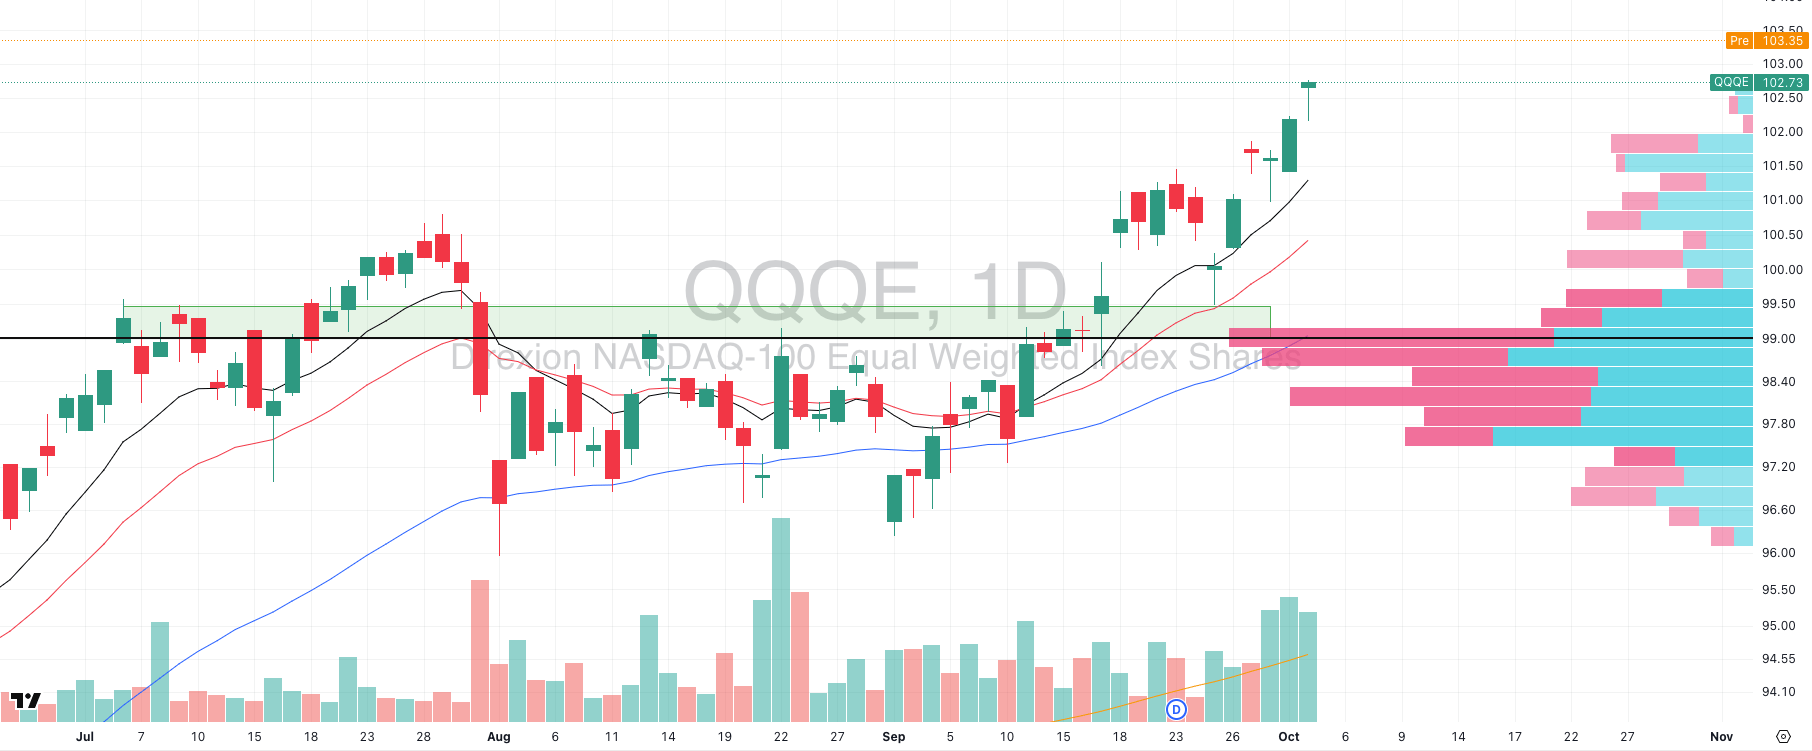
QQQE VRVP Daily Chart
Even more impressive is what’s happening under the surface. QQQE, the equal-weight Nasdaq, ripped higher on strong relative volume, closing with a hammer-style candle at highs.
That’s broad participation, not just the usual handful of mega-caps dragging the index. It tells us the big players are pressing buy programs across the complex, not just in NVDA, MSFT, or AAPL.
Breadth data backs this up: 59.40% of Nasdaq names above their 20 EMA, 55.44% above the 50 EMA, 62.37% above the 200 EMA. That’s meaningful expansion and a sign that leadership is widening.
S&P 400 Midcap
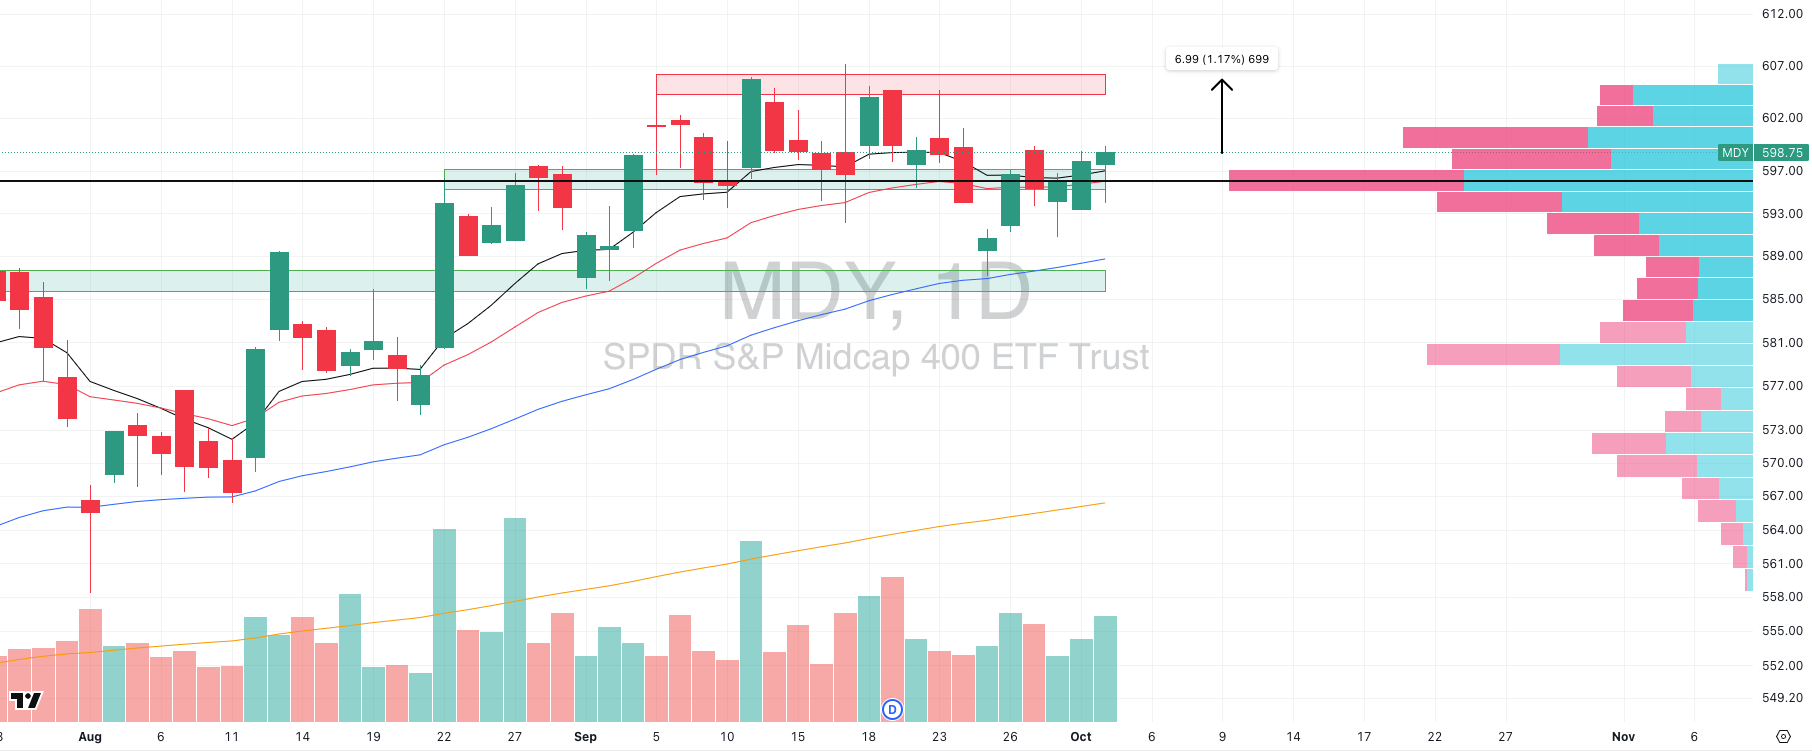
MDY VRVP Daily Chart
% over 20 EMA: 44.13% | % over 50 EMA: 50.62% | % over 200 EMA: 61.59%
The midcaps continue to quietly build out a constructive structure. Yesterday gave us another strong candle as price briefly dipped to $595, but buyers immediately stepped in, reversing the move and closing the day with a green hammer on high relative volume (119% 20 day average).
That intraday rejection turned what could have been a breakdown into confirmation of demand.
MDY still sits firmly above its Point of Control (POC), and structurally the tape points to a likely +1.2% measured move higher into the $607 supply zone.
Russell 2000
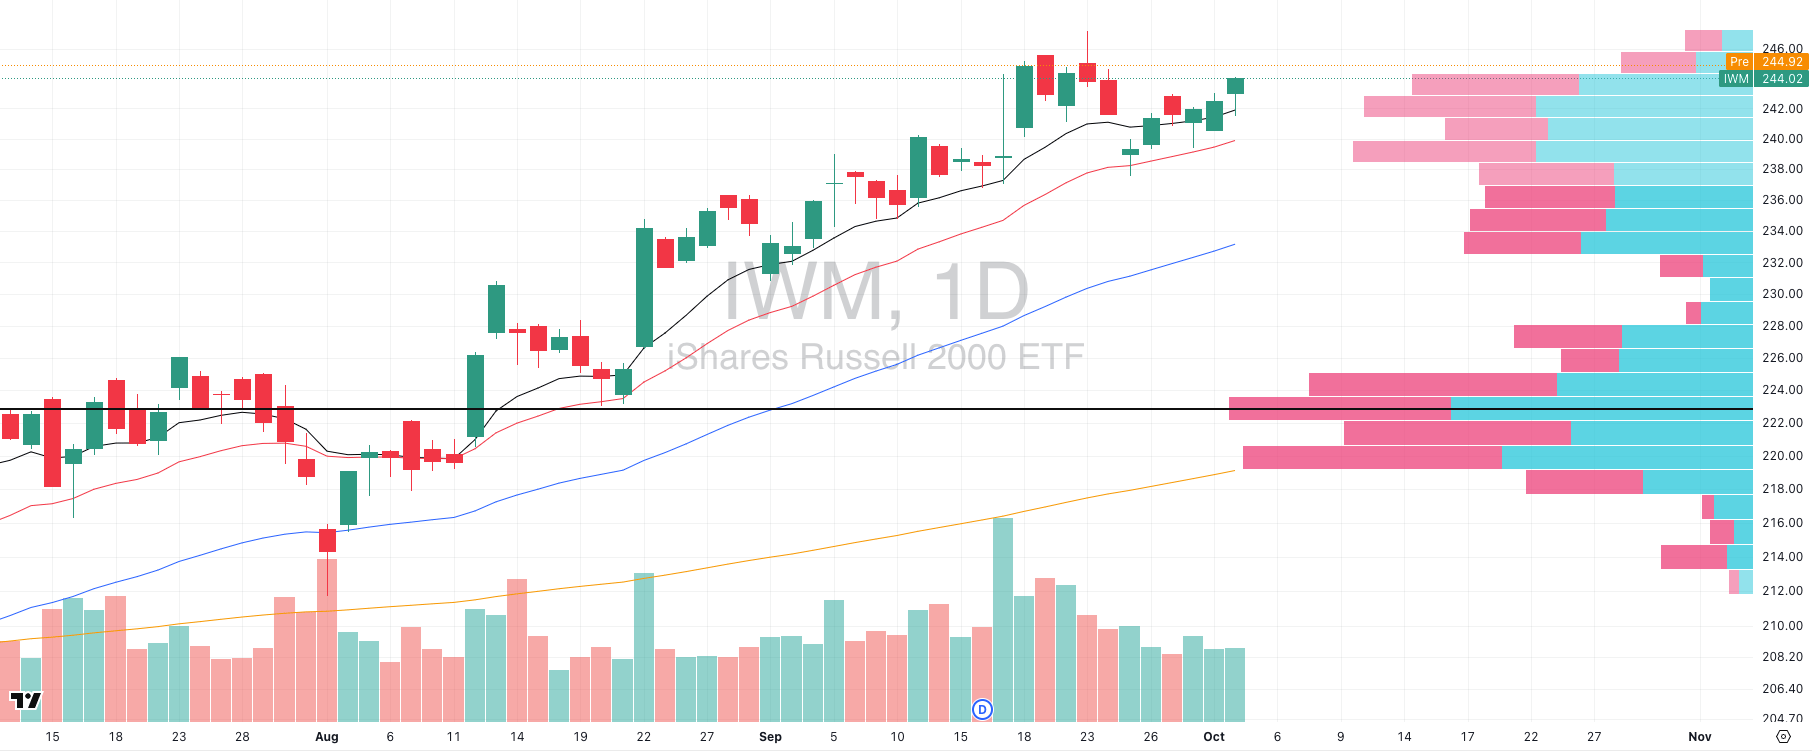
IWM VRVP Daily Chart
% over 20 EMA: 40.23% | % over 50 EMA: 52.28% | % over 200 EMA: 58.64%
Small caps mirrored the midcaps yesterday, but with even stronger tape action. Price pulled back into the rising daily 10-EMA around $242.40, immediately found demand, and closed higher. That kind of swift rejection is exactly what you want to see when testing short-term trend support.
What stands out here is the supply landscape. The visible range volume profile shows a clear low-volume pocket above $244.90.
That means there’s very little overhead supply until roughly $247.50- the level of the September rejection highs. With structure tightening and buyers consistently stepping in at higher lows, the path of least resistance remains higher.
👉 Expectation: A retest of $247.50 looks very likely in the near term.
But as always, remember that indices are just the roadmap. The real edge comes from drilling into scans within the group to identify the actual leadership. Right now, plenty of small-cap setups are presenting, and those are where the actionable trades are.
The Smartest Free Crypto Event You’ll Join This Year

Curious about crypto but still feeling stuck scrolling endless threads? People who get in early aren’t just lucky—they understand the why, when, and how of crypto.
Join our free 3‑day virtual summit and meet the crypto experts who can help you build out your portfolio. You’ll walk away with smart, actionable insights from analysts, developers, and seasoned crypto investors who’ve created fortunes using smart strategies and deep research.
No hype. No FOMO. Just the clear steps you need to move from intrigued to informed about crypto.
FOCUSED STOCK
SHOP
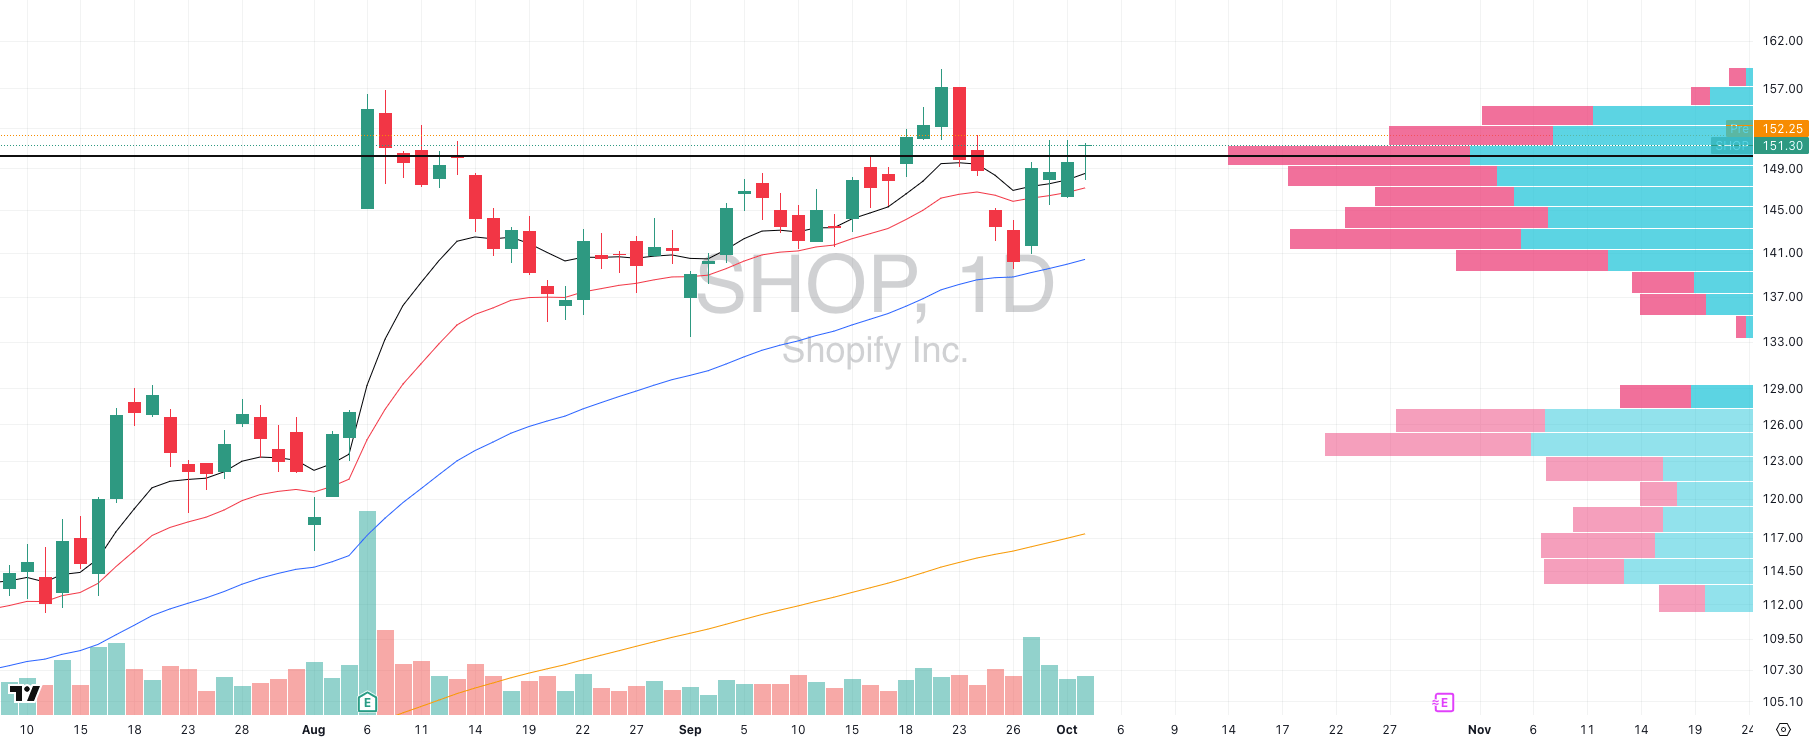
SHOP VRVP Daily Chart
ADR%: 3.33% | Off 52-week high: -4.8% | Above 52-week low: +116.6%
Shopify gave us a perfect pullback long setup last week when it tagged its rising 50-day EMA. For pullback traders, this was as clean as it gets with a leading name inside XLY (Consumer Discretionary, one of the strongest sectors right now) respecting higher timeframe support.
The last three sessions have only improved the structure:
Price has contracted tightly above the rising 10- and 20-day EMAs,
It’s holding right on its Point of Control (POC),
And now it appears to be gapping over that two-month base this morning.
This is constructive price action: contraction, support, and now a potential expansion phase.
Today’s Playbook
We will be watching SHOP closely for a long position. But a note of caution: 5-min opening range breakout systems on gap-ups have been failing recently. The higher-probability play may be:
Sit out the first 15–30 minutes,
Let the initial volatility shake out,
Enter on a subsequent pullback entry if SHOP holds above POC and confirms strength (e.g. gap fill, or on an entry bull flag).
👉 Takeaway: SHOP has all the ingredients of a quality Stage 2 continuation — sector leadership, higher-timeframe support, and a clean base.
FOCUSED GROUP
X
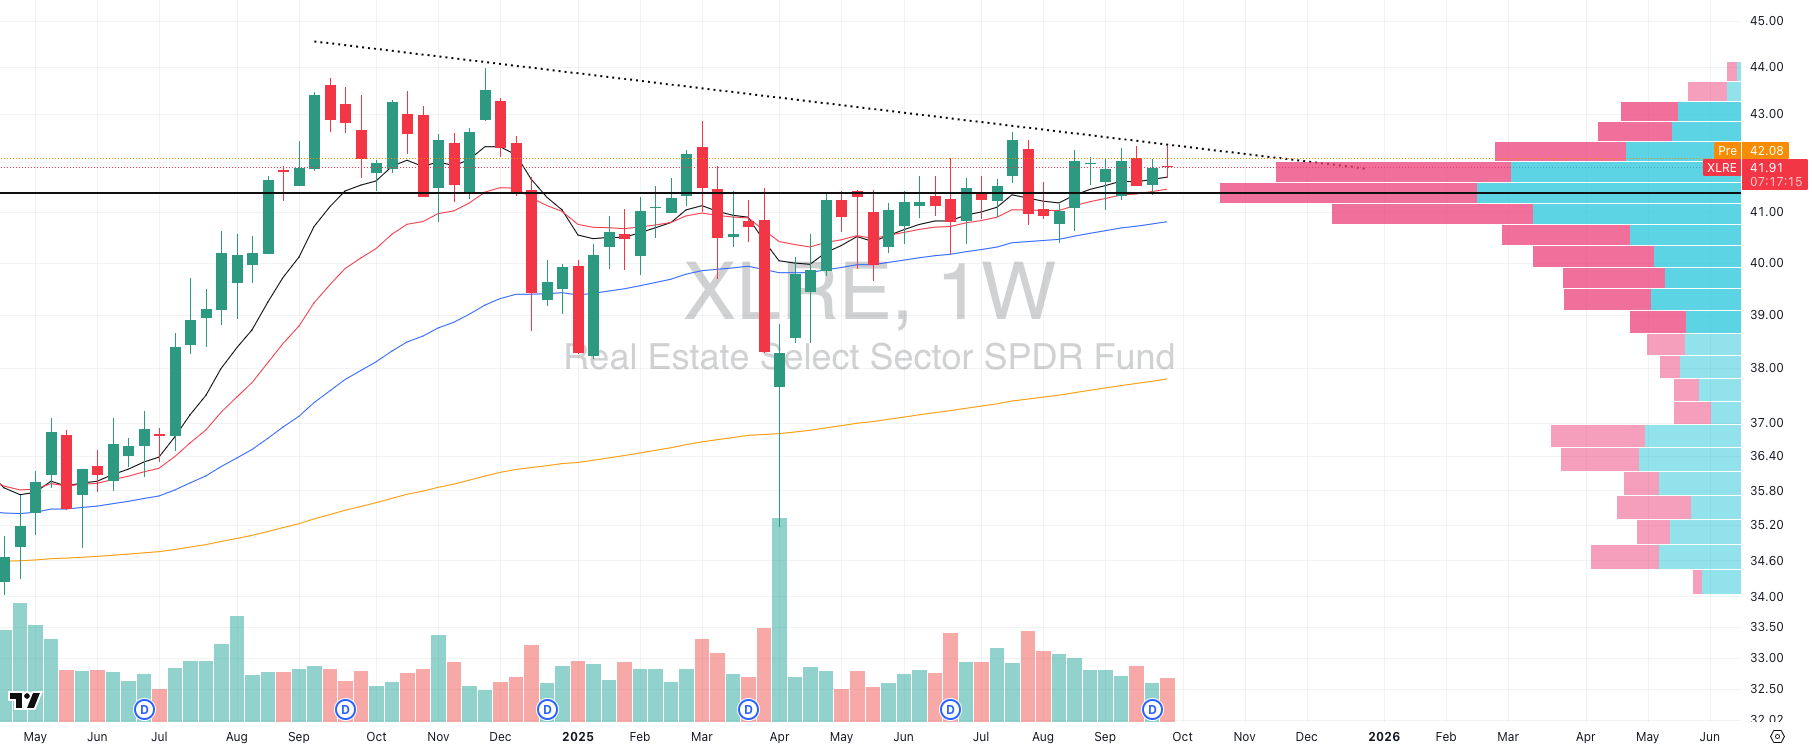
XLRE VRVP Daily Chart
Nobody is talking about this, but XLRE (Real Estate ETF) has been building a base for over a year — 406 days to be exact.
On the weekly chart, the structure is exactly what we want to see:
Relative volume has been declining over the last several months, confirming tight consolidation.
Price has been grinding sideways right on top of the weekly POC, soaking up supply.
We are now dangerously close to a breakout level where the visible range volume profile (VRVP) shows supply dries up above $42.50.
Why It Matters Now
Real estate stocks historically outperform when rates are falling:
Lower financing costs directly boost cash flow for REIT-heavy sectors.
Discount rate mechanics (lower yields = higher asset values) re-rate valuations upward.
Yield substitution draws income investors into REITs when Treasuries yield less.
We saw this in 2009–2013 post-GFC and again in 2019, when rate cuts sparked big runs in REITs. Conversely, the 2022 rate spike crushed XLRE.
With the Fed leaning toward cuts later this year, the macro backdrop is finally turning supportive again, and XLRE has quietly positioned itself with a year-long energy build just below a breakout.

Q&A
Got a trading question? Hit reply and ask!
Q: “When do you actually sell? I understand entries but I always either sell too early or too late”
The truth is selling is strategy-dependent.
But speaking as swing traders who learned from Kristjan Kullamägi (Quillamaggie), our framework is simple: take profits into strength to smooth the equity curve, then trail the rest with moving averages to capture the fat tails.
Step 1: Scale Into Strength (Days 2–7)
After a proper entry, the first edge comes early. Within 2–7 days, you should see volatility expansion - the stock’s ADR jumps, momentum accelerates.
That’s the most predictable phase of the move. We scale some size out there, move the stop to breakeven, and instantly turn the rest of the position into a free trade.
This protects capital, reduces variance, and keeps you psychologically aligned with your process.
Step 2: Trail for the Fat Tails
The other half of swing trading is playing for the outliers. A year’s P&L is not built on 100 small winners, it’s built on a handful of monster trades that run 50R, 80R, even 100R.
Statistically, those fat tails are rare, but they make your trading career. And the only way to catch them is to let the upside be unlimited while the downside is capped.
That’s why we trail using 10/20 EMA structures on daily and weekly charts. A moving average lets the stock’s own trend decide when the move is done.
You stay in as long as momentum holds, no arbitrary profit caps.
Contrast this with other frameworks:
Some traders always sell half at +3R and exit when the stock gets statistically stretched (say, >7x ATR above the 50 EMA).
That approach works, but it forces exits. We’ve seen too many leaders stay “extended” for weeks, even months, grinding higher while traders who sold mechanically watched from the sidelines.
The Asymmetry Edge
Swing trading is all about asymmetry. You risk small, consistent amounts (0.5% per trade, for example), knowing that most outcomes will be scratches, some will be 2–5R, and a select few will be career-defining fat tails.
If you sell too early, you cut yourself off from those outliers. If you refuse to scale out into strength, you expose yourself to unnecessary drawdowns. The balance is what makes the system sustainable.
👉 Remember: You’re not trying to predict when a stock tops. You’re engineering a process that allows you to play for the right tail while ensuring your downside stays minimal.
You are trading your system, not the stock itself.
Did you find value in today's publication?This helps us better design our content for our readers |
Reply