- Swingly
- Posts
- This Is Where To Push Exposure
This Is Where To Push Exposure


MARKET ANALYSIS
Here’s All You Need To Know

U.S. index futures are leaning lower this morning, and it’s a classic “risk headlines + earnings” mix driving it: Walmart’s outlook underwhelmed, while Middle East tension is pushing crude higher and keeping traders twitchy into the open.
Walmart matters here because it’s a real-time read on the consumer and pricing power, not a meme-stock candle; the market is treating weaker forward guidance as a small warning that demand is normalising while cost/inflation variables stay sticky.
Oil is the other big lever today. Crude extending higher on U.S.–Iran tension is supportive for energy and parts of cyclicals, but it’s also a stealth tax on consumers if it keeps running, which is why equity strength tends to get “choppier” when crude is bid for geopolitical reasons rather than growth reasons.
The good news is yesterday’s tape didn’t have “panic character.” We saw buyers show up in mega-cap tech alongside strength in financials and energy, which is exactly the type of broad participation you want if the market is trying to stabilise rather than unravel.
On the data side, jobless claims came in meaningfully lower than expected, which keeps the “hard landing” narrative on a tight leash.
At the same time, the trade deficit print was a surprise jump, and that’s the kind of number that can muddy near-term macro takes without actually changing trend.
Philly Fed manufacturing was better than expected, but the internals were mixed, with employment slipping negative.
Translation: activity can look fine while hiring appetite cools, which is consistent with an economy that’s still moving, just more selective.
Rates are still the backdrop. Fed minutes didn’t hand the market an easy “cuts are coming” green light, and the debate on the path of rates is clearly not settled.
That matters because it keeps the market in a positioning-driven environment where sentiment swings faster than fundamentals.
The highest-quality read for traders right now is still reaction, not the headline. If oil pops and equities absorb it without giving back prior support levels, that’s constructive.
If every crude uptick immediately pressures growth and expands volatility, that’s your signal the market is still in “fragile balance” mode.
Base case for the day: expect more rotation and more two-way trade than clean trend.
The best opportunities usually come from letting the first 30–60 minutes set the tone, then leaning on the levels that have already proven they matter (support tests that hold, or rallies that fail quickly back into supply).
Nasdaq

QQQ VRVP Daily & Weekly Chart
48.51%: over 20 EMA | 48.51%: over 50 EMA | 51.48%: over 200 EMA
The QQQ did exactly what we expected yesterday by tagging the declining resistance band around 609.97, which is also where the declining 20-week EMA is sitting, and it rejected that zone cleanly.
The candle itself showed exhaustion at the highs, which matters because we have now rejected the declining 20-week EMA for two consecutive weeks, and that keeps the intermediate trend in “repair mode” rather than “ready to trend.”
My base case is still a controlled pullback first, with the 593.50–593.60 area acting as the immediate magnet because that is where we’ve already seen buyers step in on Feb 5 and again on Feb 17.
If we do trade down ~2% into that band and hold it, that would effectively create a third touch, which is what turns a level from “interesting” into “actionable” support in traditional structure work.
If that level fails to hold, the next downside gravity point remains the rising 200-day EMA near 583, which is also consistent with the broader “megaphone” geometry still pointing lower before any sustainable recovery can develop.
The constructive read is that a hold of 593.50 would likely set up another rotation back into the wedge resistance, because this pattern historically resolves upward more often than not, but the market still needs time and confirmation before that becomes the primary scenario.

QQQE VRVP Daily & Weekly Chart
The QQQE is still the cleaner chart, and that matters because it strips out mega-cap distortion and tells you more about the “average” NASDAQ stock’s behaviour.
Price is holding a steep sequence of higher lows since the Feb 5 low, and the ETF has been contracting above its 20-week EMA, which is simply stronger than what we’re seeing in the cap-weighted QQQ.
Even so, there is clearly heavy overhead supply around 103.80, and yesterday’s attempted push higher failed to convert into a true breakout or a clean reclaim of the key control zone.
Because the QQQ is still vulnerable to a 2% re-test into support, the QQQE is likely to feel some sympathetic pressure as well, with ~101 being the logical support “catch zone” if we see another volatility pulse.
The key takeaway is not that this is a long setup today; it’s that internal NASDAQ breadth is holding up better than the headline index suggests, which is a small but meaningful stabilisation signal if support zones continue to defend.
S&P 400 Midcap

MDY VRVP Daily & Weekly Chart
62.81%: over 20 EMA | 67.08%: over 50 EMA | 68.34%: over 200 EMA
The mid-caps are still structurally impressive because they remain in a strong stage-2 advance off the Nov 17, 2025 Morning Star reversal, and they have consistently defended the rising moving average spine that has supported this whole trend.
The short-term caution flag is volume behaviour: we are seeing expanding relative volume inside what is supposed to be a consolidation, and yesterday printed the highest relative volume in the bounce sequence at roughly 133% of the 20-day average.
That would be bullish if price was breaking out through supply, but instead we saw sellers show up into the ~660 area, which tells you supply is still active and volatility risk remains elevated.
Breadth is also getting hot again, with roughly 62% of stocks above their 20-EMA and close to 70% above the 200-EMA, and once breadth pushes into the low-70s it often becomes short-term stretched and more vulnerable to mean reversion.
The most likely outcome here is not a collapse; it is more two-way trading, with MDY continuing to chop and retest its rising support bands rather than trending cleanly, which is exactly the environment where position sizing and time horizon matter more than “being right.”
Russell 2000

IWM VRVP Daily & Weekly Chart
48.39%: over 20 EMA | 55.24%: over 50 EMA | 63.55%: over 200 EMA
The IWM is still in a constructive contraction, but yesterday’s session was a clear rejection from overhead supply near 267, and the tape showed sellers leaning hard into that level.
On the intraday volume profile at the highs, the selling imbalance was obvious, with roughly 2.5M shares red vs 1.45M green, which supports the idea that this remains a supply shelf for now.
The potential double-top remains non-confirmed, and that point is critical: the pattern is not valid unless we see a decisive breakdown below the 50-day EMA / 10-week EMA area around 257.50 with real acceptance.
The weekly structure still looks healthy because IWM is building a 36-day base above the 10-week EMA, which is typically what you want to see in a strong stage-2 continuation environment.
The main concern is that the base has formed with expanding relative volume, which can imply distribution rather than quiet absorption, so the market probably needs to “prove” the base by defending it again.
From here, a re-test of 258 is the cleanest path (roughly -2.2%), and the quality of that test will matter more than the fact we get the test: a controlled pullback and a firm defence keeps the stage-2 thesis intact.
FOCUSED STOCK
KGC: The Time To Push Mining Exposure
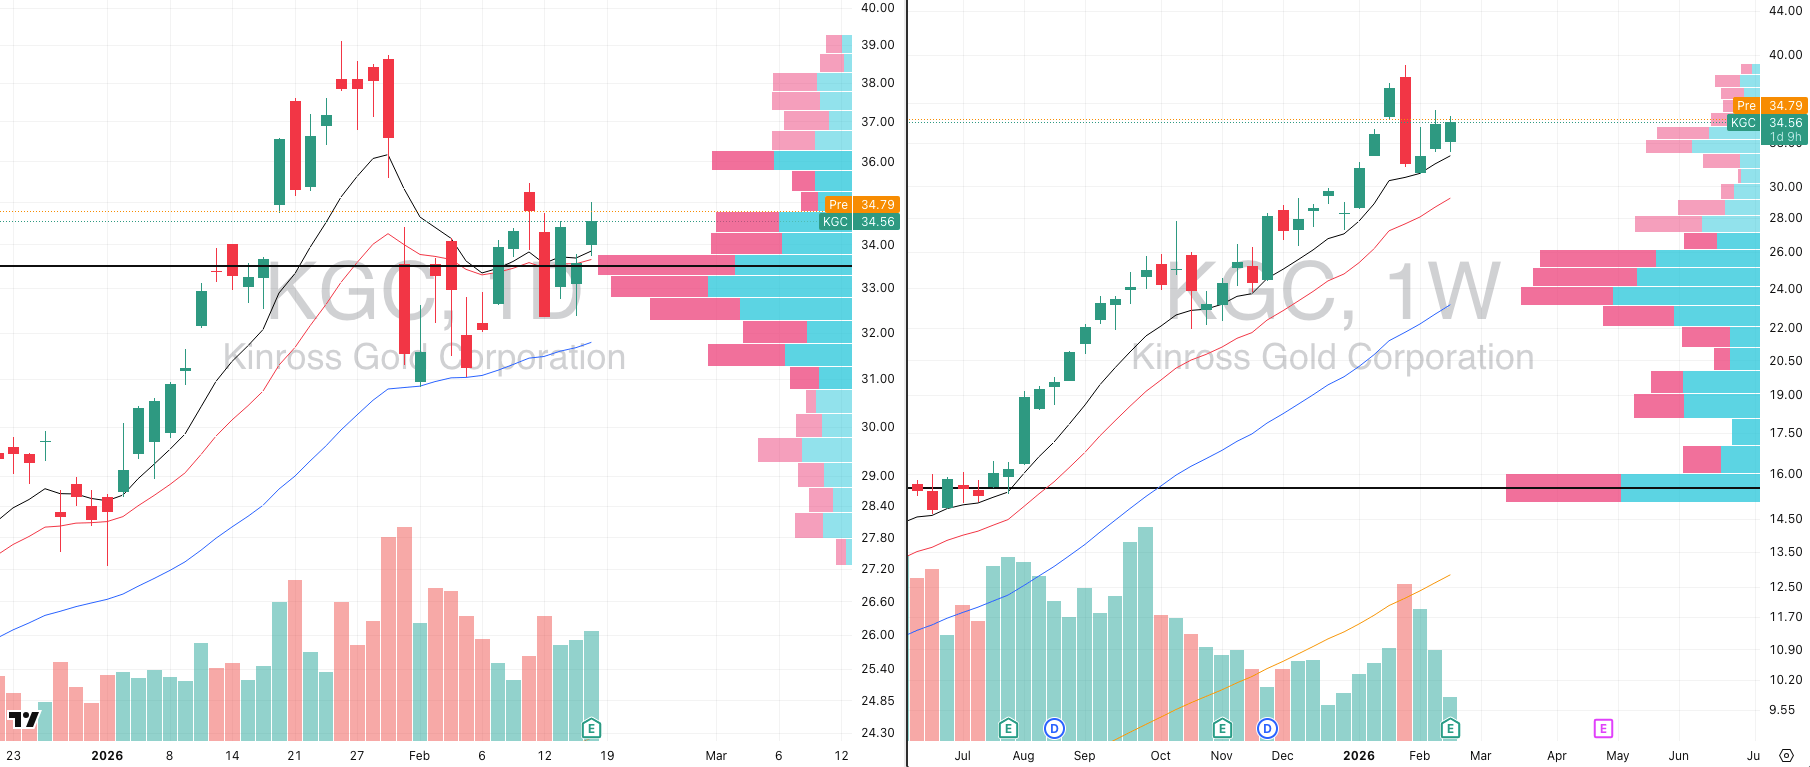
ADR%: 5.31% | Off 52-week high: -11.6% | Above 52-week low: +237.5%
KGC is on the list because it is acting like a true leader in the strongest pocket of the market right now, with a 99 relative strength rating vs the SPX, and that is the first filter we care about in this tape.
The earnings beat is not the thesis; the thesis is that gold miners are one of the few areas showing clean trend behaviour, and KGC is behaving like a stock institutions are willing to hold through chop.
Precious metals have been basing and contracting, and that environment tends to reward miners because you get tighter price action, clearer risk definition, and fewer “air pocket” stop-outs than chasing strength after a metals expansion move has already begun.
The bigger picture is simple: if gold remains in a strong contraction and continues to hold its structure, miners are still one of the best places to hunt for asymmetric upside because the group is already acting like capital is rotating into it, not away from it.

Did you find value in today's publication?This helps us better design our content for our readers |
Reply