- Swingly
- Posts
- This Is How To Play Today's Pullback
This Is How To Play Today's Pullback
In partnership with


MARKET ANALYSIS
Here’s All You Need To Know

U.S. equity futures are modestly softer this morning following last week’s push to fresh all-time highs in the S&P 500.
That pullback is not particularly surprising, especially when you zoom out and look at the broader context: the market has just come off a very strong two-week stretch after successfully testing and holding the rising 10-week moving average across the major indices.
From that test, price responded exactly how you would want to see it respond and with strong upside follow-through.
The pressure this morning is concentrated almost entirely in the AI and mega-cap complex, where names like Nvidia, Micron, and Oracle are digesting strong weekly gains.
Importantly, this looks far more like routine consolidation and profit-taking than any meaningful change in trend or character.
Stepping back, the broader backdrop remains very healthy. The S&P 500, Dow, and Nasdaq are all closing out 2025 with strong double-digit gains, and we remain firmly within the seasonal Santa Claus rally window a period that historically favors continuation rather than reversal.
With the economic calendar extremely light this week, markets are largely trading on positioning, liquidity, and year-end flows rather than new macro inputs. That typically results in slower, choppier sessions, but it also significantly reduces headline-driven risk.
The only scheduled macro catalyst of note is the release of the Fed’s December meeting minutes later this week but unless the tone materially deviates from what markets have already priced, a pause near term with flexibility into 2026, it’s unlikely to disrupt the current tape.
Beneath the surface, the rotation we’ve been tracking continues to play out constructively. Even as some mega-cap names pause, capital is not leaving equities; it is rotating, consolidating, and selectively redeploying and we still are a little more optimistic than most other analysts.
Nasdaq
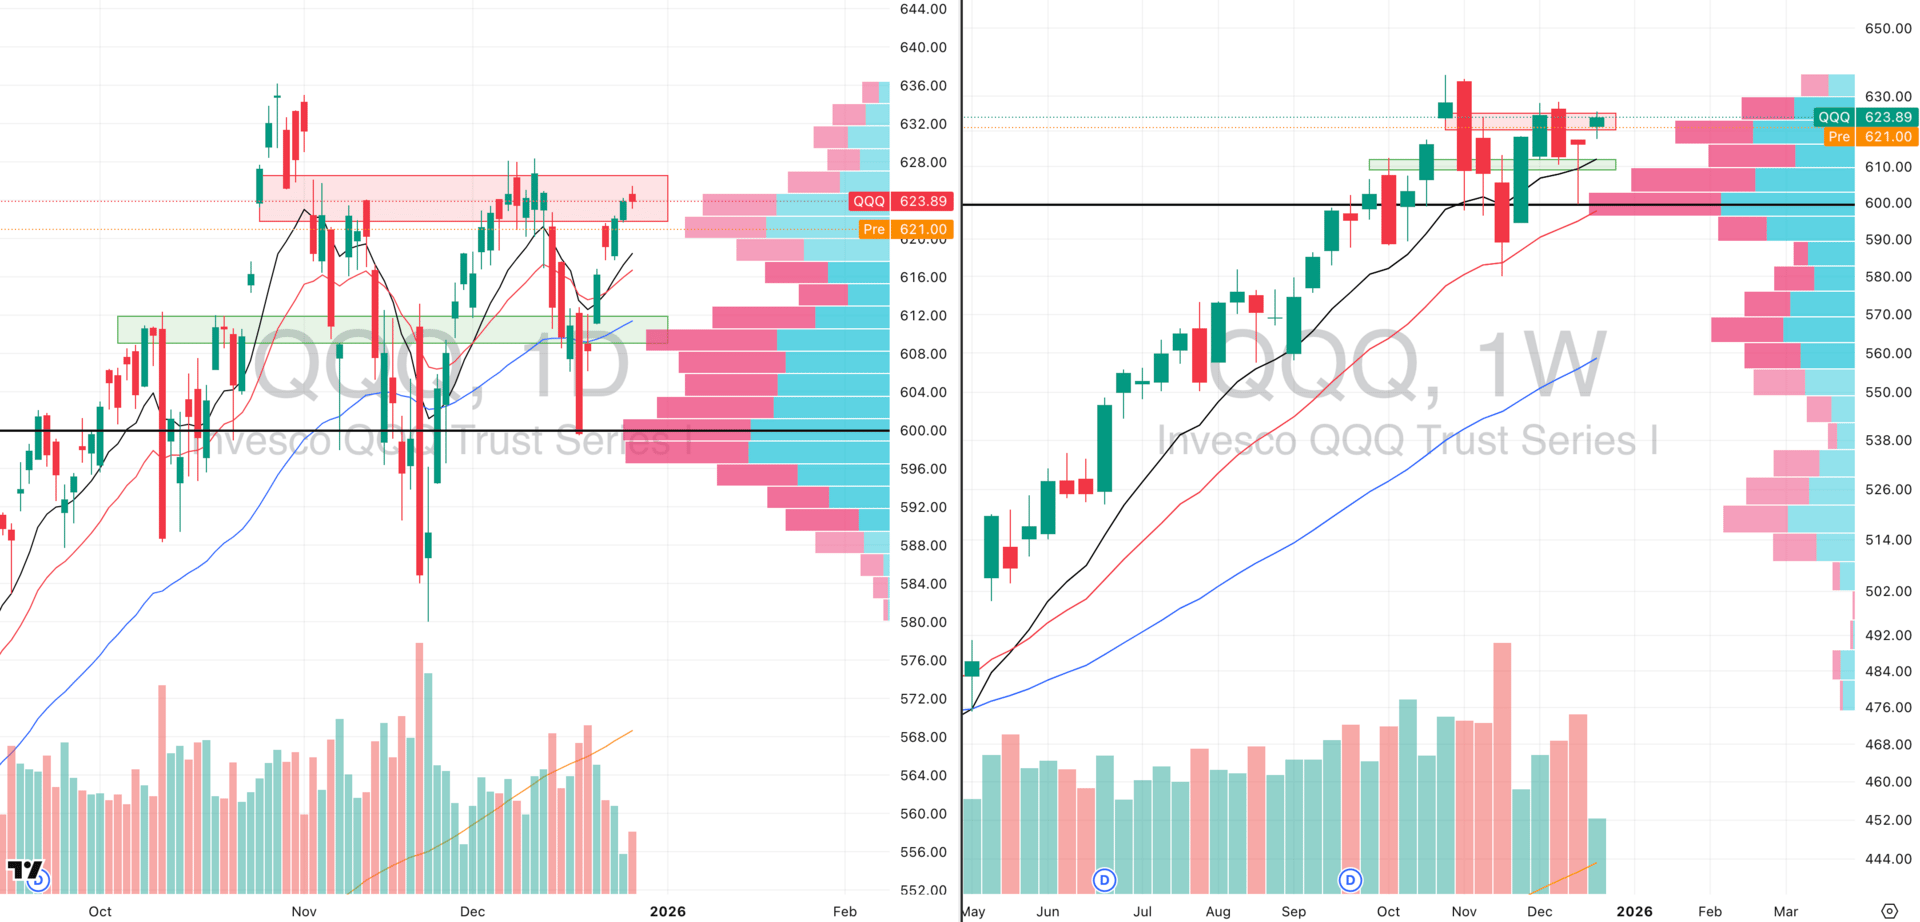
QQQ VRVP Daily & Weekly Chart

QQQE VRVP Daily & Weekly Chart
59.40%: over 20 EMA | 57.42%: over 50 EMA | 61.38%: over 200 EMA
Both QQQ and QQQE are now pushing directly into very well-defined supply zones on levels that have capped price since the broader pullback and correction that began in late September and early October 2025.
Given how aggressively the Nasdaq moved higher over the past two weeks, a short-term pullback or pause is entirely normal. That advance followed a textbook retracement into the rising 10- and 20-week EMAs, where demand stepped in decisively and drove a near-vertical rebound.
This morning’s softness fits that context. It looks far more like digestion after a strong impulse, rather than the start of any new downside trend.
One notable development is that QQQE has begun to outperform QQQ on a relative momentum basis. That outperformance stems from the fact that QQQ corrected more deeply two weeks ago — down to its 20-week EMA — while QQQE held higher. The key here is not which one leads in isolation, but the confluence between the two, which remains constructive.
Beneath the surface, leadership has not meaningfully deteriorated. We saw fresh breakouts last week in NVDA, alongside strong participation from GOOG and AMZN. Even though some of that strength is being digested this morning, the larger signal is that leadership remains intact.
Today’s session is far more about the close than the open. If these leaders begin to lose their breakout lows — particularly NVDA — and fail to reclaim key levels into the close, that would open the door to deeper downside.
Until then, this is not the type of tape that warrants emotional or reactive selling, wait to see how the market closes today and if demand steps in to defend lows. If that happens, that’s your sign that we are unlikely to break deeper.
S&P 400 Midcap
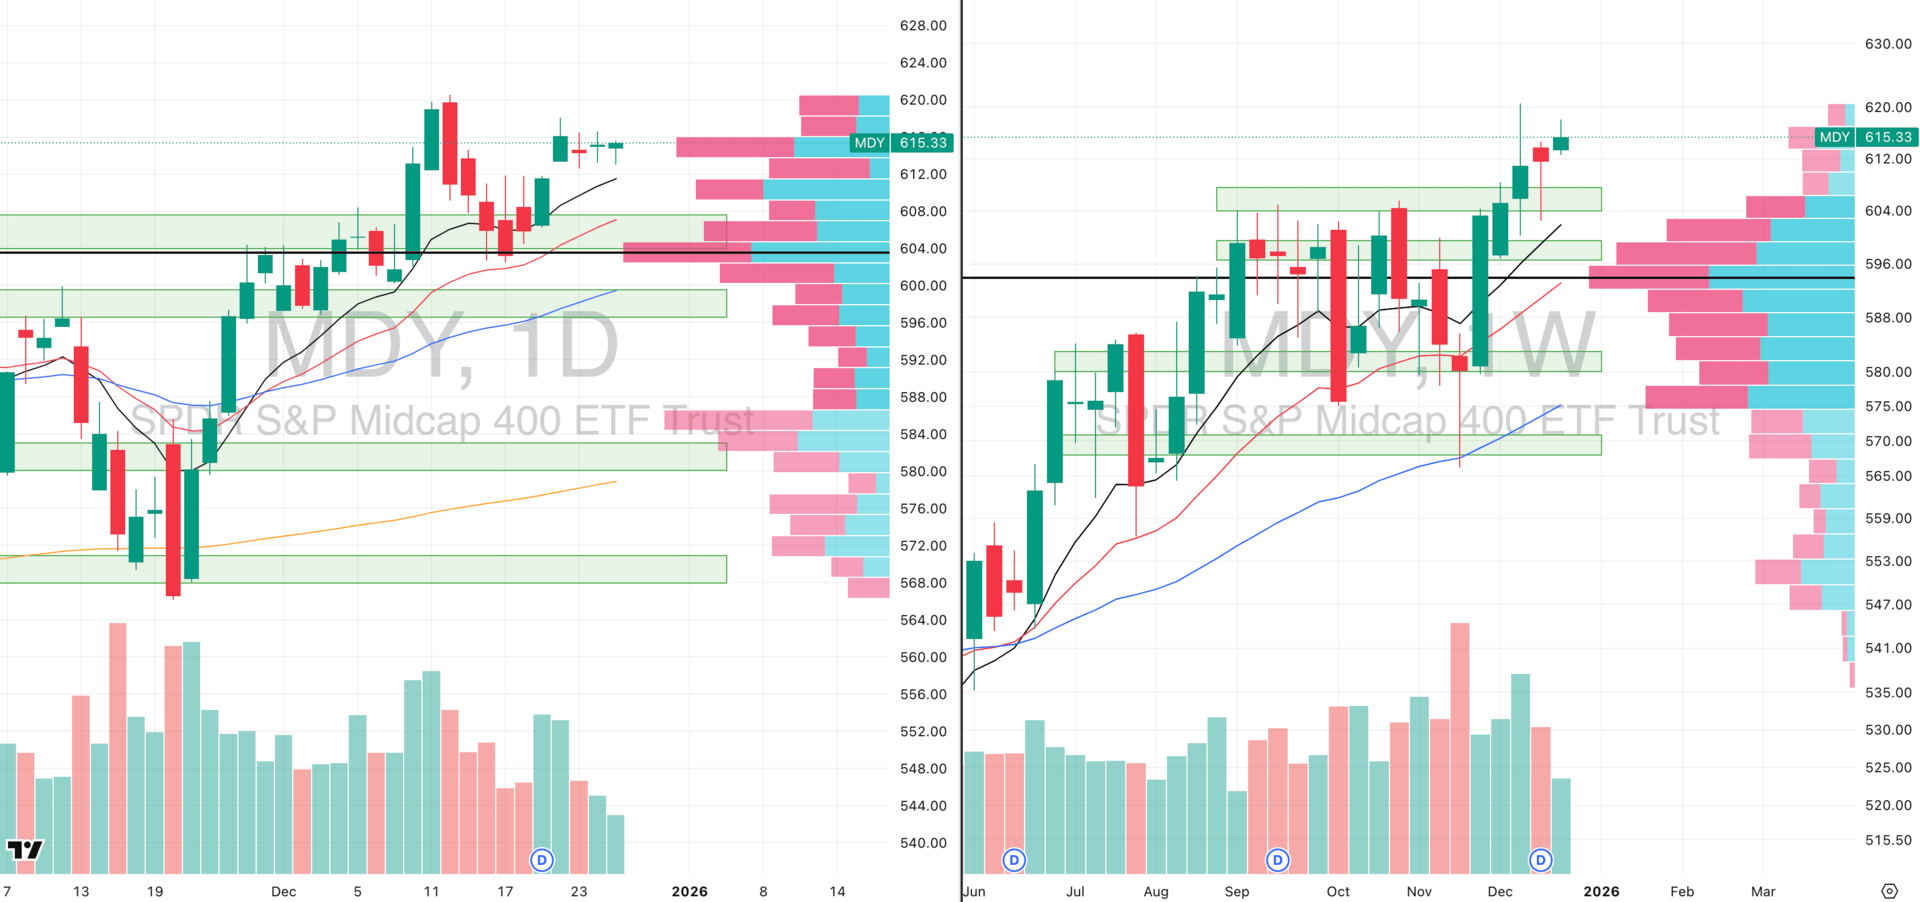
MDY VRVP Daily & Weekly Chart
61.00%: over 20 EMA | 65.50%: over 50 EMA | 60.50%: over 200 EMA
MDY is currently contracting cleanly on its rising daily 10-EMA, while price continues to respect a clearly defined descending resistance line from the Friday, December 12 peak near $620, which has capped upside for the past three weeks.
What stands out here is the simultaneous contraction in both price range and volume. That combination is typically associated with absorption especially when it occurs above reclaimed support.
Importantly, mid-caps are not gapping down this morning, despite softness in parts of the AI complex. That relative stability is a positive signal and suggests underlying demand remains present.
The most critical development remains the reclaim and defense of the 10- and 20-day EMA zone, where the most recent demand has now been clearly reaffirmed around $607. That level marked the successful breakout and reversal earlier this month, and price has respected it since.
This behavior reinforces a broader theme we’ve been emphasizing: breakout chasing has not been rewarded, while entries built on weakness into support have worked far more consistently.
From a risk perspective, the focus today is straightforward:
$610 (daily 10-EMA) is the first area of support.
Below that, a worst-case retest of the rising 20-day EMA near $608 would still be technically healthy, especially given the dense VRVP support clustered in that zone.
As things stand, there is no technical damage in MDY. The structure remains constructive, the contraction is controlled, and support is being respected.
Russell 2000

IWM VRVP Daily & Weekly Chart
50.77%: over 20 EMA | 62.43%: over 50 EMA | 63.41%: over 200 EMA
Small caps remain in a contraction at highs on the weekly chart, which in isolation is constructive. However, context matters, and there are a few important levels we need to respect here.
Price is still sitting just below a well-defined supply zone at $253, which has capped upside repeatedly. This morning’s weakness is pushing IWM back toward its rising daily 20-EMA, bringing price into the next key support band.
That support zone sits roughly between $248.00 and $248.50, and this level is particularly important for IWM. Historically, the 20-day EMA has been well respected in this index, far more so than in some other segments of the market.
This is the level we are most focused on. If demand steps in cleanly on a pullback into the 20-EMA, the broader structure remains intact and the consolidation can continue to resolve higher.
If, however, we fail to see strength on a dip into this zone, that’s when the risk profile changes. A lack of response here would increase the probability of a sharper psychological move lower, targeting the confluence of:
The rising daily 50-day EMA, and
The rising 10-week EMA on the weekly chart.
That scenario would imply roughly a –2.1% downside move from current levels.
A move of that magnitude would be a meaningful warning signal, suggesting that the recovery over the past few weeks has not fully resolved and that the market likely needs more time to correct and digest.
Colorado’s Most-Awarded Brewery Did Something Totally Unique

Some companies make lofty promises to investors and never deliver. Others use those dollars to unlock new levels of scale.
That’s Westbound & Down’s story. Already Colorado’s most-awarded craft brewery, they opened their doors to investors for the first time to help open a flagship Denver-metro-area location.
With 2,800% distribution growth since 2019 and a retail partnership with Whole Foods, it’s no shock investors maxed out that campaign in less than 60 days.
But it’s what comes next that’s even more exciting. Fresh off Brewery of the Year honors at the 2025 Great American Beer Festival, W&D is scaling toward 4X distribution growth by 2028.
This is a paid advertisement for Westbound & Down’s Regulation CF Offering. Please read the offering circular at https://invest.westboundanddown.com/
FOCUSED STOCK
MSFT: A Big Move is Brewing
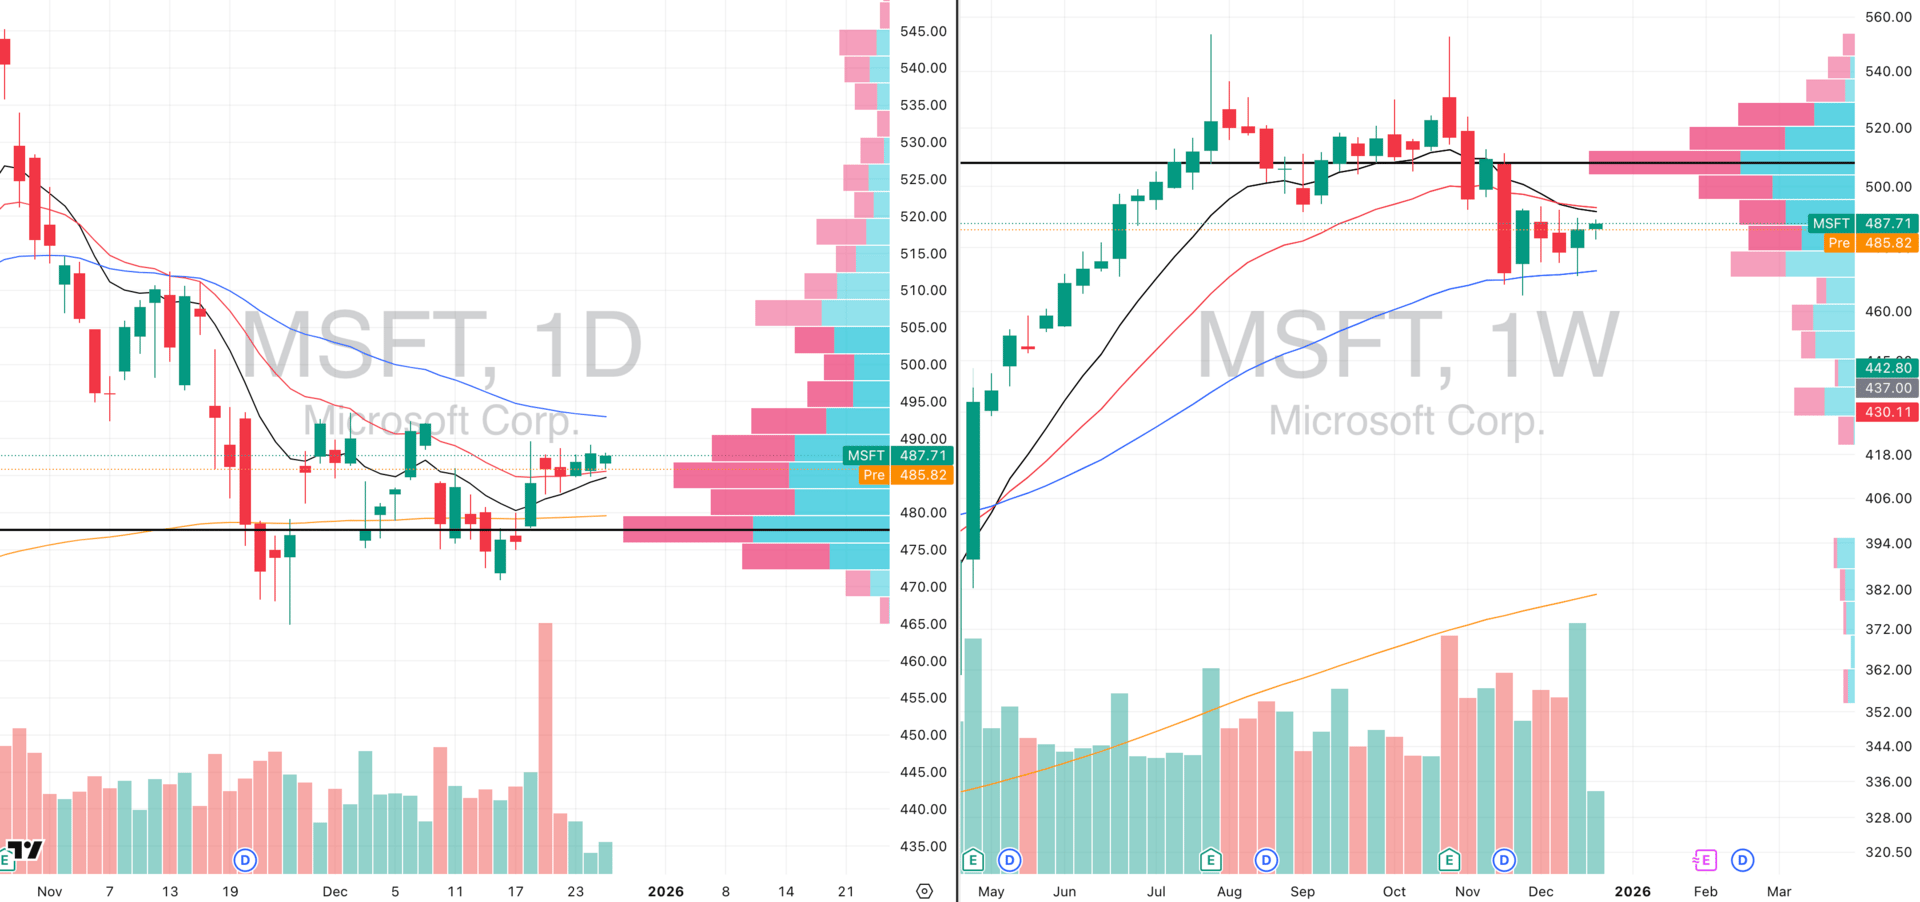
MSFT VRVP Daily & Weekly Chart
ADR%: 1.32% | Off 52-week high: -42.2% | Above 52-week low: +11.9%
Microsoft sits at the center of the Magnificent Seven (MAGS) — a group that consistently drives the direction of the cap-weighted indices, particularly QQQ and SPY. When these names move, the indices follow.
That said, MSFT has not been a momentum leader in recent months. Since topping in October 2025, the stock entered a stage four markdown phase, materially lagging not just the broader market, but even its MAGS peers.
What has changed — and why MSFT is now back on our radar — is the structure, not the momentum. Over the past month, MSFT has been carving out a tight contraction on the intermediary (weekly) chart, following its downside phase.
At the same time, we are now seeing a simultaneous contraction on the short-term (daily) chart. This alignment between short-term and longer-term compression is rare and often marks a point of maximum asymmetry.
Importantly, MSFT has found a firm floor at the rising 50-week EMA, repeatedly resisting attempts to break lower. That level has acted as a clear line of acceptance for longer-term buyers.
On the daily chart, MSFT also printed its first meaningful breakout since the October breakdown, allowing price to reclaim and then hold above both the 10- and 20-day EMAs for over a full week. That is a meaningful character change, not something we want to ignore.
We are not highlighting MSFT because it is already leading — we are highlighting it because leadership often emerges from tight, compressed bases, especially when the broader market begins to re-accelerate.
With both QQQ and QQQE pressing into overhead supply, any sustained Nasdaq acceleration will require participation from the largest weights. If that happens, MSFT is exactly the type of stock you want to already be watching.
A key reminder: Remember that a stock is simply a vehicle for expressing risk-to-reward. Right now, MSFT offers a rare combination of tight structure, defined risk, and high index sensitivity (and is itself an AI trade), which is precisely what makes it interesting at this stage.
FOCUSED GROUP
XLF: Financials Are In Stage 2

XLF VRVP Daily & Weekly Chart
Financials continue to stand out as one of the cleanest stage two trends in the market right now (and a leader inside all 11 GICS equities sectors).
After a choppier, less reliable period through late November and early December, XLF has decisively resolved higher and regained clear upside momentum.
Since the major bullish engulfing week off the $51 level, XLF has effectively moved higher for five consecutive weeks, with very little meaningful giveback. That bounce marked an important character shift, turning what had been uncertainty into sustained directional strength.
The follow-through since then has been just as impressive. Last week’s continuation came directly out of a tight short-term contraction at highs, which is exactly the type of behavior you want to see in a healthy stage two rally.
Notably, as soon as XLF tagged the rising 10-day EMA on December 19, buyers stepped in aggressively. The very next session, Monday the 22nd, saw a strong upside response reinforcing that dips are being treated as opportunities.
Under the surface, leadership within financials is very clear. Regional banks (KRE) and insurance (KIE) remain the two strongest groups we are tracking, both showing persistent relative strength and clean trend structure.

Did you find value in today's publication?This helps us better design our content for our readers |
Reply