- Swingly
- Posts
- Things Are Getting Ugly...
Things Are Getting Ugly...
In partnership with

MARKET ANALYSIS
What You Need To Know For Macro

Jobs data: softer trend, messy print. The delayed jobs report didn’t really resolve anything. November payrolls came in at +64k, which beat low expectations, but that was offset by a -105k print for October and an unemployment rate rising to 4.6%, the highest in several years. Directionally, the labour market continues to soften, even if the headline number looked fine at first glance.
Why markets are discounting the numbers. This data is still incredibly noisy. The government shutdown, delayed surveys, and recent federal job cuts have distorted the last couple of prints, and even the Fed has acknowledged that the next few releases will need to be treated with caution. Markets are reading this as confirmation of an existing trend rather than a reason to reposition aggressively.
Rates: no urgency priced. Rates barely reacted andJanuary cut odds remain in the mid-20% range, and there’s still no sense of urgency around near-term policy. The easing story remains pushed out, with 2026 still doing most of the heavy lifting in expectations.
Energy: the cleaner signal Oil slipping below $60 was the more notable move. It points to softer demand and feeds directly into easing inflation pressure into year-end — arguably a more useful macro input than the payroll headline itself.
Now, let’s get into what we all know is the most important thing- the price & volume.
Nasdaq

QQQ VRVP Daily & Weekly Chart
56.43%: over 20 EMA | 52.47%: over 50 EMA | 58.41%: over 200 EMA
Yesterday’s sell-off looked dramatic on the surface, but in range terms it was roughly 1 unit of it’s average daily range (ADR), which matters because ADR has been expanding since the late-November breakout. Bigger candles are now the norm, not an anomaly.
Volatility has been rising since the Nov 25 breakout, when QQQ bounced aggressively from ~609 to ~627. That was a tradable bounce and many stocks moved with it — but that phase is now behind us.
Structurally, QQQ is forming an Adam & Eve double top on the intermediary trend.
The Adam top formed on the week of Oct 27 with a sharp spike.
The Eve top developed more gradually between Dec 2 and last week, with Friday marking the turn lower.
This pattern matters because it’s forming during an intermediary contraction, not in an uptrend expansion. That materially increases failure risk.
Price is now sitting on a key demand zone. If demand doesn’t step in here, a fast 2–3% downside move toward the rising 20-week MA (~594) is very plausible and could unfold in 1–2 sessions.
Mega-cap tech remains one of the weakest areas of the market right now. There is clear liquidation taking place, and exposure there should be avoided.
Late November was a good long environment. This is the part many traders miss. The problem now is timing — waiting for confirmation here has led to chop, not opportunity.
At this point, the setup is unresolved and weak. Best action is patience, not pressing exposure.
S&P 400 Midcap

MDY VRVP Daily & Weekly Chart
72.56%: over 20 EMA | 63.59%: over 50 EMA | 62.59%: over 200 EMA
Mid caps continue to show relative strength versus Nasdaq, even on down days. Yesterday’s sell-off was only an ~89% relative volume push, which is constructive.
Price is still holding above the 10-day MA (~609), which keeps the structure intact for now.
The prior supply zone (red box) is still supply. It has not been properly converted into demand yet.
Ideally, we would want to see MDY pull back toward ~604, test that former supply area, and hold it as support. That kind of pullback would actually strengthen the broader thesis.
This may sound counterintuitive, but a controlled pullback would help confirm that money is rotating out of crowded mega-cap tech and into the broader market, rather than leaving equities altogether.
Breadth supports this view: mid-cap breadth is materially stronger than large-cap Nasdaq breadth.
Russell 2000
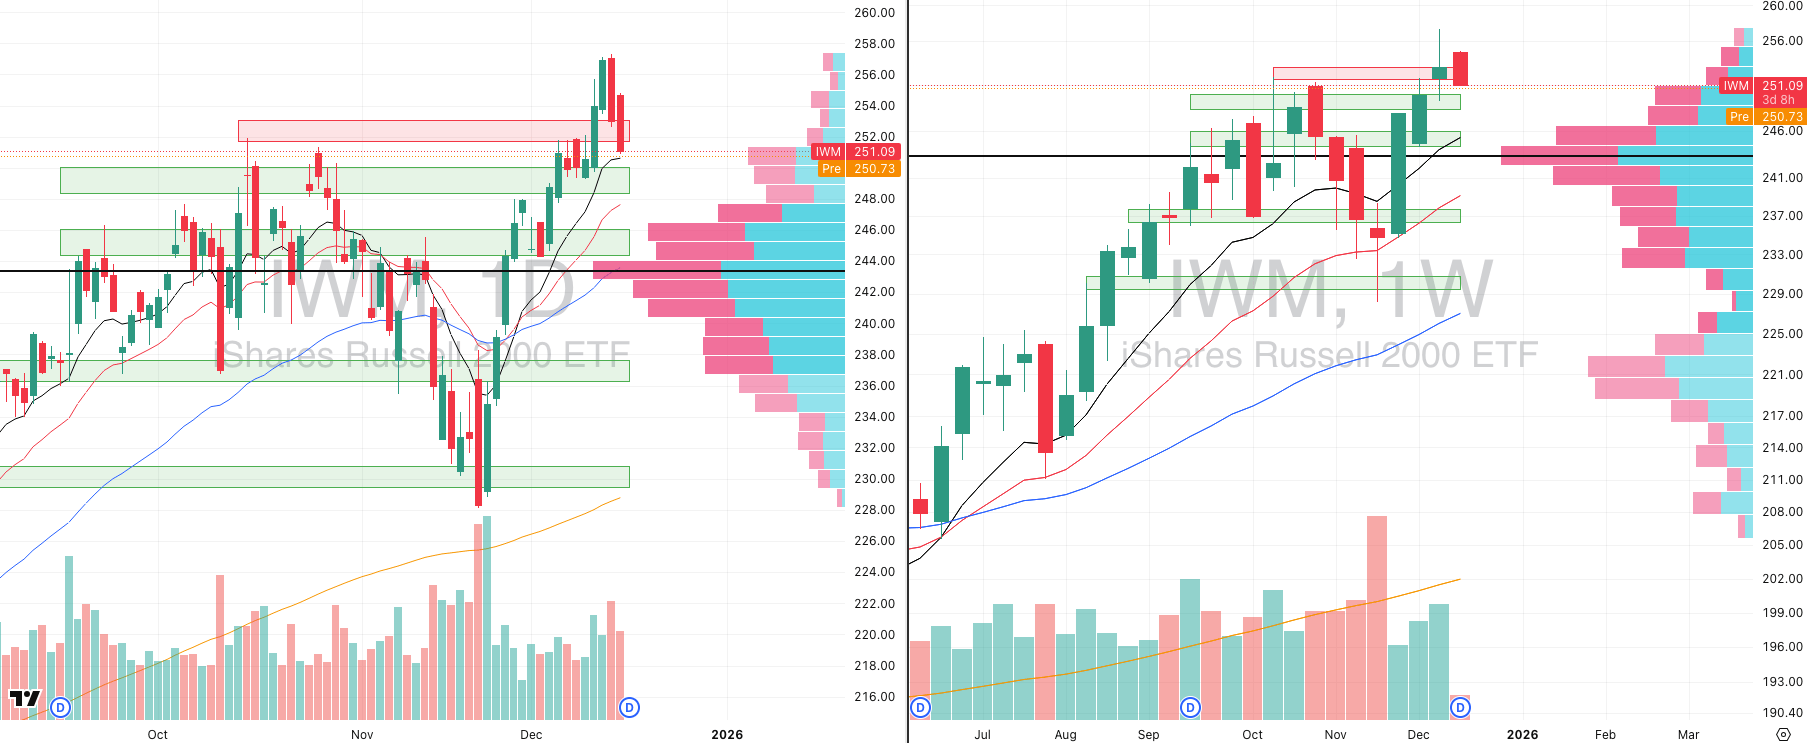
IWM VRVP Daily & Weekly Chart
73.78%: over 20 EMA | 64.13%: over 50 EMA | 64.29%: over 200 EMA
IWM failed to hold the 253 supply level and sold through it quickly, but that move has so far been absorbed.
Price is now sitting on the daily 10 MA (~250), which lines up with a prior consolidation area from Dec 4–10. That level is doing the work for now.
Holding 250 is important. A clean break below opens the door to a fast move toward the 10-week MA (~245), roughly a 2–2.5% downside.
Relative volume has been rising on the pullback, which suggests distribution risk, not just random noise.
Context matters here: since the Nov 17 capitulation low, IWM is up ~12% in a month. That’s a huge move for an index and makes digestion more likely than continuation.
The long signal was the morning star formation on the weekly between Nov 10–24. That was the moment to press exposure. At these marginal highs, it no longer is.
There was a window to be aggressive long in late November. That window has closed.
Right now, pressing new long exposure — even in mid and small caps — carries poor risk/reward.
The Year-End Moves No One’s Watching

Markets don’t wait — and year-end waits even less.
In the final stretch, money rotates, funds window-dress, tax-loss selling meets bottom-fishing, and “Santa Rally” chatter turns into real tape. Most people notice after the move.
Elite Trade Club is your morning shortcut: a curated selection of the setups that still matter this year — the headlines that move stocks, catalysts on deck, and where smart money is positioning before New Year’s. One read. Five minutes. Actionable clarity.
If you want to start 2026 from a stronger spot, finish 2025 prepared. Join 200K+ traders who open our premarket briefing, place their plan, and let the open come to them.
By joining, you’ll receive Elite Trade Club emails and select partner insights. See Privacy Policy.
FOCUSED STOCK
BTC: Keep Pressing The Metals

BTG VRVP Daily & Weekly Chart
ADR%: 4.56% | Off 52-week high: -21.9% | Above 52-week low: +114.7%
Gold and precious metals have been one of the strongest asset classes, especially over the last few months as equities have started to lose momentum.
BTG’s relative strength vs S&P 500 sits at ~90, which puts it firmly in leadership territory.
For traders, this matters more than macro. High relative strength names tend to move regardless of what the broader market is doing.
Structure and trend
BTG launched higher off a double bottom:
First bottom: Nov 6
Second bottom: Nov 21, right at the rising 200-day MA
The breakout was confirmed by strong relative volume, followed by a controlled drift higher.
What’s happening now
Over the past three weeks, BTG has been contracting tightly, which is constructive.
On the weekly chart, pullbacks have consistently been finding support at the 10-week MA, reinforcing the intermediary uptrend.
This is a stock acting like the big players are defending it, not distributing it.
How to think about entries
Breakouts on marginal highs have been a low-quality strategy across the market recently.
BTG fits better as a pullback-on-weakness candidate, with tight risk, rather than chasing strength.
FOCUSED GROUP
XLV: Strongest Group In The Last 3 Months
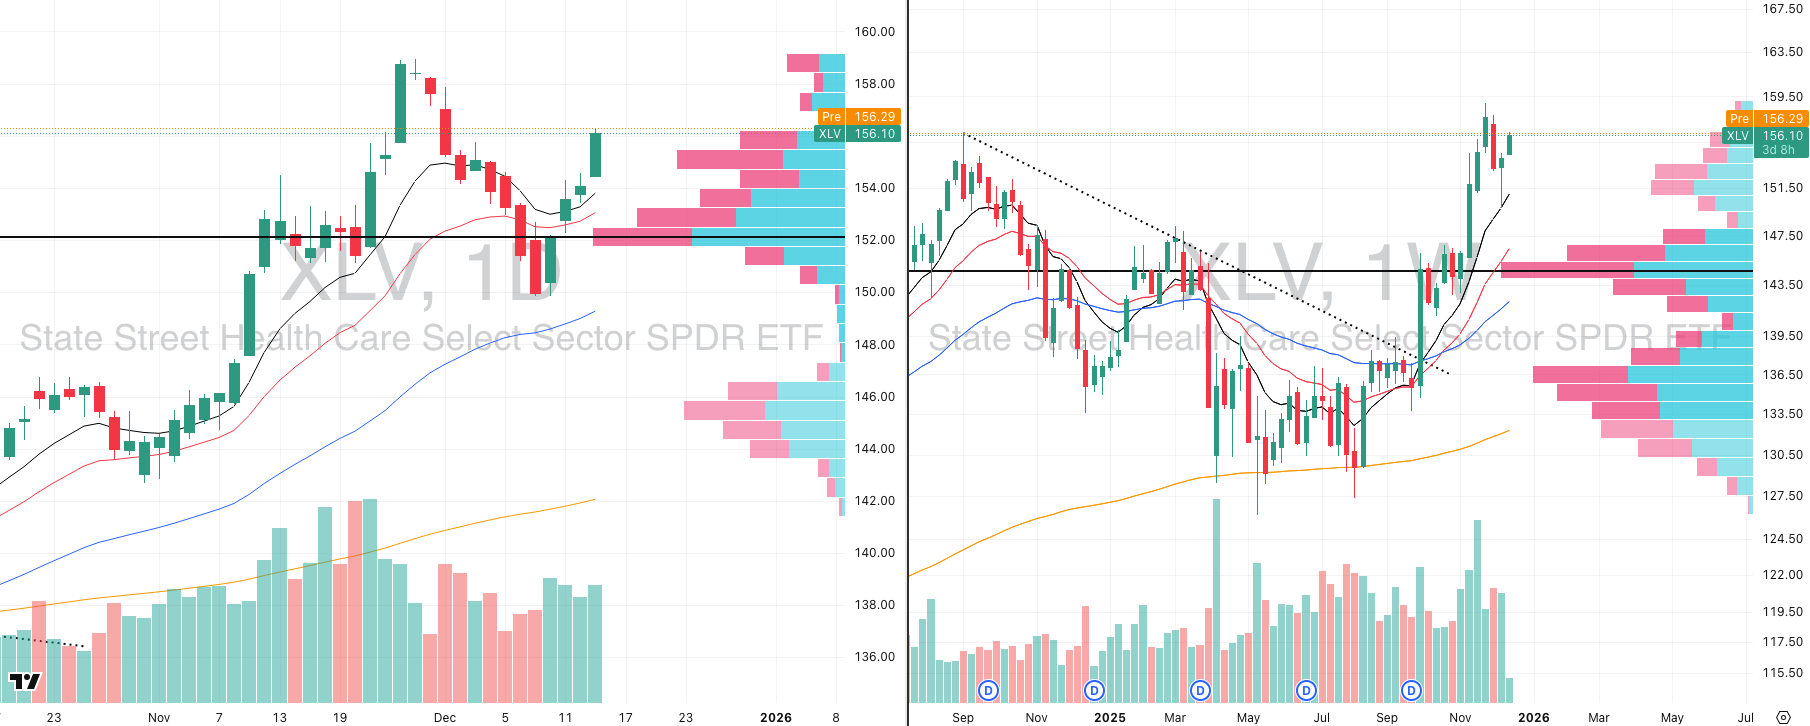
XLV VRVP Daily & Weekly Chart
Healthcare is in the early stages of a Stage 2 advance and that regime shift began the week of Sept 29, when XLV broke a downtrend that had lasted over a year.
The initial breakout above ~138 was the moment to press exposure, particularly in pharmaceuticals.
That phase rewarded aggression and wee are now past that stage, but this really should be a sign why it is so important to constantly do your daily scans and keep your finger on the market’s pulse to track rotation on the bigger timeframes.
Current structure
XLV recently pulled back sharply into ~150, lining up with the rising 10-week MA.
That pullback coincided with short-term weakness across healthcare leaders — especially pharma — and was quickly met with demand.
Many leaders have since reclaimed their levels and pushed higher.
How to manage exposure here
Later-stage breakouts tend to have lower win rates.
Pullbacks into weekly support are where risk/reward improves.
For traders already involved, these reactions into longer-term support are often add-on opportunities, not exit signals.

Did you find value in today's publication?This helps us better design our content for our readers |
Reply