- Swingly
- Posts
- They Tried To Break Growth. It Didn't Work.
They Tried To Break Growth. It Didn't Work.


MARKET ANALYSIS
What You Need To Know

The administration is framing the current environment as a renewed expansion phase, emphasizing GDP growth in the 2–2.8% range, cooling inflation, improving border data, rising energy production, and strong equity performance.
While public opinion surveys show many Americans still rate the economy poorly, markets trade forward expectations rather than sentiment polls, and equity indices continue to reflect resilience rather than contraction.
The headline focus on trillions in investment commitments and record equity highs reinforces a pro-growth narrative, which historically supports risk appetite so long as liquidity conditions remain stable.
The Supreme Court’s tariff ruling and the pivot to a new 15% global tariff introduce policy uncertainty, but futures held firm during the speech, suggesting markets currently view tariff adjustments as tactical rather than structurally growth-destructive.
Energy expansion remains an underappreciated macro tailwind, as higher domestic oil production and increased supply from Venezuela can act as a disinflationary buffer and reduce the probability of renewed cost-push inflation shocks.
If energy prices remain controlled, it strengthens the case for sustained corporate margin stability and supports longer-duration assets such as growth equities and crypto.
Political leadership is explicitly tying its credibility to stock market performance, which historically creates an implicit bias toward policies that avoid destabilizing equity markets.
Volatility spikes are being sold rather than expanded, which signals that market participants are absorbing uncertainty instead of repricing risk aggressively.
Breadth across capitalization tiers is improving, indicating participation is broadening rather than narrowing, which typically occurs in healthier market phases rather than late-cycle deterioration.
Current macro data reflects moderation, not contraction, with steady growth, easing inflation pressures relative to prior peaks, and no immediate signs of systemic liquidity stress.
Policy noise around tariffs, geopolitical tensions, and domestic political friction will persist, but unless it materially disrupts earnings expectations or liquidity conditions, markets appear willing to look through the headlines.
The tape is currently signaling controlled risk-on behavior, with growth stocks, crypto, small caps, and precious metals all finding buyers on weakness rather than breaking structure.
Nasdaq
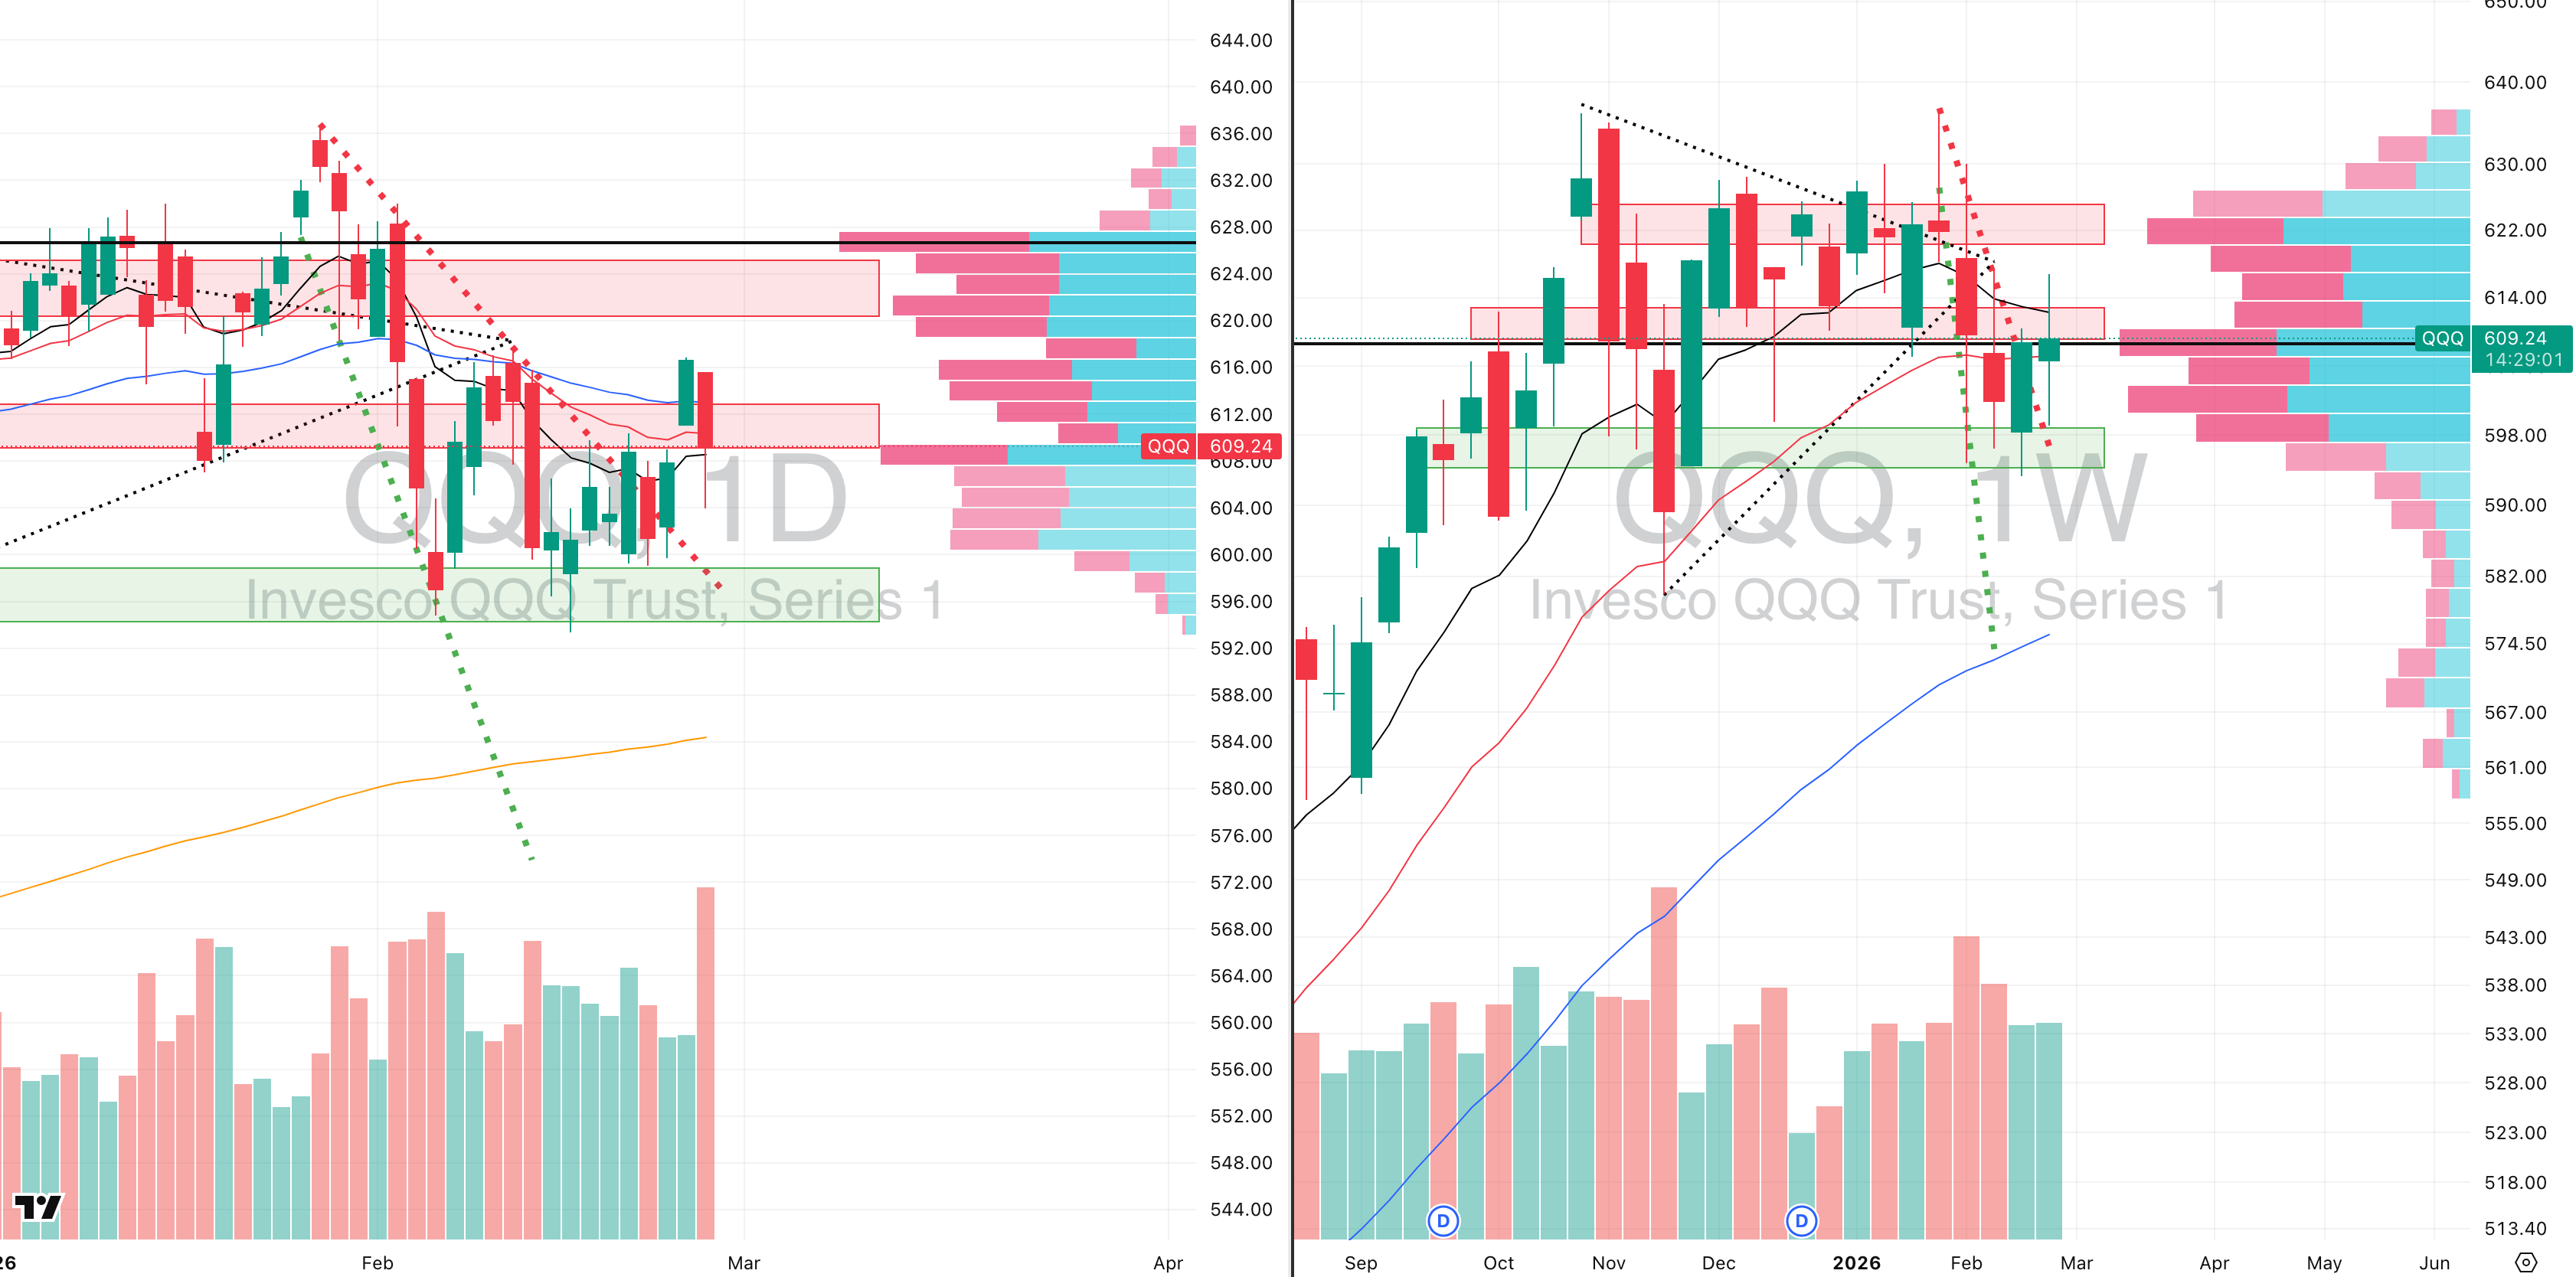
QQQ VRVP Daily & Weekly Chart

QQQE VRVP Daily & Weekly Chart
54.45%: over 20 EMA | 53.46%: over 50 EMA | 53.46%: over 200 EMA
We saw the expected shakeout yesterday as price moved down to fill Wednesday’s gap. QQQ tested $603, where roughly 8 million shares traded green versus 6 million traded red at the lows. That is a clear demand imbalance and it produced a red hammer candle.
Relative volume expanded aggressively, peaking near 170% during the session. Importantly, QQQ also managed to reclaim the lost 20-week EMA, which keeps the intermediate trend constructive.
Technically, this was a great retest of the prior descending broadening wedge breakout. We spent roughly 30 days inside that pattern, broke above it, and yesterday came back to retest former resistance. That level held and flipped to support. That is a clear character change.
Today will confirm whether that retest is valid, but structurally this is exactly what you want to see after a breakout: rejection → breakout → retest → defense.
The equal-weight version, Invesco NASDAQ 100 Equal Weight ETF, gives additional confidence. QQQE printed a similar red hammer but showed relative strength and stronger weekly structure, having already broken out on its weekly timeframe.
Breadth within the NASDAQ continues to improve. Nvidia drove most of the index weakness yesterday, but the broader tech complex is stabilizing.
Base case: Some volatility and tightness are possible, but the breakout and retest remain constructive. Growth still looks like the leadership trade.
S&P 400 Midcap

MDY VRVP Daily & Weekly Chart
57.03%: over 20 EMA | 63.56%: over 50 EMA | 67.58%: over 200 EMA
MDY printed an inside day after a sharp open flush that was quickly recovered. What matters is the close, and the close showed strength.
Price bounced again from the $651 level, the same area defended Wednesday. At that level, visible volume shows approximately 400,000 shares traded green versus 250,000 traded red, a significant buyer skew.
Relative volume continues to decline during consolidation, which is exactly what you want to see at highs. Declining volume in a three-week range signals price acceptance.
Breadth metrics in mid caps are slightly more extended, which means they are less “early-cycle” than NASDAQ. However, structurally there is no bearish signal here.
Base case: A few more sessions of tightness before another expansion higher.
Russell 2000

IWM VRVP Daily & Weekly Chart
51.82%: over 20 EMA | 55.98%: over 50 EMA | 62.81%: over 200 EMA
IWM continues to build an extremely tight base. Support and resistance are clearly defined, forming a strong volatility contraction pattern on the weekly timeframe.
Yesterday, IWM flushed on roughly 110% relative volume, bounced precisely off rising support, and closed strong. The ability to recover intraday after a high-volume open is constructive.
Relative volume overall remains in decline during the broader base, which supports the idea of accumulation rather than distribution.
This pattern is coiling. The weekly contraction suggests a sizable move is coming.
Base case: Either a few more days of tight consolidation or an immediate breakout. The setup strongly favors upside resolution.
FOCUSED STOCK
IREN: The Strongest Crypto Miner Coiling

IREN VRVP Daily & Weekly Chart
ADR%: 11.23% | Off 52-week high: -42.4% | Above 52-week low: +763.2%
IREN carries a 98 relative strength rating versus the SPX, positioning it among the strongest crypto-linked equities.
The stock has bounced repeatedly from a long-standing demand zone that dates back to September 2025. That level flipped to support in December 2025 and has held again in February 2026.
On Tuesday, IREN broke above its 10 and 20-day EMAs on roughly 100% relative volume, marking a legitimate breakout attempt.
Price is now consolidating just below the 50-week EMA, which also aligns with the weekly point of control. Yesterday’s bounce occurred directly at the daily point of control, confirming near-term demand.
This base has been forming for approximately 140 days, creating a well-developed intermediary trend base.
With Bitcoin and Ethereum printing confirmed morning star reversals and showing early signs of expansion, IREN is structurally positioned to potentially front-run strength in the crypto complex.
Base case: Tight consolidation under major resistance, strong relative strength, confirmed crypto reversals, and a long multi-month base. This is the type of setup that can resolve with acceleration if the underlying asset class continues higher.

Did you find value in today's publication?This helps us better design our content for our readers |
Reply