- Swingly
- Posts
- The Trend Is Alive- Here’s How We’re Playing It
The Trend Is Alive- Here’s How We’re Playing It
OVERVIEW
Breadth-Driven Strength Continues
🟢 Risk-On: CPI came in soft. NVDA is surging. Breadth remains strong across QQQ, MDY, and IWM, all coiling at or near highs.
📊 Healthy Consolidation Everywhere: Major indices are digesting prior gains on low volume, with clear volatility contraction behavior. Internals remain firm with leadership groups holding rising 10/20-EMAs.
🚀 Breakouts Setting Up: From semiconductors to small-cap momentum names and Chinese tech, we’re seeing setups across the board. Pullbacks are being bought. The path of least resistance is higher.

MARKET ANALYSIS
CPI Lands Soft, NVDA Rallies, Market Bids

This morning’s CPI print came in mostly inline, but with a dovish tilt:
Core CPI y/y: 2.9% (vs 3.0% expected)
Core CPI m/m: 0.2% (vs 0.3% expected)
Headline CPI y/y: 2.7% (vs 2.6% expected)
Inflation is not re-accelerating. And that’s exactly what bulls wanted to see. Rate cut odds for September are ticking higher again, and the Nasdaq is reacting first, leading the premarket bid.
Macro Fuel: NVDA + China Policy Shift
Nvidia surged premarket after stating it may resume AI chip sales to China with licensing support from the U.S. government. That’s a major reversal from prior headlines and reflects real easing on the U.S.-China trade front.
NVDA +5% premarket → boosting QQQ, SMH, and mega-cap tech
GXC (China equities) gapping up on improved sentiment
Semiconductors and AI getting a second wind
The Fed, Earnings, Rotation
With CPI behind us and earnings season kicking off, the market is now juggling three catalysts at once:
Fed policy expectations (cut odds rising)
Earnings from major banks this week
Sector rotation as money continues to flow into energy, metals, and now China
Tariff noise, Fed drama, and political volatility are all secondary until inflation forces the Fed’s hand, and right now, that risk just keeps fading.
Nasdaq
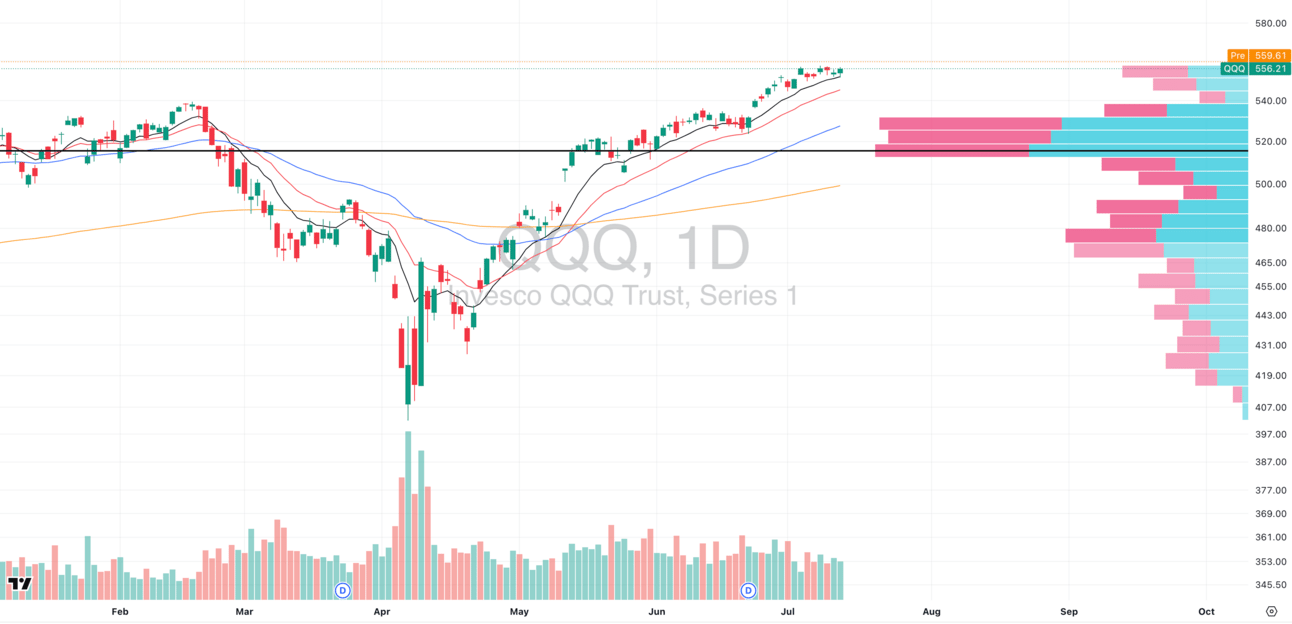
QQQ has been chopping in a narrow range for nearly two weeks, with declining relative volume, often a sign of bullish consolidation when seen in an uptrend.
📉 Volume divergence is forming
📈 The most bullish resolution will be a breakout on surging volume, and today might be the trigger.
With CPI coming in soft and NVDA surging on positive China headlines, the stage is set for a potential move higher. Most major AI/tech names are either breaking out (like NVDA) or bouncing from pullbacks (like PLTR), early signs that the next leg of the rally may already be in motion.
S&P 400 Midcap
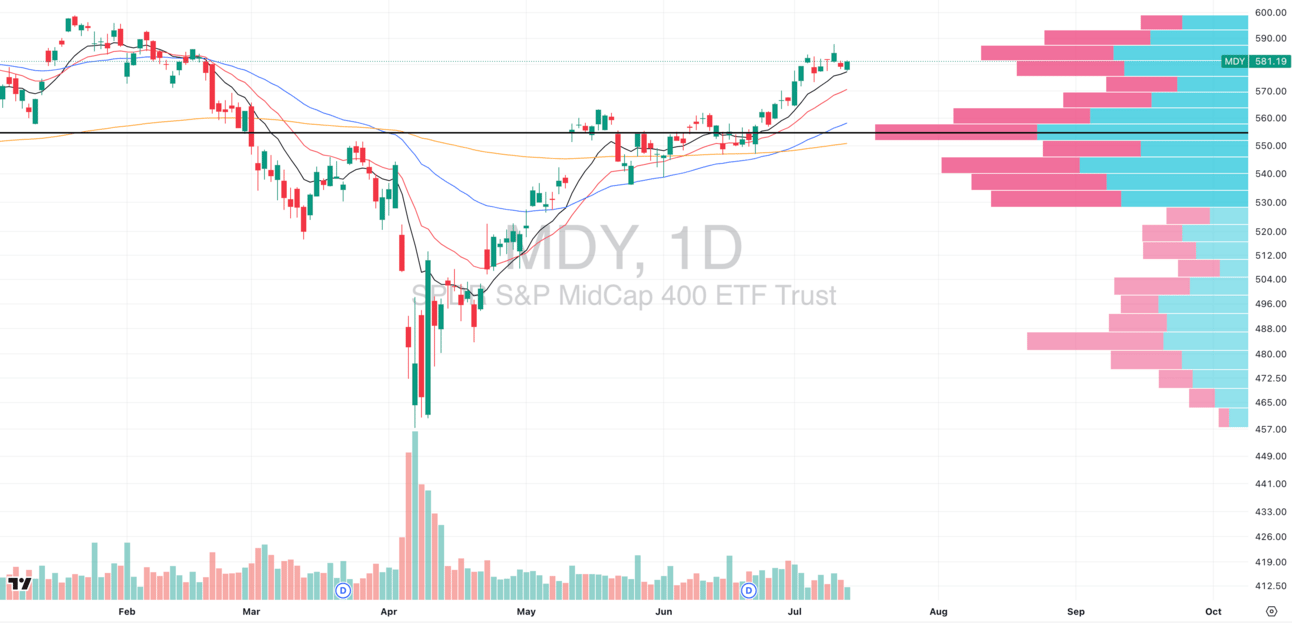
MDY VRVP Daily Chart
MDY continues to digest its explosive late-June rally, and this controlled consolidation is exactly what we want to see. When a breakout doesn’t immediately go vertical, it signals trend maturity and not exhaustion.
📉 Relative volume remains low
🔄 Price is holding tight near highs
🧩 This is a textbook volatility contraction pattern (VCP)
That pattern builds support on the way up and sets the stage for a high-quality continuation breakout. We’re already positioned here and watching for expansion.
Midcaps remain in the sweet spot.
Russell 2000
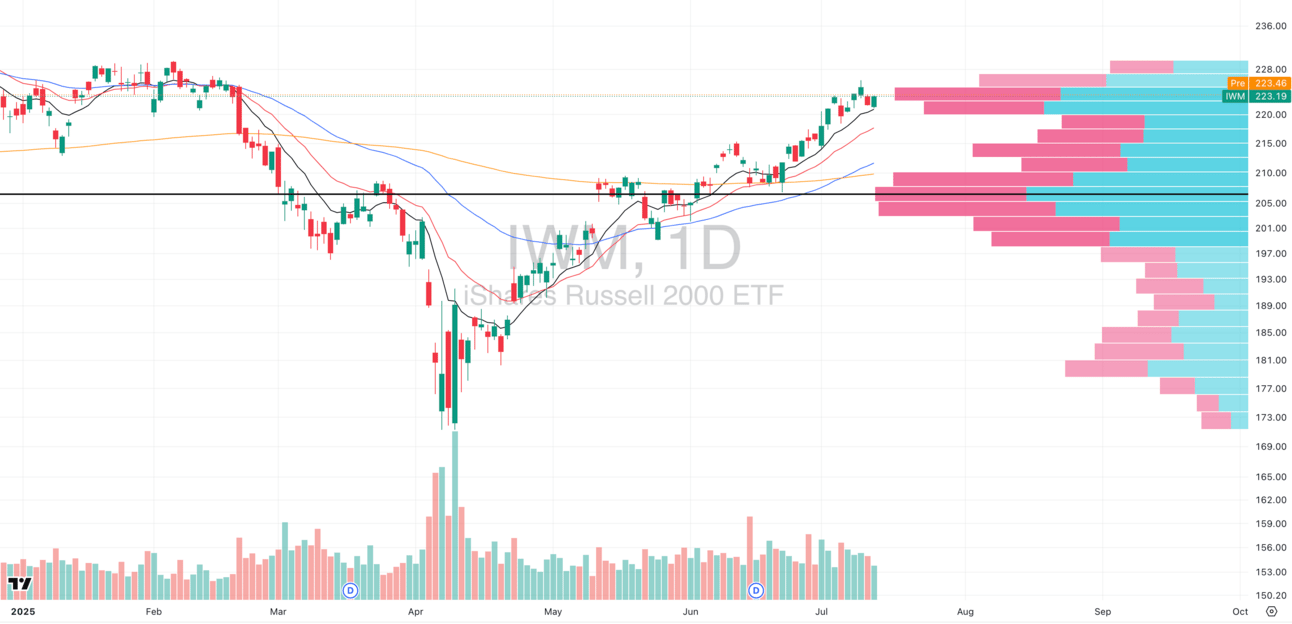
IWM VRVP Daily Chart
IWM printed a low relative volume inside day, bouncing right off its rising daily 10-EMA, a classic trend continuation behavior in a strong tape.
📊 We’re watching for a break over $225 with volume to confirm the next leg. Internals remain firm, and this is one of the healthiest segments in the market right now.
🧠 Breadth is the key here. Unlike indices that can mask underlying weakness, our small-cap scans continue to surface momentum leaders, most of which are holding rising 10/20-EMAs and showing real demand.
ADVERTISEMENT - The Oxford Club
This one setup turned $1,000 to $4,340 in 11 minutes.
Most Americans are thrilled to make 10% a year from the stock market…
But one professional trader just recorded a demonstration on how a $1,000 into this simple trade setup could have turned into $4,340 in just 11 minutes.
His secret?
A rare, little-known market trade setup called “Opening Bell Aftershocks” that happens at 9:30 A.M. sharp. It has produced gains like:
✅ 133%
✅ 261%
✅ Even 334%
…often within minutes of the open.
No chasing headlines. No overnight risk.
Just a repeatable setup that strikes after the chaos.
FOCUSED STOCK
CRCL: A Recent IPO Monster
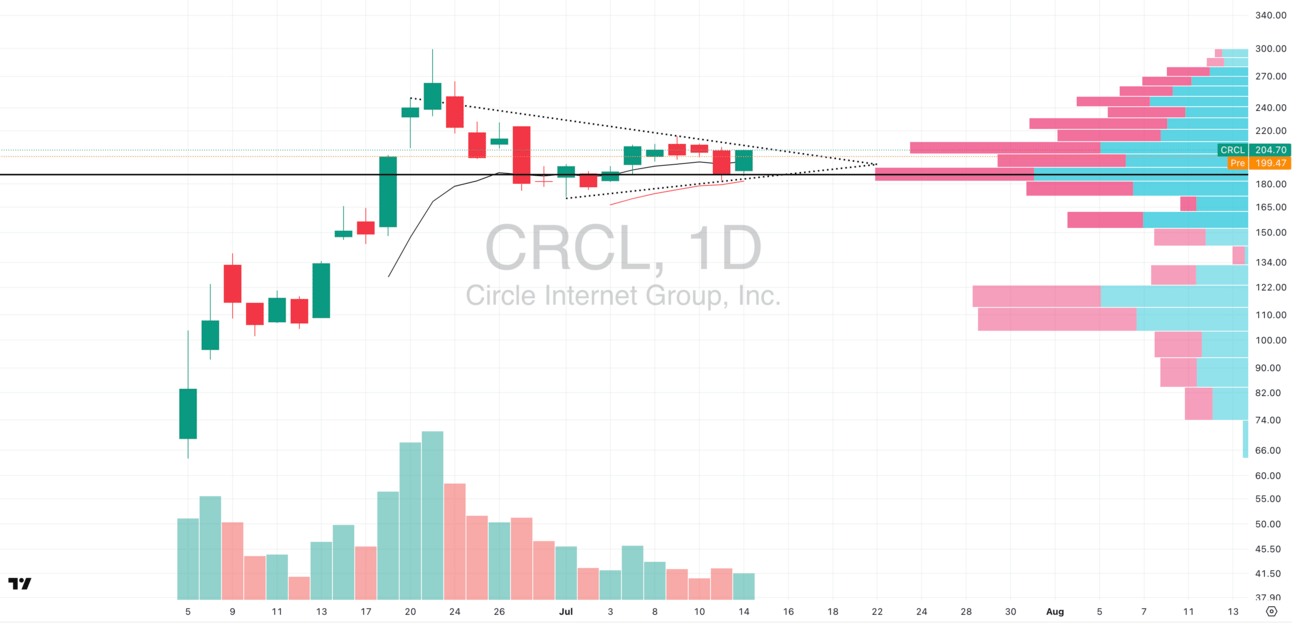
CRCL VRVP Daily Chart
We love IPO bases as the lack of prior supply often leads to explosive moves when they resolve. CRCL has pushed hard off its debut and is now forming a classic volatility contraction base with rising higher lows.
Price is now coiling between the rising 10/20-EMAs
Relative volume is tightening
Visible supply on the VRVP caps around $210
🔔 If we see a breakout over $210 on strong intraday volume, we’ll look to initiate long exposure. This is the kind of clean structural setup where price discovery can accelerate fast, and we want to be there when it happens.
FOCUSED GROUP
XLF: Financials Ready To Bounce
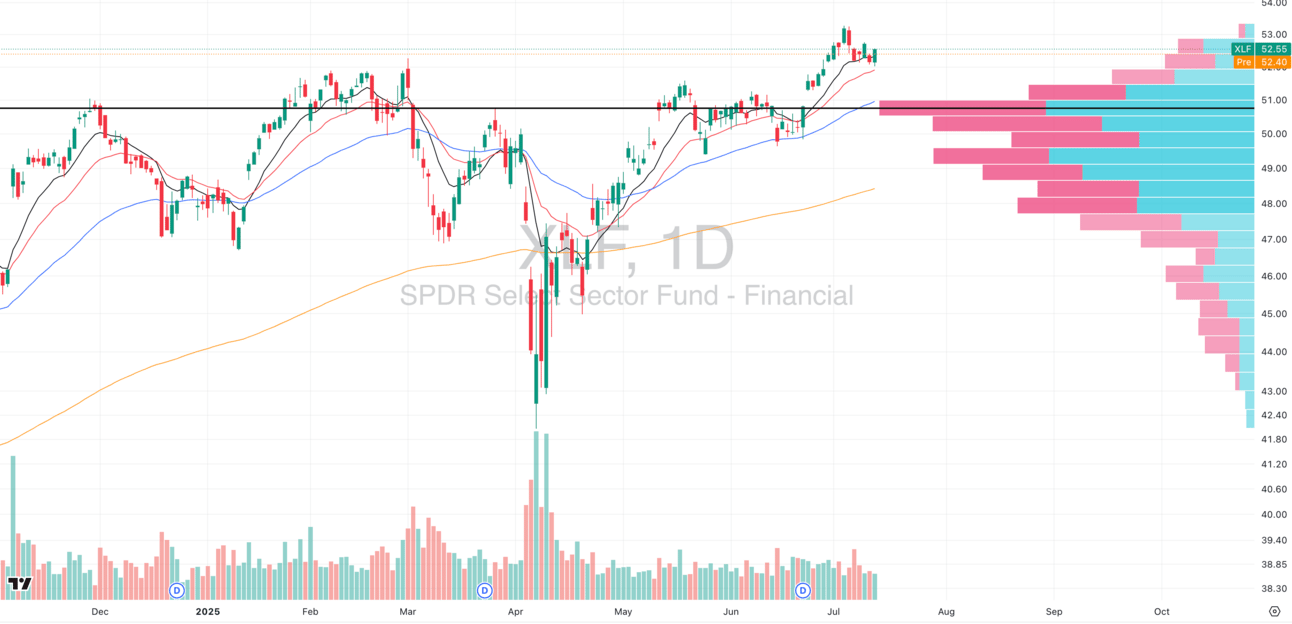
XLF VRVP Daily Chart
The Financials sector (XLF) which is one of the true leadership groups since the April 2025 capitulation, has spent the past two weeks digesting its prior leg higher. We saw a short-term mean reversion event in early July, pulling XLF back into its rising daily 10-EMA.
📉 The pullback has been orderly:
No elevated volume
No breakdown in structure
10-EMA continues to act as dynamic support
This kind of behavior with tightness, low-volume reversion, clean bounce off support, is exactly what we look for when gauging whether a pullback is buyable or a trend is failing. So far, the signal is clear trend health.
Context Within Rotation
We're seeing the same pattern across other leadership sectors:
PLTR in cybersecurity rebounding after tracking CIBR lower
MU in semiconductors holding 20-EMA and resuming higher
HOOD in fintech refusing to break, showing real RS
Financials remain a high-conviction area of the market, and we’re heading into a critical earnings window for the group.
With big banks like JPM and GS reporting this week, the reaction to earnings will dictate whether XLF continues leading or transitions into a more sideways consolidation.

Q&A
Got a trading question? Hit reply and ask!
Q: “Do you just sit in front of your screen all day? How do you actually catch those 5-minute opening range breakout candles?”
A: We get this a lot and we love the question, because the truth behind it flips most assumptions about trading on their head.
Yes, we’re at the screens. But no, we’re not staring at charts hoping for something to happen.
The breakout you see us post or act on in real-time doesn’t come from intuition.
That’s the result of 2–3 hours of structured prep before the bell rings, and years of repetition building a reliable, high-conviction system around it which has been back/forward tested, and refined with countless monte carlos.
💡 99% of the Work Happens Before the Market Opens
You do not get paid in this game for reacting. You get paid for preparing with precision, then executing only when your criteria is met.
The job starts before most people are awake.
📋 Our Morning Process: Every Day, Without Exception
By 9:15 AM Eastern, this is already done:
🔎 We’ve reviewed every open position for structure, trend integrity, and risk
🧭 We’ve re-scanned our entire universe of tradable names, including all high ADR%, RS, and sector leaders
🧠 We’ve assessed where each name is within its trend: is it pulling back into a buy zone, breaking out of a base, or fading into exhaustion?
🛠️ We’ve reviewed the major indices and ETFs (SPY, QQQ, RSP, IWM, XLF, SMH, etc.) and internal breadth readings to understand the macro tone
💡 We’ve adjusted for exposure, margin, and liquidity, tracking Special Memorandum Account (SMA) and excess equity levels so we know how much risk is on, how much room we have to scale, and whether we need to protect or press
🚨 Execution: We Don’t React, We Trigger
We use 5-minute Opening Range Highs (ORH) as buy triggers and Opening Range Lows (ORL) as sell zones or stop references. But the key is this:
📌 We set alerts on these levels before the market opens.
If a stock we’re watching breaks ORH with expanding volume, we’re notified.
If one of our core positions undercuts ORL, we evaluate whether to trim or exit based on structure.
We’re not “catching” breakouts, we’ve already defined the levels, set the system, and just let it play out.
🔍 Why This Matters
Because we want you to win, and if you’re serious about trading, you need to know this:
Real edge doesn’t come from watching the market longer… it comes from preparing better.
You could spend 8 hours a day at your desk and still underperform someone who spends 90 minutes preparing with focus and rules.
Here’s what we want to drive home:
✳️ Success in this game is process-based, not talent-based
✳️ Every winning trader we know is ruthless about their prep
✳️ The cleanest trades, the ones that move fastest and work best, come to those who are already ready
If you want to catch the breakout, you must be at the level where it’s already expected, not something you stumble into.
Join Swingly Pro and get the full playbook.
Our complete daily prep breakdown
Real-time trigger levels and breakout zones
Live watchlist scans with volume alerts and setups
Exact positioning logic, risk modeling, and portfolio management strategy, every single day.
That’s all inside Swingly Pro → see what’s included
Reply