- Swingly
- Posts
- The Trade Everyone’s Missing
The Trade Everyone’s Missing
In partnership with

OVERVIEW
What You Need To Know
Macro → Markets are flat ahead of Powell at Jackson Hole. Expect the Fed to guide toward a 25bps September cut, but with emphasis on credibility and independence. All eyes on Friday.
Nasdaq → QQQ bouncing off the 10-EMA on light volume (watch for cracks). QQQE is weaker, forming a head & shoulders — a break of yesterday’s lows risks a -0.85% pullback to its 50-day EMA.
Midcaps → Structurally stronger. Higher-volume bounce off the 20-EMA with prior resistance now acting as support. Clean if/then setup: hold = long bias, lose $582 POC = short play.
Small Caps → Surprisingly strongest structure. Holding $227 breakout level, but on low volume. Watch for expansion confirmation.
Focused Stock → ASM consolidating under $4 breakout after strong run. Precious metals still leading; defined risk/reward for continuation.
Focused Group → BLOK ETF testing critical 10/20-EMA cluster. Above $60 = breakout, below $57 = head & shoulders confirmed. Top 10 holdings drive outcome.

MARKET ANALYSIS
Consolidation & Digestion

There isn’t a great deal happening on the macro front right now. Markets are in a holding pattern, with traders and institutions alike waiting for Powell’s speech at Jackson Hole.
This event often serves as a stage for the Fed to reset expectations, and given where we stand, the consensus is that Powell will use the platform to guide markets toward a 25bps cut in September and signal a more accommodating stance into year-end.
What makes this moment notable is that it’s likely Powell’s final Jackson Hole appearance as Fed Chair, which adds weight to his message. Expect him to emphasize the Fed’s independence and credibility at a time when politics and policy are becoming increasingly intertwined.
Nasdaq

QQQ VRVP Daily Chart

QQQE VRVP Daily Chart
Market Breadth
% over 20 EMA: 50.49% | % over 50 EMA: 49.50 % | % over 200 EMA: 63.36%
The QQQ continues to show relative strength against its equal-weighted counterpart (QQQE), a trend that’s been in place for months. Structurally, QQQ is staging a low-relative-volume bounce off its rising daily 10-EMA.
That’s healthy enough for now, and the base case is that the 10-EMA holds as support.
But volume dynamics matter. The prior three down sessions came on high relative volume, while yesterday’s bounce came on lighter volume — a divergence worth monitoring closely. Sustained upside usually needs confirmation from both price and participation.
The real weakness shows up in QQQE. The equal-weight index is sitting inside a clear head-and-shoulders reversal formation.
Yesterday’s lows mark the neckline: a failure there would likely trigger a pullback of ~0.85% into the rising 50-day EMA, which has acted as support multiple times over the past two weeks.
S&P 400 Midcap

MDY VRVP Daily Chart
Market Breadth
% over 20 EMA: 57.25% | % over 50 EMA: 60.00% | % over 200 EMA: 53.00%
Structurally, the midcaps look more constructive than the Nasdaq right now. Yesterday’s bounce came on higher relative volume, right at the rising daily 20-EMA. Even more importantly, prior resistance is now acting as support — a key ingredient for the bull case.
This sets up a clean asymmetric trade:
Long case → As long as MDY holds the 20-EMA and builds above this reclaimed support, there’s a solid case for continuation higher.
Short case → If MDY fails to hold and breaks below the $582 POC level on high relative volume, it opens a short opportunity toward the rising 50-day EMA (~–1.87% lower). Expect some chop before that level, but the probability path would shift bearish.
This is exactly the type of setup where if/then preparation matters most. You’re not predicting, you’re positioning for whichever side confirms with volume.
Russell 2000

IWM VRVP Daily Chart
Market Breadth
% over 20 EMA: 60.12% | % over 50 EMA: 59.35% | % over 200 EMA: 52.18%
Surprisingly, small caps are showing the strongest structure out of all three groups — a rare occurrence, as they almost never lead in periods of stress.
Unlike the choppier Nasdaq and midcaps, IWM’s pullback has been cleaner and more linear, holding support right on top of the $227 highs from the July 2025 consolidation range. Structurally, this is constructive.
However, yesterday’s session came on low relative volume, which tempers conviction. There’s still room for more downside if selling pressure reappears.
Bull case → Holding above $227 keeps the breakout structure intact, offering potential for continuation if volume expands.
Bear case → A break back below $227 on high volume would shift momentum toward a deeper retrace, with the rising 10-EMA as the first logical downside target (-0.71% move)
At present, the midcaps offer a neater pullback entry, but the small caps deserve close watch given their unusual relative strength.
The Cross-Chain Giant Set for 1,000%+ Gains

As crypto markets surge, one multi-chain financial protocol is being targeted for massive institutional investment before retail discovers it.
Its transaction volume is skyrocketing across all major blockchains while its price remains suppressed as retail has yet to discover it – creating a coiled spring ready to release.
FOCUSED STOCK
ASM: Precious Metals Momentum

ASM VRVP Daily Chart
ADR%: 6.02% | Off 52-week high: -12.9% | Above 52-week low: +351%
If you’ve been diligent in your daily scans, you’ve probably noticed that precious metals have quietly led the market for nearly two weeks. Within that theme, ASM stands out as a name to keep on your radar.
Setup → Yesterday’s session came on low relative volume, as ASM contracted right under its breakout level around $4.
Structure → The stock has already made a strong move since late July, then pulled back constructively into support at the rising 10- and 20-EMAs, with its POC anchored around $3.60.
Character → Price action suggests healthy digestion of prior gains rather than distribution — a positive sign for potential follow-through.
Why it matters:
Sector leadership – Precious metals have been among the strongest groups in recent sessions. Trading leaders in leading sectors has historically offered the best odds of success.
Tight contraction – A low-volume coil just under resistance often precedes an expansion move.
Defined risk – With the POC and EMAs stacked below, risk can be kept tight relative to potential upside.
👉 Swingly PRO members have already been ahead of this move, with several holding early positions across the precious metals segment.
FOCUSED GROUP
BLOK: A Head & Shoulders Reversal?
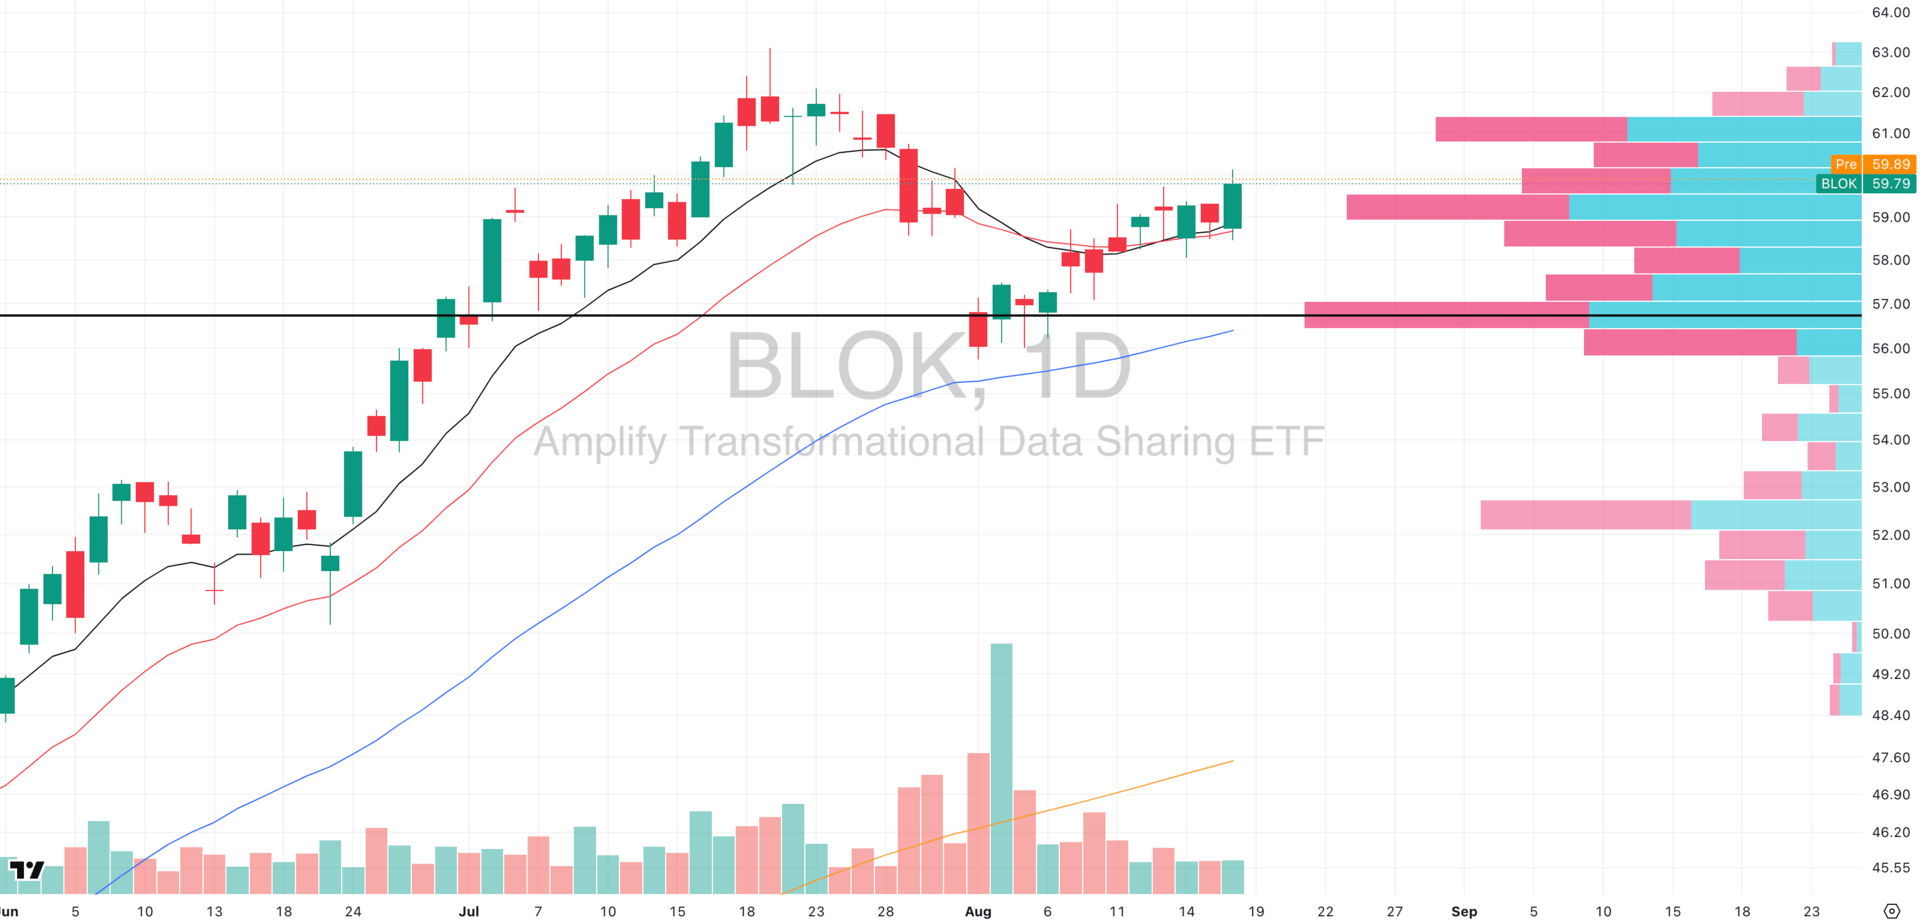
BLOK VRVP Daily Chart
The BLOK ETF, which tracks blockchain and crypto infrastructure names, is sitting right at a critical juncture.
Over the past two weeks (July 31–present), BLOK has pushed higher on declining volume which typically suggests a bearish divergence that hints at fading participation.
Yesterday’s session brought a constructive bounce off the 10- and 20-EMA cluster, but this area is now the line in the sand.
Key technical levels to monitor:
Breakout trigger → A push above $60 would invalidate the developing head and shoulders pattern and open the door for further upside.
Breakdown risk → A failure of the 10/20-EMA cluster would target the Point of Control (POC) near $57 (~-5% lower). That would confirm the head and shoulders setup, with real downside risk if the 50-day EMA at $56 gives way.

Credit: Yahoo Finance
The top 10 holdings make up ~40% of BLOK’s market cap, meaning leadership there will determine whether this ETF breaks higher or rolls over.
We really encourage everyone to take a look at each holding above and see how they are performing. This is how you evaluate an index.

Q&A
Got a trading question? Hit reply and ask!
Q: “You mentioned edge erosion, can you explain that please? Do we need to trade different systems/strategies at different times? How do we know which?”
Edge erosion happens when the market environment shifts and the math behind your system no longer delivers positive expectancy. The setups still appear, but their follow-through decays- not because the system “broke,” but because the regime changed.
In 2020–2021, breadth was broad, liquidity was abundant, and institutions were piling into growth. A simple breakout system on daily charts delivered huge runs.
The average breakout in leaders followed through for weeks, sometimes months. Win rates for trend systems spiked into the 55–60% range, and profit factors (total gains ÷ total losses) ran >2.0.
In 2022, the opposite: breadth collapsed, leadership narrowed, volatility spiked. The same breakout system kept triggering entries- but instead of trending, breakouts failed after 1–2 days.
Win rate sank to the low 30s, profit factor dropped <1.0. Expectancy turned negative. That’s edge erosion in action.

When the win rate falls and average loss rises, expectancy flips red. At that point, pressing the same strategy with the same aggressiveness mathematically guarantees you bleed capital.
So what do you do? Switch systems completely?
Not necessarily. Most professional traders we look up to don’t run 10 different systems- they run a few, but adapt how and when they apply them.
Green-light regime (breadth expansion, low vol): Run your breakout/trend system at full size. These are the periods when multi-week runs occur.
Red-light regime (breadth deterioration, choppy vol): Don’t abandon trading, but adapt your horizon. Shorten to momentum bursts or pullback longs into weekly support.
A great example: Right now, daily breakouts above highs have a higher fail rate. But the strong stocks pulling back to their rising e.g. weekly 10-EMA (while above longer-term support) have been presenting a high follow through rate and solid R/R.
Remember: Your edge isn’t static. It’s conditional.
The job isn’t to predict where the market goes, but to know in advance when your edge is maximized and when it’s degraded. That’s why we map “if–then” scenarios in Swingly: so you know whether to press, step back, or shift tactics.
Think poker… the professionals don’t switch from Texas Hold’em to Blackjack when they run cold. They fold more, size down, and wait for odds to flip back in their favor. Same principle here.
In Swingly Pro, we talk about how to build these exact systems so no member has to guess. We all know exactly when the market is ours to attack, and when it’s time to step aside and raise cash
This is the power of trading alongside a team → see what’s included
Reply