- Swingly
- Posts
- The Strongest Setup in the Market — And It’s Not Tech
The Strongest Setup in the Market — And It’s Not Tech
In partnership with

OVERVIEW
Small Caps Shine in a Choppy Tape
🟧 Moderate Risk-On
Price action remains very erratic and two-sided, keeping conviction tempered despite yesterday’s relative strength in small caps.
Macro backdrop: Retail Sales (+0.5% expected) is the only notable release today — unlikely to outweigh the CPI/PPI shocks already reshaping Fed cut probabilities and market positioning.
Indexes diverging: QQQ shows distribution signs, MDY defending support but reversing aggressively on PPI, and IWM holding a key breakout level with strongest breadth gains.
Sector leadership: Pharma (XPH) continues an explosive breakout, but is stretched short-term; Healthcare (XLV) attempting a structural base.
Tactical read: Environment still hostile to trend-following systems in the short term — focus on relative strength leaders, keep position sizes at the low-to-mid range of your playbook until volatility contracts.

MARKET ANALYSIS
The Choppy Conditions Continue
Today’s macro calendar is relatively light compared to the CPI and PPI shocks earlier this week. The only notable U.S. release is July Retail Sales, expected at +0.5% versus +0.6% prior.
While retail data matters for gauging consumer demand, it’s unlikely to rival the market impact of Tuesday’s CPI (cooler-than-expected) and Thursday’s PPI (scorching hot) — both of which have already reshaped rate-cut expectations and injected fresh volatility into equity markets.
What Retail Sales Measures:
The report tracks the total value of goods sold by retailers — from big-box stores to online platforms — and is a direct pulse check on U.S. consumer spending.
Because consumer spending makes up roughly two-thirds of U.S. GDP, retail sales is a key real-time read on economic momentum.
Retail sales surprise to the upside → reinforces the “resilient consumer” narrative, but could stoke concerns about inflation persistence.
Retail sales miss → points to softening demand, but won’t override the inflation prints already baked into market positioning.
Nasdaq
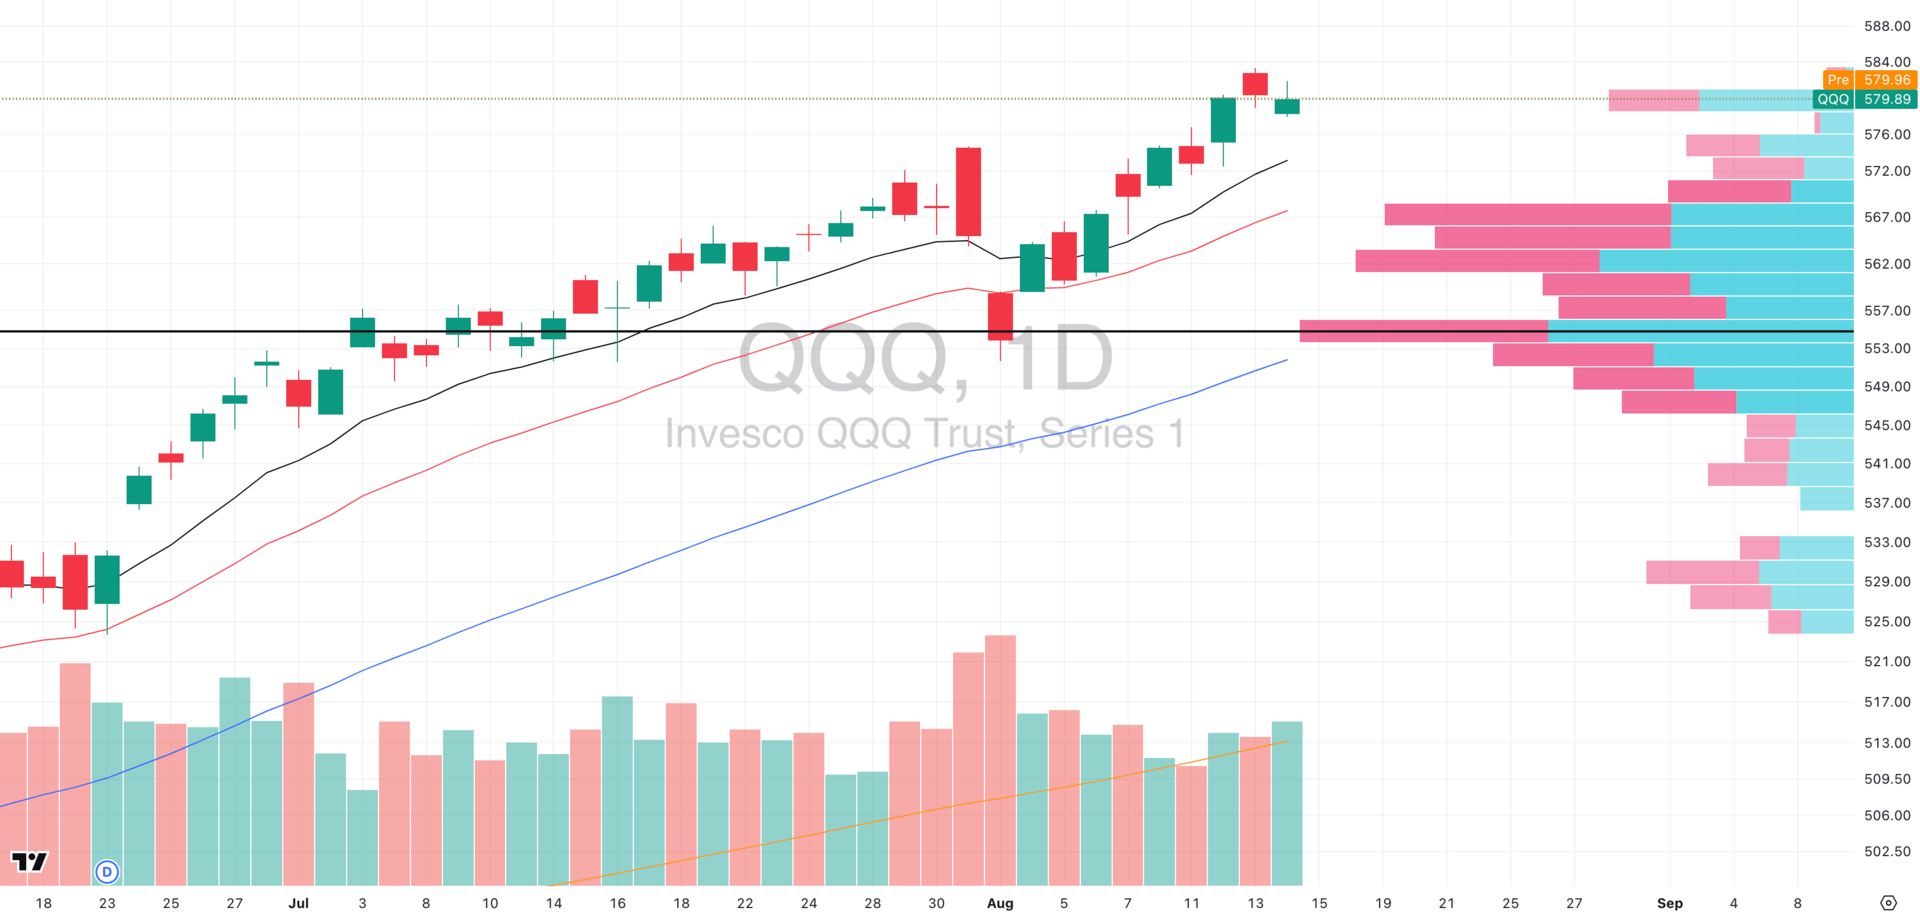
QQQ VRVP Daily Chart
Market Breadth
% over 20 EMA: 49.50% | % over 50 EMA: 52.47% | % over 200 EMA: 63.36%
QQQ faded on the hotter-than-expected PPI, closing lower on elevated relative volume. Despite being cap-weighted toward the market’s strongest mega-cap tech names, the index printed a green inverted hammer, often a short-term continuation pattern to the downside.
Key Levels:
$575.57 gap-fill (≈ -0.67% from yesterday’s close) is the primary downside magnet.
Rising 10-EMA sits just below, adding potential confluence support.
Read: Relative volume declined into the Aug 11 highs and has now picked up during this pullback — a sign of distribution. Until breadth meaningfully expands, new long exposure here remains lower conviction.
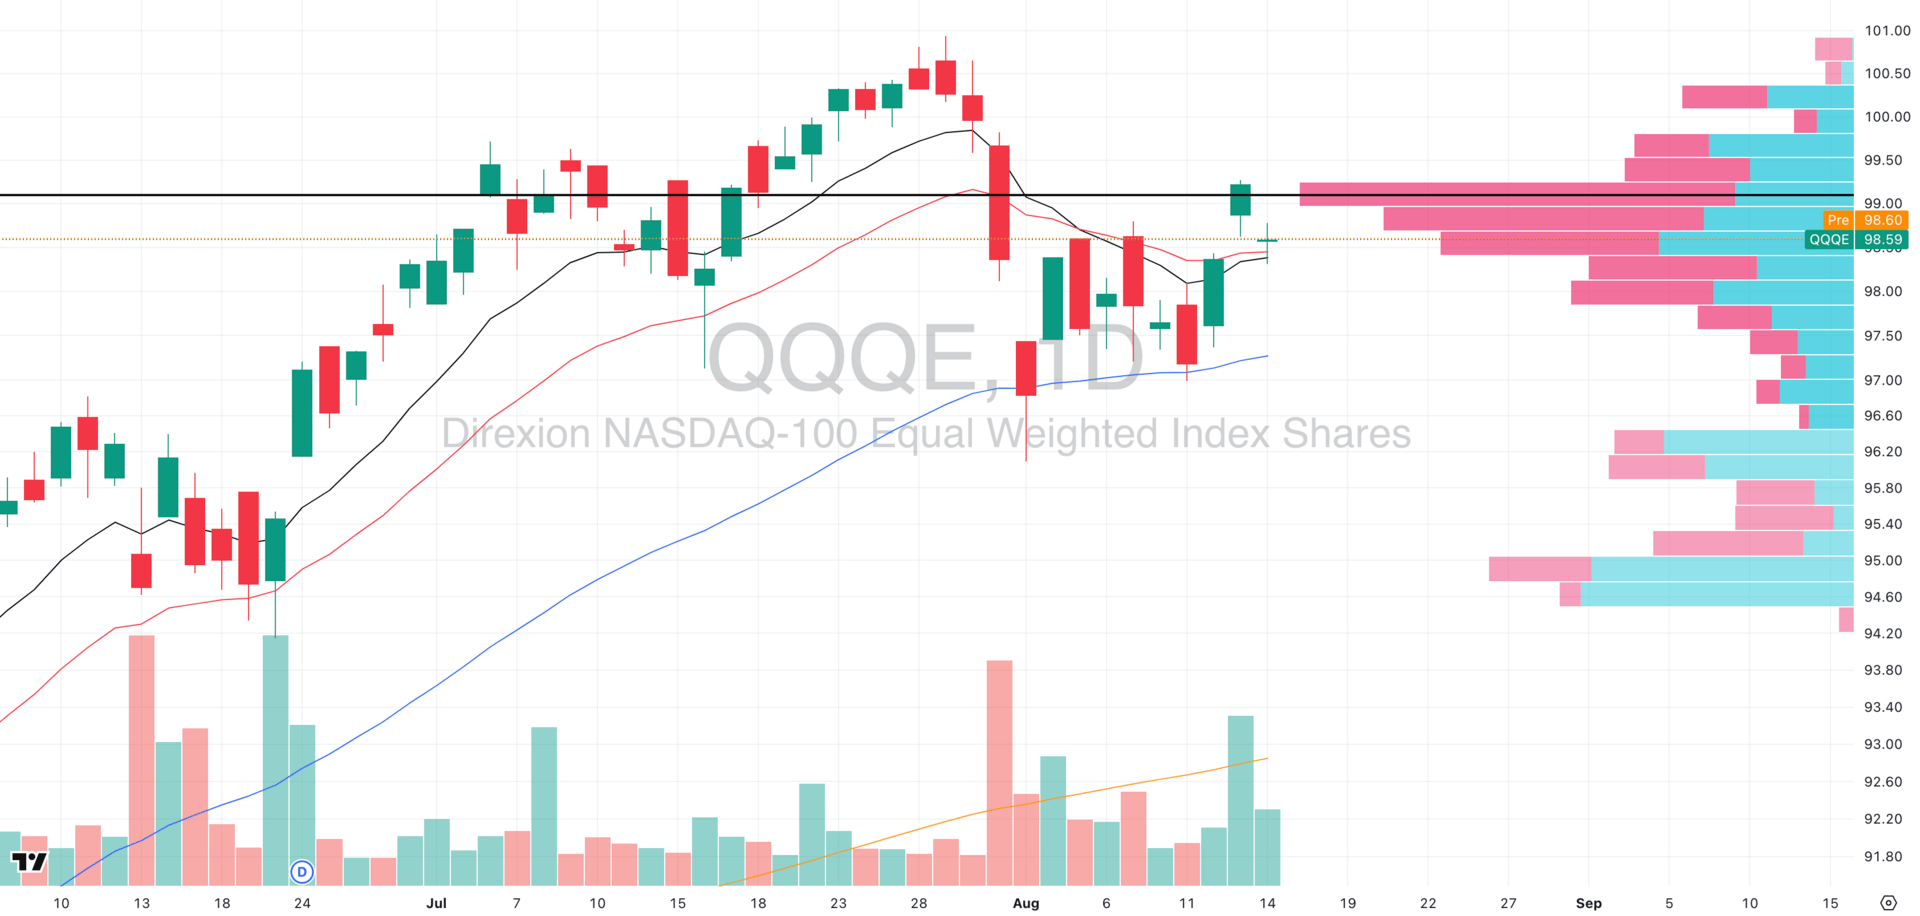
QQQE VRVP Daily Chart
QQQE lagged sharply yesterday, gapping down and closing lower with a green doji resting on the rising 10-EMA and 20-EMA — signaling indecision after an otherwise constructive run this week.
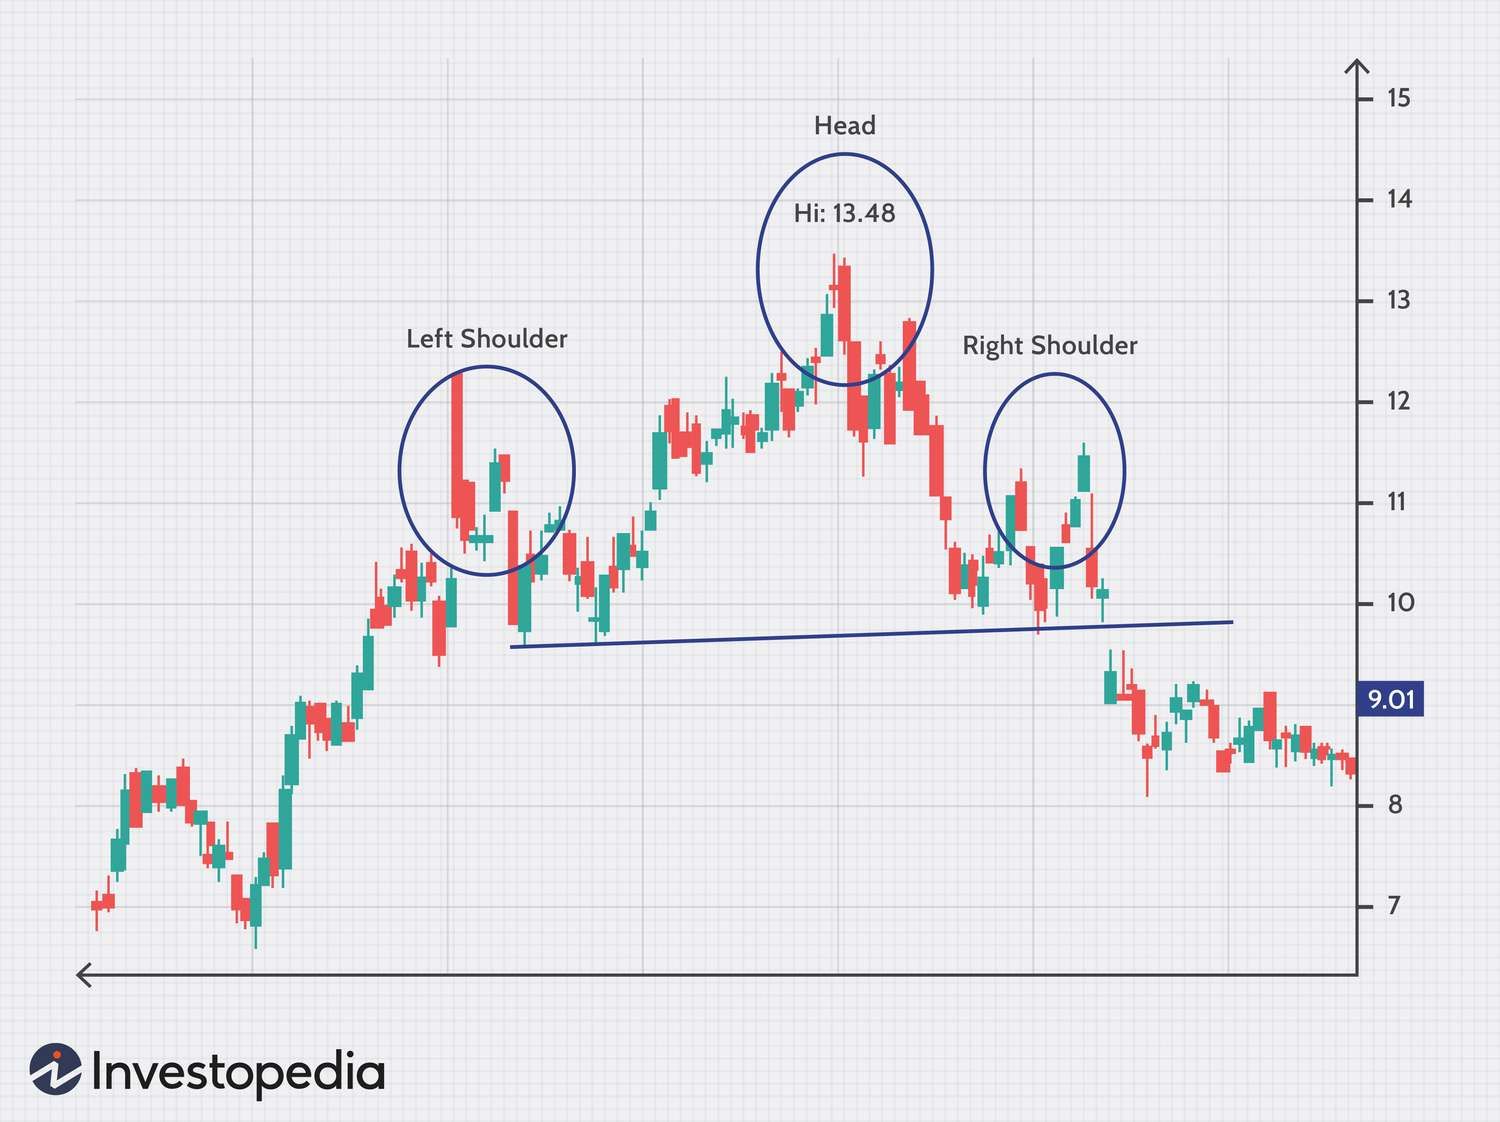
We’re also starting to see the early stages of a potential head-and-shoulders formation. While not yet confirmed, it’s a classic reversal pattern that deserves attention given its statistical edge (Thomas Bulkowski’s research on >2,800 trades):
Rank: 9/36 (1 = best)
Average decline: -16%
Break-even failure rate: 19%
Pullback rate: 68%
% hitting target: 51%
The key here: a confirmed neckline break would imply that recent breadth expansion in the Nasdaq 100 is stalling, shifting leadership risk back toward the mega-cap-heavy QQQ. Until then, this remains a pattern-in-progress, not a sell signal — but traders should be alert to any failed retests of the 10/20-EMA zone.
S&P 400 Midcap
MDY VRVP Daily Chart
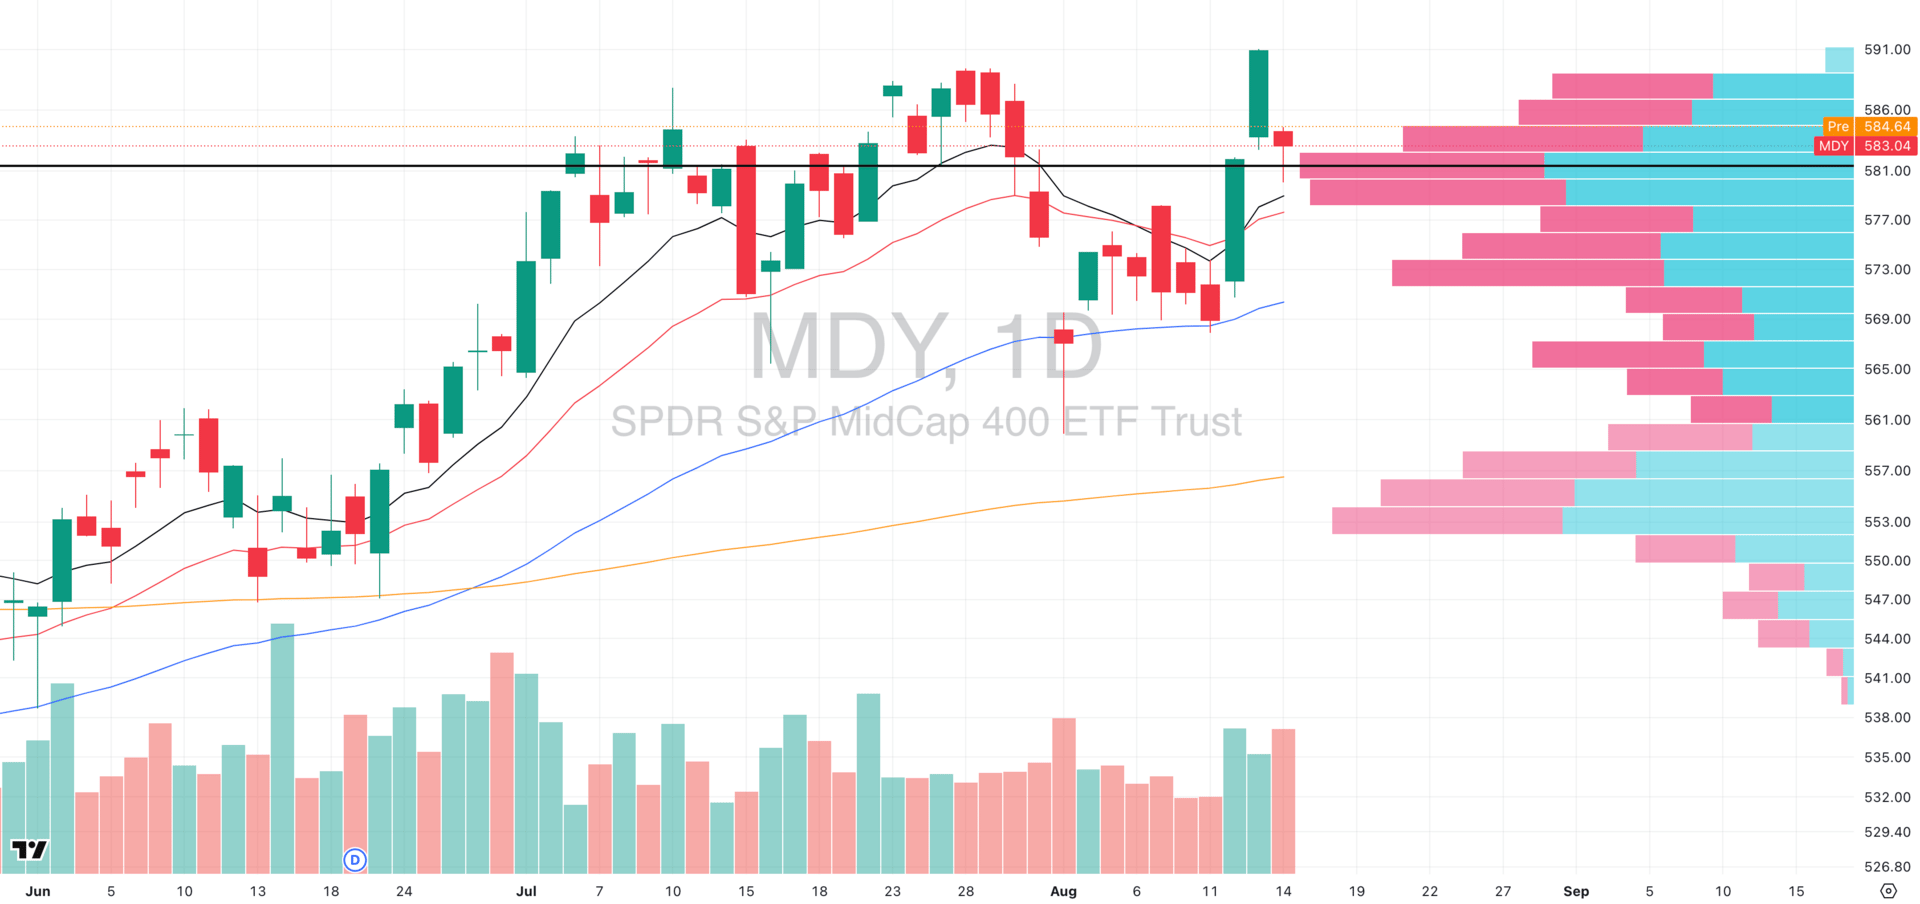
Market Breadth
% over 20 EMA: 60.84% | % over 50 EMA: 63.34% | % over 200 EMA: 54.86%
Midcaps saw a sharper pullback than other major segments yesterday, retracing on very high relative volume and fully closing the small gap left from Tuesday’s CPI-driven euphoria.
A red doji formed into the close — signaling that buyers did step in late to defend against a deeper breakdown below the rising 10-EMA and 20-EMA.
Still, the price action reinforces what many traders have been feeling all month: this is an erratic market where most trend-following systems are at elevated risk.
Key level to watch: the rising 10-EMA at $580, which acted as precise support yesterday.
A sustained break below would shift momentum control back to sellers and open the door for a deeper retracement toward the July value area.
Russell 2000
IWM VRVP Daily Chat
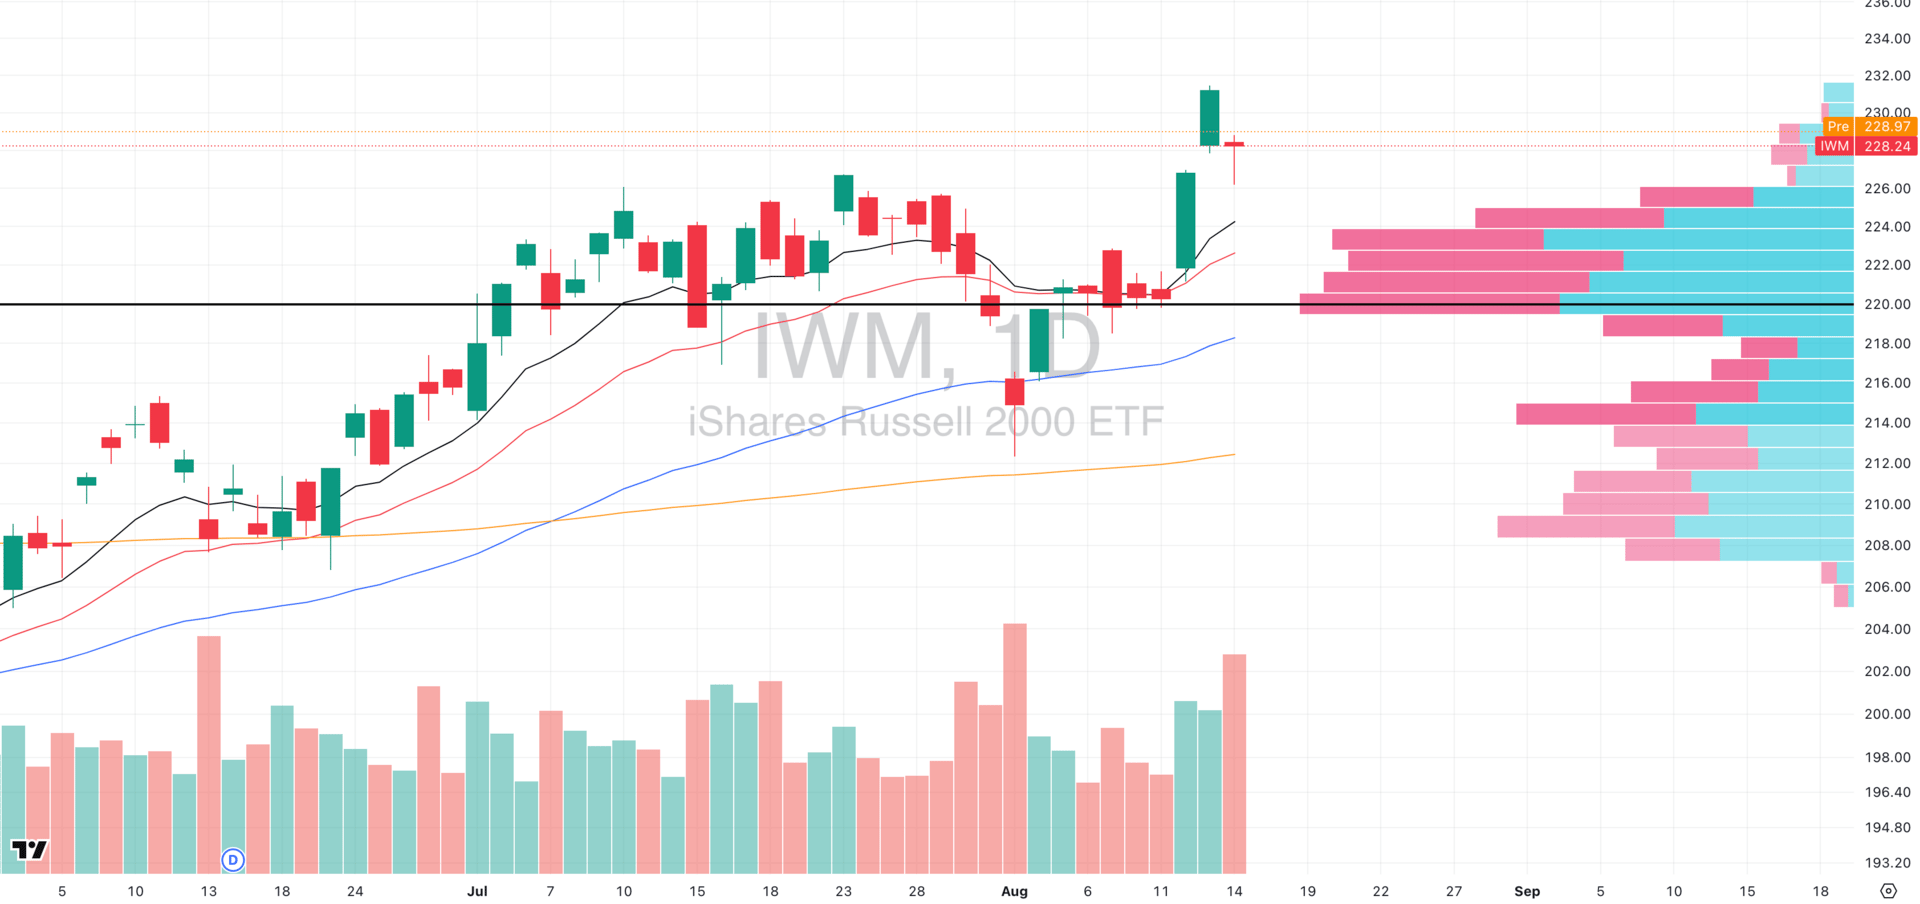
Market Breadth
% over 20 EMA: 63.22% | % over 50 EMA: 62.51% | % over 200 EMA: 53.10%
Small caps outperformed all other segments yesterday, with a strong session on very high relative volume — and this is constructive despite the overall choppy environment.
Like MDY, IWM filled its CPI gap, but held the low from Wednesday’s gap-up and closed with a long lower tail — clear evidence of demand stepping in. The index also tested the $226 level we highlighted in yesterday’s session as a key demand zone. This area, which capped price through all of July, has now acted as support — a bullish change in character.
From here, the ideal setup would be for IWM to tighten into a volatility contraction pattern before attempting a breakout higher. Structurally, small caps remain the most bullish of all three major segments (QQQ, MDY), supported by:
High short interest → fueling an ongoing squeeze.
Macro tailwind → potential rate cuts disproportionately benefit smaller companies.
This is the segment we’re watching most closely for leadership and we see as the strongest place for long exposure.
The back office, built for founders

We’ve worked with over 800 startups—from first-time founders at pre-seed to fast-moving teams raising Series A and beyond—and we’d love to help you navigate whatever’s next.
Here’s how we’re willing to help you:
Incorporating a new startup? We’ll take care of it—no legal fees, no delays.
Spending at scale? You’ll earn 3% cash back on every dollar spent with our cards.
Transferring $250K+? We’ll add $2,000 directly to your account.
FOCUSED STOCK
ASM: Precious Metals Leading
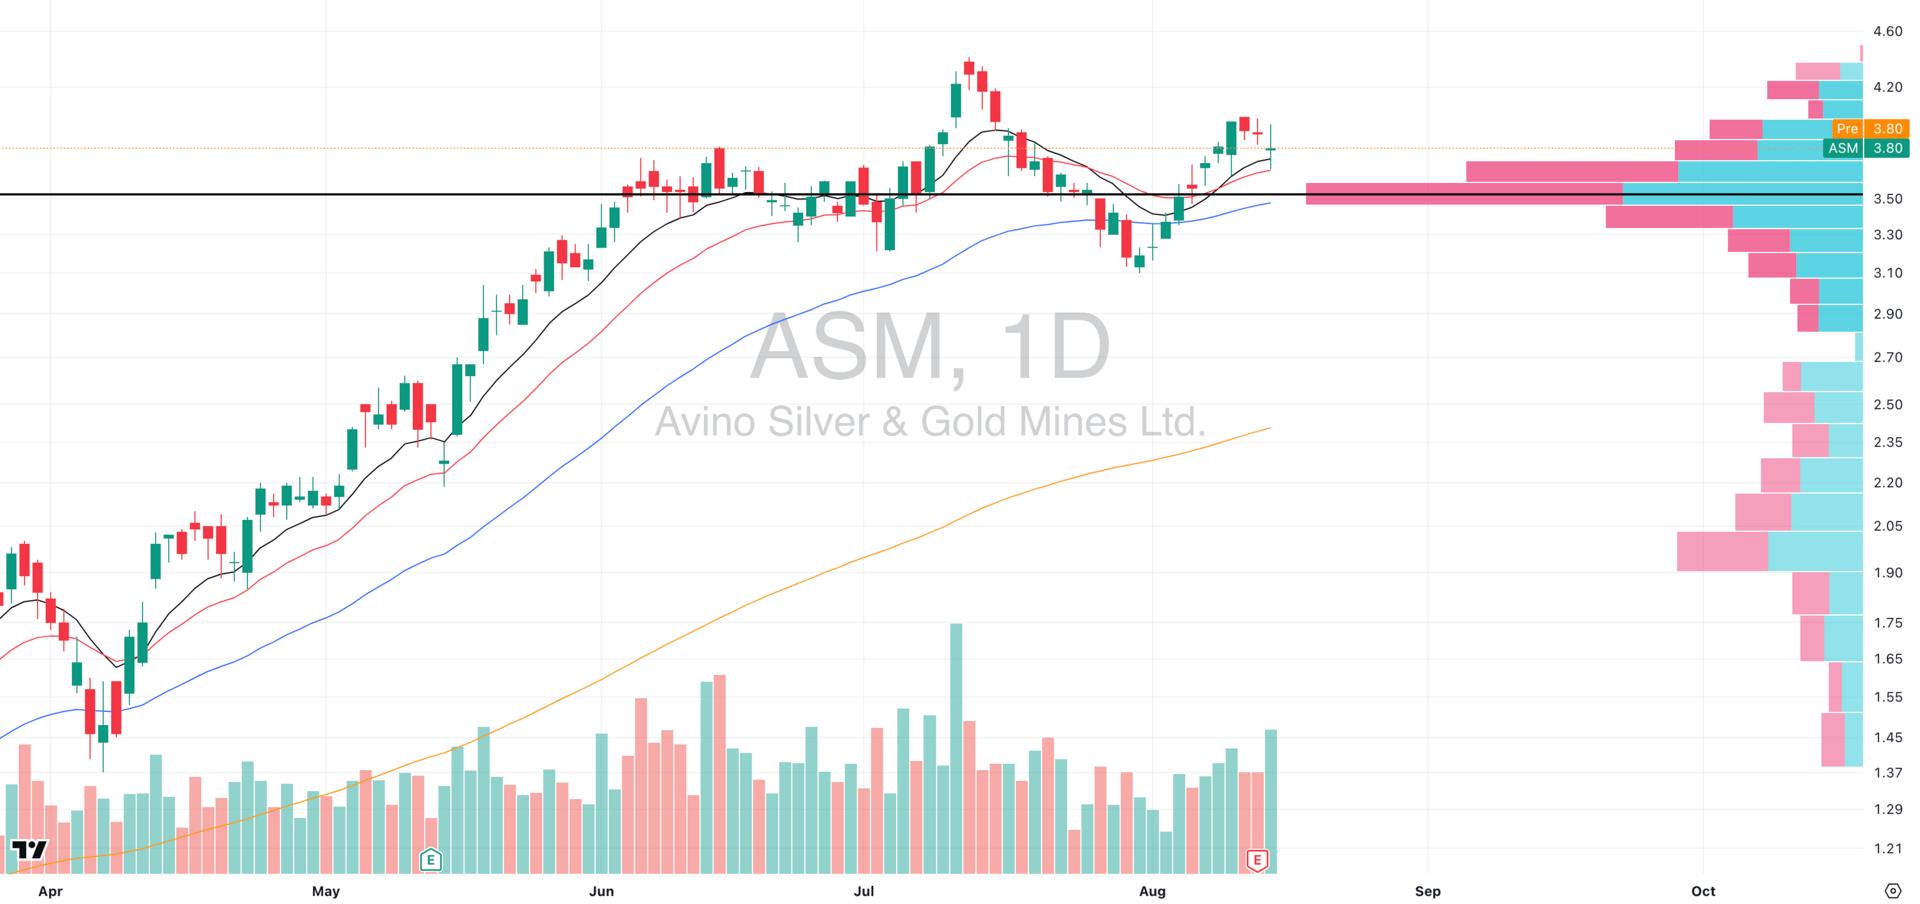
ASM VRVP Daily Chart
ADR%: 5.74% | Off 52-week high: -13.8% | Above 52-week low: +346.5%
ASM is part of one of the market’s highest-probability trend-following groups this quarter. After a strong multi-week rally, price is pulling back into the rising 10-EMA and 20-EMA cluster — both aligning with the $3.80 zone.
This level is key: during June–July 2025, $3.80 repeatedly acted as overhead resistance. A successful retest here would confirm a shift in behaviour (prior resistance → new support) and put ASM back in play for a continuation leg higher.
For now, the trade is simple:
If $3.80 holds on volume → high-quality pullback entry with trend alignment.
If $3.80 breaks on volume → stand aside and wait for base rebuild.
We’ve had this group on our radar for weeks in Swingly PRO, with members already capitalising on earlier trend entries.
FOCUSED GROUP
XPH: Pharma Leading The Pack
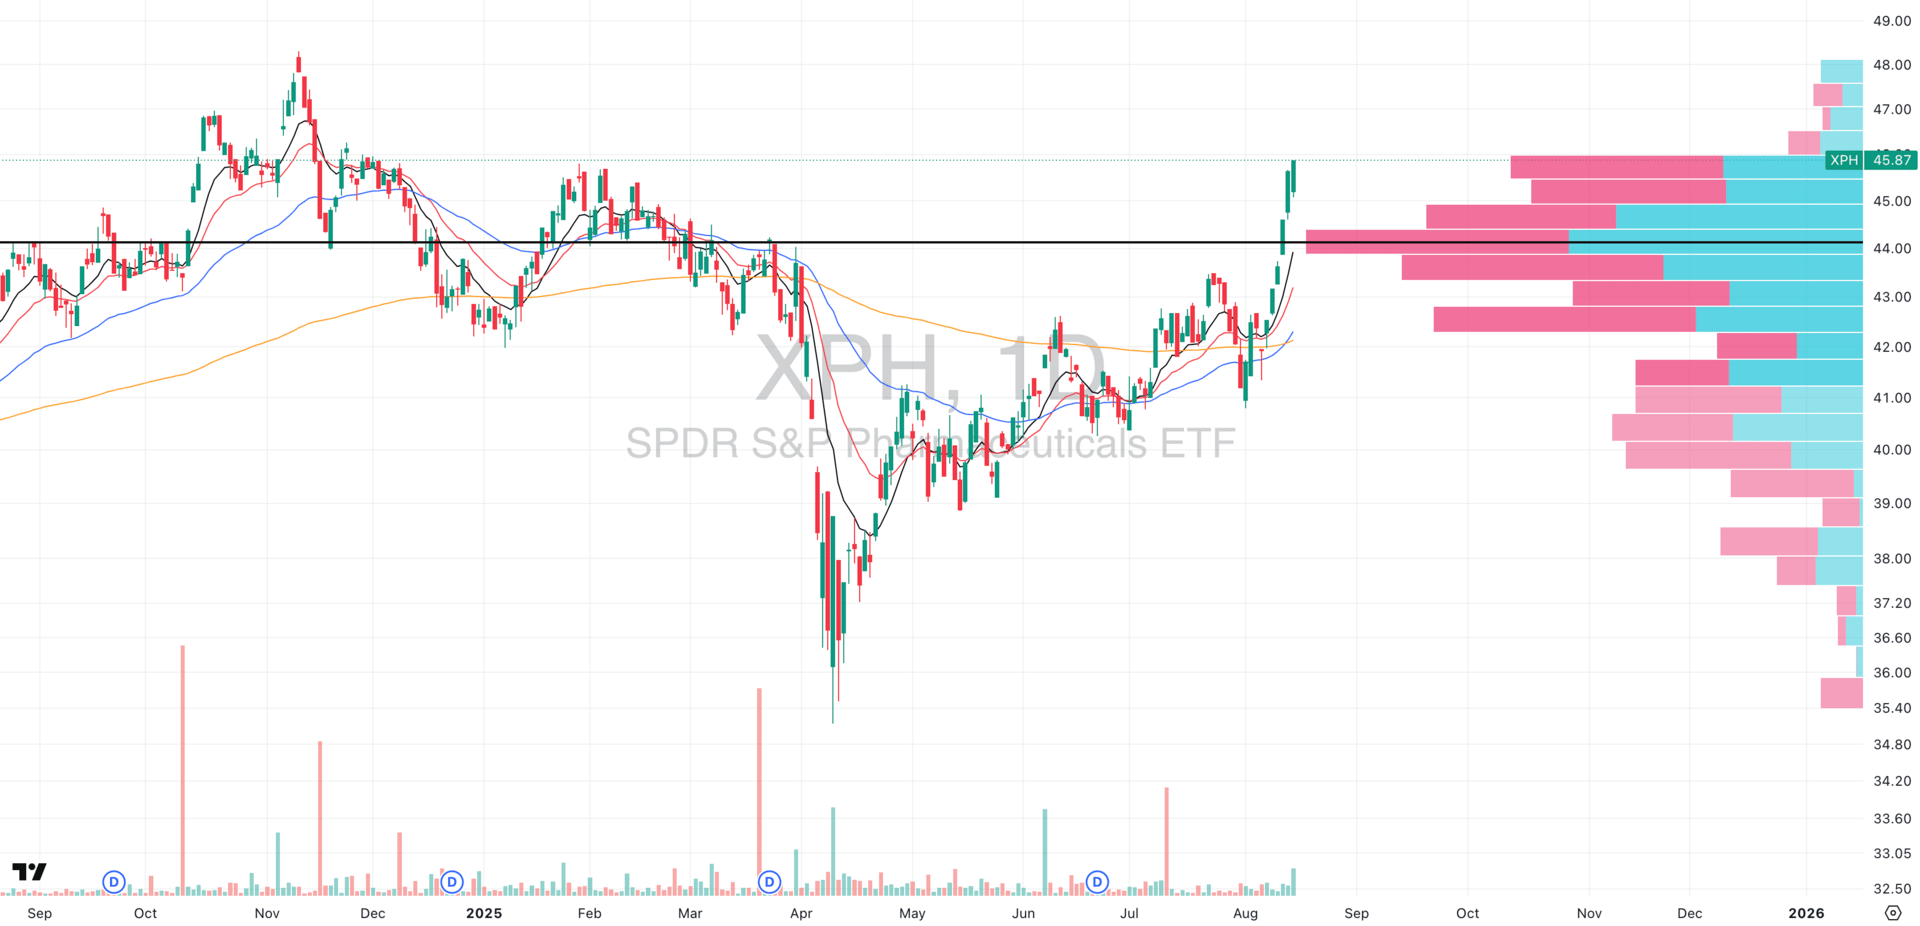
XPH VRVP Daily Chart
The pharmaceutical industry ETF (XPH) has exploded +9% in just the past five sessions — a massive move, especially given it coincides with a decisive breakout above seven months of tightly compressed price action.
Our daily momentum scans have been dominated by aggressive breakouts from XPH constituents, signaling sustained institutional interest across the group.
That said, the short-term picture shows price going near-parabolic. While leadership remains intact, new long entries here face elevated mean-reversion risk. The optimal play is either:
Managing existing positions tightly to protect gains, or
Waiting for a controlled pullback into prior breakout levels before initiating fresh exposure.
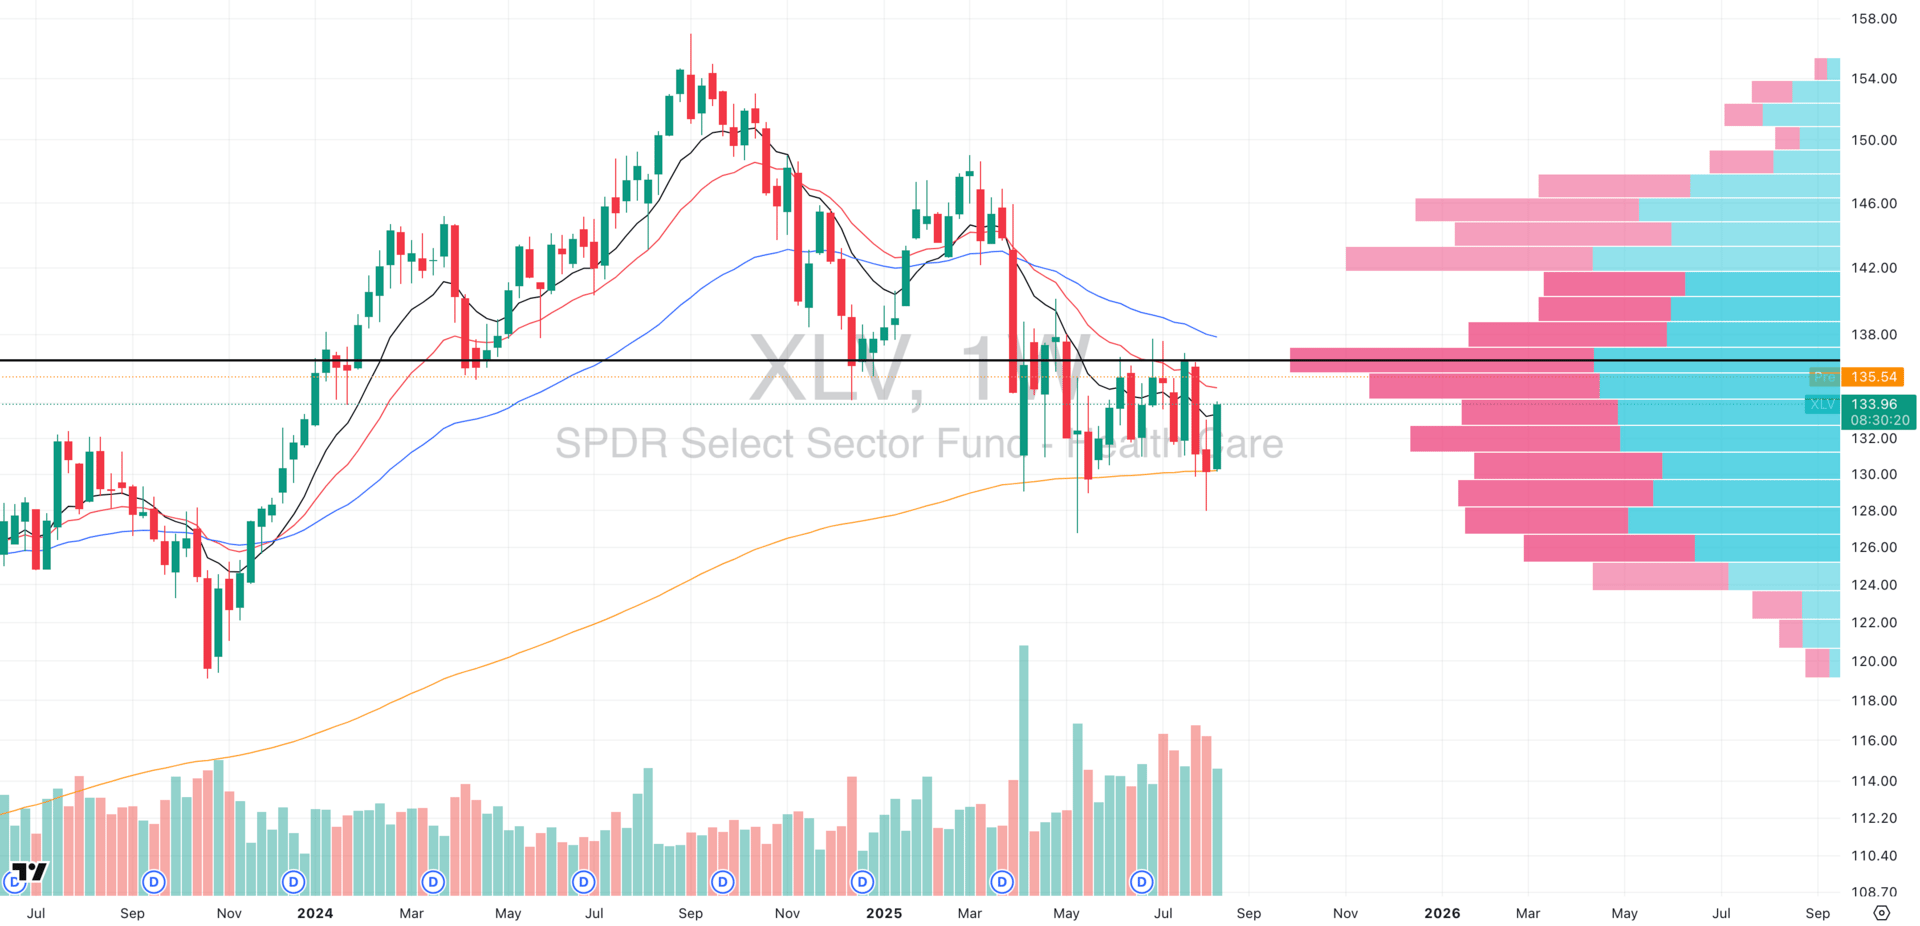
XLV VRVP Weekly Chart
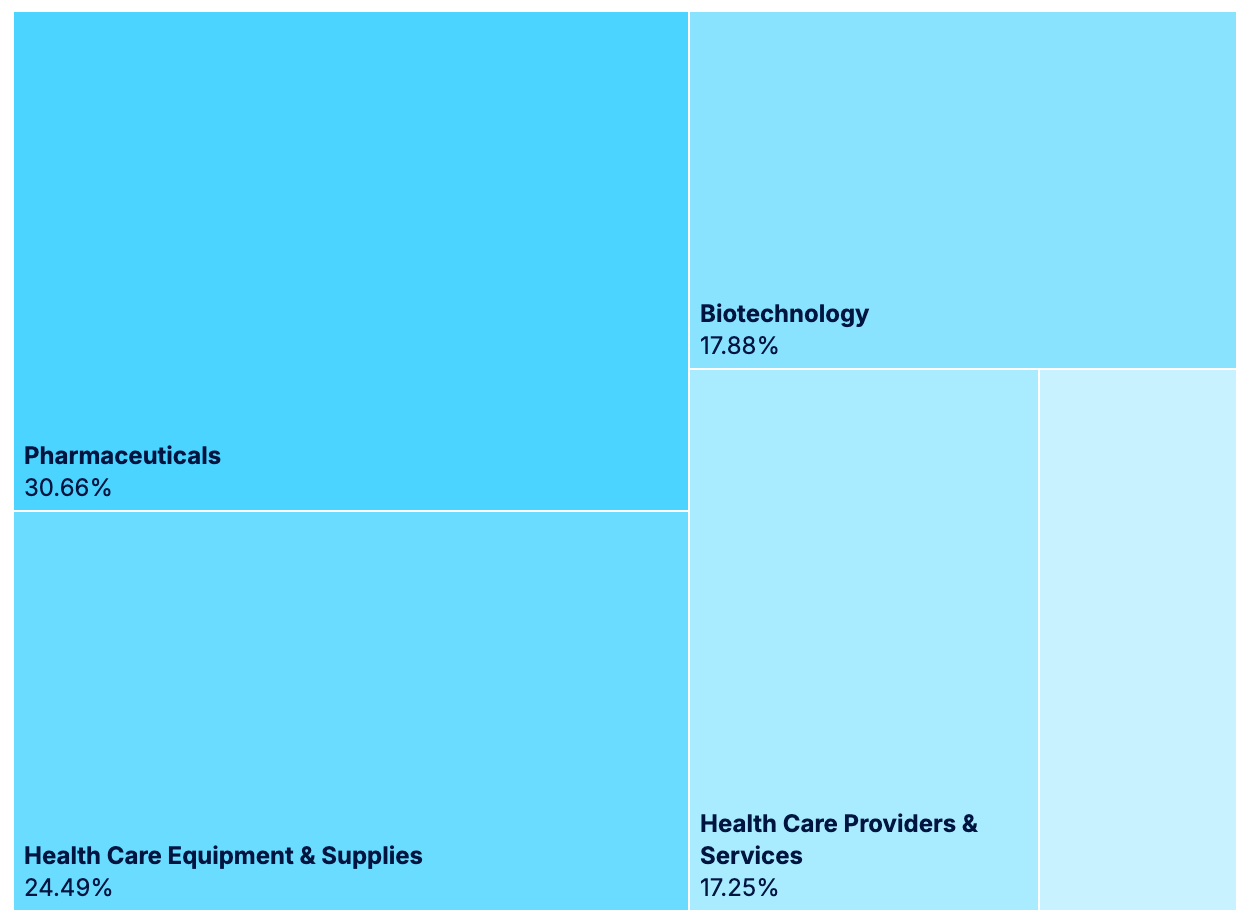
XLV Fund Allocation (source: State Street)
Zooming out, the broader Healthcare sector (XLV) — of which XPH accounts for nearly one-third of total weighting — is showing signs of a structural bottom.
XLV is attempting to base on its rising 200-week EMA and, as of this morning, is gapping above both its daily 10-EMA and 20-EMA. Notably, the 20-week EMA hasn’t held for several months, so reclaiming it would mark a significant shift in trend character.
The combination of a major sector attempting to base and its highest-beta component exploding higher gives us a powerful two-layer leadership read.

Q&A
Got a trading question? Hit reply and ask!
Q: “How much do you risk on a trade and why? Did just you randomly pick these levels or…?”
Our default risk per trade sits between 0.20% and 0.50% of portfolio equity. For a $100,000 account, that’s $200–$500 maximum loss per trade.
That’s the easy number. But sizing isn’t “set and forget” — it’s a precision dial, tuned to your system, the market regime, and volatility.
1️⃣ Risk is a function of expectancy, not opinion
The correct risk size is mathematically anchored to your system’s expectancy:
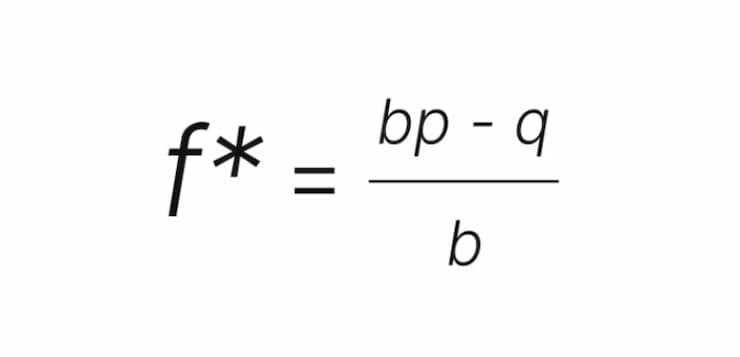
Where:
p = probability of winning
q= 1−p
b = average R-multiple of a winner
For example:
System: 50% win rate, average winner +2.0R, average loser -1R
Kelly suggests: 0.50 × equity at full aggression.
Typically you’ll find traders scale to ½ Kelly or less for drawdown control → 0.20–0.50% per trade becomes optimal.
2️⃣ Market regime changes the dial
Risk is dynamic because edge expression changes with conditions:
Breadth expansion / trending regime → risk toward the high end (0.45–0.50%).
Chop / range-bound regime → risk dialed back (0.20–0.30%).
High-volatility liquidation phase → Zero new risk until structure stabilizes.
The same system, in two different regimes, can produce wildly different PnL curves if risk isn’t adjusted.
3️⃣ Volatility adjusts position size
We also like normalize every trade’s dollar risk via ATR% (Average True Range as % of price):
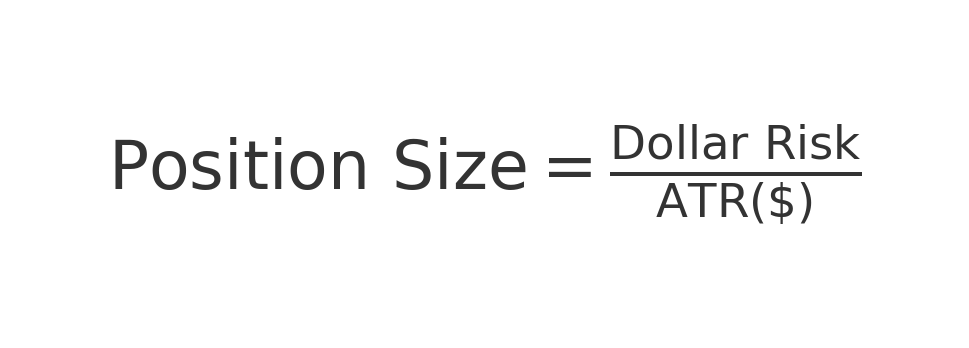
Example:
Risk budget = $500
ATR% = 4% on $50 stock → ATR($) = $2 → Size = 250 shares.
ATR% = 8% on $50 stock → ATR($) = $4 → Size = 125 shares.
This ensures that a high-ADR% name like QBTS doesn’t blow out your risk just because the chart looks “tight.”
4️⃣ Why this protects both growth & survival
Two core truths:
Over-sizing relative to your true edge mathematically guarantees ruin (negative expectancy via variance drag).
Under-sizing slows equity curve growth but dramatically reduces drawdown volatility, keeping you in the game long enough for your statistical edge to express itself.
Sizing must always be a balance between compounding rate and maximum tolerable drawdown. That balance shifts daily with volatility, breadth, and liquidity conditions.
In Swingly Pro, we talk about how to build these exact systems so no member has to guess. We all know exactly when the market is ours to attack, and when it’s time to step aside and raise cash
This is the power of trading alongside a team → see what’s included
Reply