- Swingly
- Posts
- The Story Behind Friday's Growth Bounce
The Story Behind Friday's Growth Bounce


MARKET ANALYSIS
Here’s What You Need To Know

U.S. equity futures are modestly lower to start the week as markets digest Friday’s sharp rebound and shift their focus toward a data-heavy week ahead.
After a volatile first week of February, price action is beginning to reflect hesitation rather than outright risk appetite, with investors clearly waiting for confirmation from macro before committing fresh capital.
Last Friday’s rally helped stabilize sentiment, but it did not fully reverse the damage done during the prior tech-led selloff, leaving the market in a transitional, headline-sensitive state.
The key macro focus now shifts to labor and inflation data, with the delayed January jobs report due midweek and CPI scheduled for Friday. This comes after last week’s ADP payrolls report printed far weaker than expected, reinforcing the idea that economic momentum may be slowing beneath the surface.
Markets are increasingly sensitive to this data not because growth is collapsing, but because positioning has become far less forgiving and any upside or downside surprise now has a much larger impact on rates expectations and equity multiples.
Importantly, last week’s rebound did not come with a full return of tech leadership. While software and growth names saw a relief bounce off key support, they remain structurally rangebound and well below recent highs.
That dynamic continues to support rotation rather than broad risk-on, with capital favoring value, cyclicals, and more defensively positioned areas of the market.
The Dow’s ability to push to new highs despite Nasdaq underperformance reinforces that point: this is not an index-level crash environment, but it is also not a momentum-driven growth market.
Outside the U.S., global markets remain mixed. Japan continues to exhibit strength following political clarity, while Europe has softened modestly, reflecting similar macro uncertainty.
Crypto’s sharp drawdown last week, followed by a violent rebound, further underscores the current regime: high volatility, fast positioning resets, and very little tolerance for crowded trades.
Nasdaq
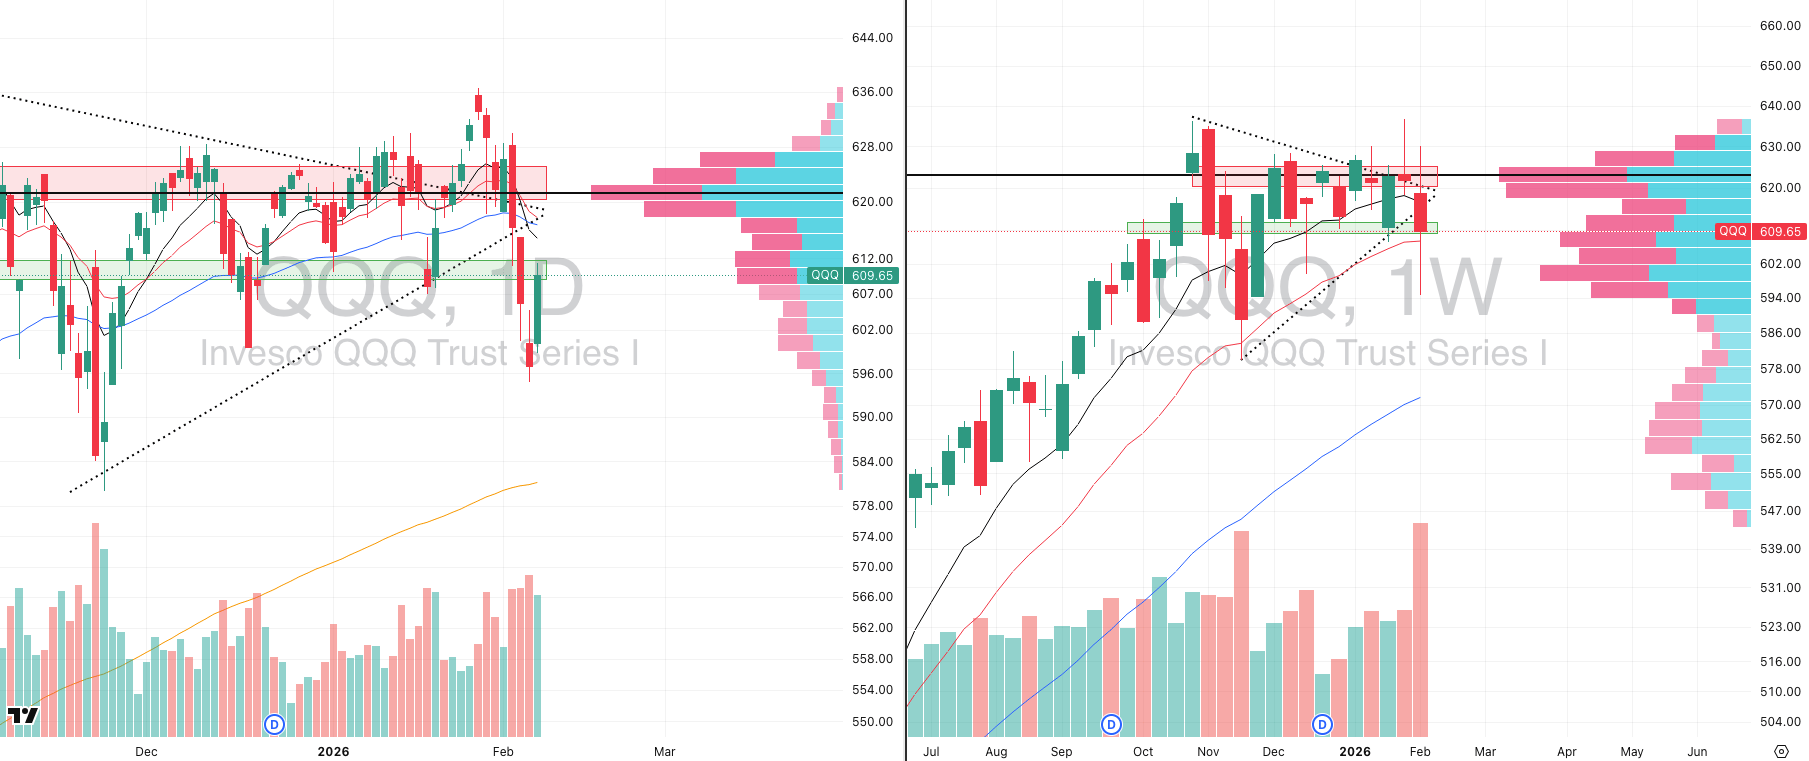
QQQ VRVP Daily & Weekly Chart

QQQ Monthly Chart
47.52%: over 20 EMA | 51.48%: over 50 EMA | 49.50%: over 200 EMA
The QQQ staged an impressive bounce on Friday, rallying on roughly 150% of its 20-day average volume, but the move remains a non-validated Morning Star reversal.
For the reversal to have been confirmed, price needed to close above Wednesday’s highs near 615.25, which did not occur, keeping the broader structure unresolved.
Selling pressure remains concentrated in large-cap growth, and the QQQ continues to be the weakest major index from a relative strength perspective.
On the weekly chart, price bounced from ~595 on ~181% relative volume, the highest weekly volume since March 2025, which marked the start of the prior bull cycle.
While the 595 level may appear arbitrary on daily charts, zooming out shows this decline approached the 10-month EMA near 590, a key primary-trend support.
The QQQ has now been contracting on the monthly chart for ~124 days, suggesting this is a positioning reset, not a confirmed structural breakdown.
Traders should be cautious pressing new shorts near the 10-month EMA, as this zone historically produces violent mean-reversion and whipsaw rather than clean trend continuation.
S&P 400 Midcap

MDY VRVP Daily & Weekly Chart
67.33%: over 20 EMA | 73.36%: over 50 EMA | 71.35%: over 200 EMA
Mid-caps delivered the strongest performance across all capitalizations, breaking out on Friday with a ~230% relative volume expansion, the highest since April 2025.
Friday’s candle expanded roughly 2.3%, nearly 2x the average daily range, confirming stage-two continuation, not exhaustion.
The weekly chart shows a textbook bounce off the 10-week EMA, followed by a large-range continuation candle with ~5% weekly range on elevated volume.
This remains the clearest leadership group in the market, confirming rotation rather than broad risk-off behavior.
The primary caveat is extension, with ~67% of mid-cap stocks above the 20 EMA and ~73% above the 50 EMA, levels where short-term mean reversion risk rises.
Given how difficult individual stock selection remains, ETF exposure continues to offer cleaner risk expression than single names.
Russell 2000

IWM VRVP Daily & Weekly Chart
56.75%: over 20 EMA | 61.40%: over 50 EMA | 65.80%: over 200 EMA
Small caps also pushed higher on Friday, confirming a valid Morning Star reversal by reclaiming and closing above Wednesday’s highs near 265.
Price continues to hold the 10-week EMA near 257, which was defended last week on ~160% relative volume.
While small caps are not as strong as mid-caps, they remain structurally healthy with a relative strength rating near 86 vs. SPX.
Breadth remains less extended than mid-caps, with only ~57% of stocks above the 20 EMA, suggesting more upside asymmetry remains available.
As with mid-caps, ETF exposure is preferred, as leadership remains broad but individual stock trends are still inconsistent.
FOCUSED STOCK
IAUX: Always Buy Gold Miners On Weakness

IAUX VRVP Daily & Weekly Chart
ADR%: 6.74% | Off 52-week high: -3.6% | Above 52-week low: +289.9%
Gold miners remain the cleanest and most consistent leadership group, with IAUX (i-80 Gold) standing out as a top relative strength name.
IAUX carries a 99 relative strength rating vs. SPX and is consolidating above its 10- and 200-week moving averages following a recent bullish crossover.
Volatility remains elevated with a ~6.7% average daily range, offering strong opportunity once pullbacks develop.
With gold no longer extended and entering consolidation, this is precisely the phase where miners should be accumulated, not chased.
Ideally, pullbacks toward the 10–20 day EMA, or even the 10-week EMA near 15.6, would offer optimal risk-reward entries.
This remains a new stage-two trend, and among all sectors, gold miners continue to offer the cleanest, most linear price action in the current market.

Did you find value in today's publication?This helps us better design our content for our readers |
Reply