- Swingly
- Posts
- The Steepest Breadth Rebound Since Summer: What Comes Next
The Steepest Breadth Rebound Since Summer: What Comes Next
In partnership with

OVERVIEW
What You Need To Know
OVERVIEW
Markets kicked off the week strong as optimism builds ahead of key earnings and the Fed meeting.
Sentiment is risk-on, but traders should stay disciplined — this week’s catalysts could shift tone quickly.
NASDAQ (QQQ)
Confirmed breakout through $647 with strong breadth and equal-weight confirmation via QQQE.
Avoid chasing gap-up opens — let early volatility settle before entering; plenty of trend potential remains.
S&P 400 MIDCAP (MDY)
Gapped higher but rejected near $608 on low relative volume, signaling lingering supply.
Breadth continues improving even as momentum lags Nasdaq — constructive, not yet leadership.
RUSSELL 2000 (IWM)
Gapped up and reversed near $250 on weak volume (72% of average), showing hesitation at highs.
Breadth expansion is clear (63% above 20-EMA), confirming risk appetite returning beneath the surface.
FOCUSED STOCK: GTLB (GitLab Inc.)
AI-driven DevSecOps platform in a 7-month Stage 1 base, now turning higher toward a $50 breakout zone.
Low overhead supply and strong structural base suggest potential Stage 2 transition with high volatility appeal.
FOCUSED SECTOR: XLY (Consumer Discretionary)
Coiling tightly below $240 POC with declining volume and a healthy bounce off rising EMAs — classic contraction setup.
On the weekly chart, XLY holding its 10- and 20-week EMAs; a breakout above $240 would enter pure price discovery.
This setup is particularly important as Consumer Defensive recently faded their breakout attempt and cyclicals reclaiming leadership would mark a key sentiment shift.”

MARKET ANALYSIS
Pre Earnings Euphoria: Markets Rally

Stocks kicked off the week on a positive note as optimism builds around a potential U.S.–China trade deal, expected to be finalized when Presidents Trump and Xi meet later this week. Officials on both sides described weekend talks as “constructive,” easing trade tensions that have weighed on markets for months.
Investors are also bracing for a high-impact week featuring the Federal Reserve’s rate decision and a flood of Big Tech earnings. The Fed is widely expected to deliver another rate cut on Wednesday after softer inflation data last week strengthened the case for easing.
On the earnings front, Microsoft, Alphabet, and Meta report midweek, followed by Apple and Amazon, marking the most important stretch of the season as investors assess whether AI-driven growth can sustain recent momentum.
Gold extended its pullback, falling over 2% as progress on trade talks reduced demand for safe-haven assets and investors took profits after an overbought rally.
Nasdaq
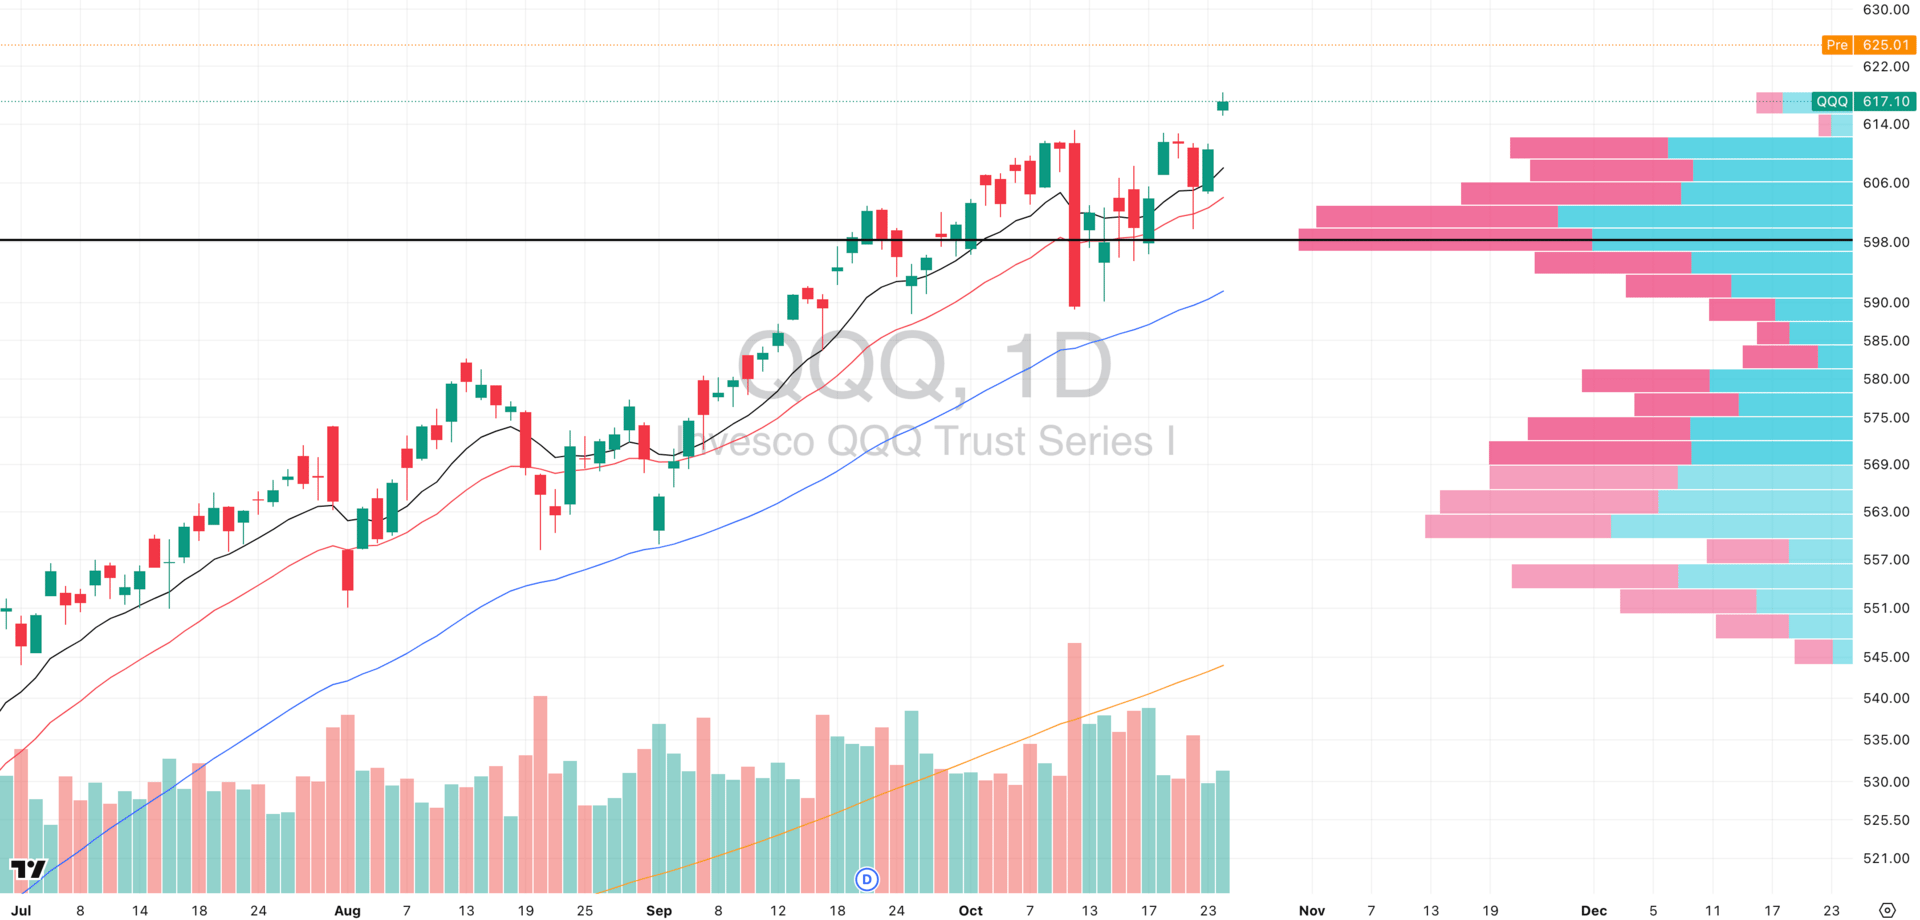
QQQ VRVP Daily Chart
% over 20 EMA: 67.32% | % over 50 EMA: 63.36% | % over 200 EMA: 61.38%
Breakout Confirmation: Friday’s move through the $647 zone on QQQ decisively invalidated the Eve & Eve double-top structure, confirming a clean breakout above short-term resistance. This was also the tale end of a very dense supply shelf visible on the visible range volume profile (VRVP).
Market Breadth Expansion: The breakout came with very strong internal participation, marking one of the first true breadth-driven surges in months.

QQQE VRVP Daily Chart
Equal-Weight Confirmation: The QQQE (Equal-Weight Nasdaq 100) rallied in tandem, a critical sign that underlying participation is broadening out within the Nasdaq which in itself basically drives the entire equities market.
Rewarding Pullback Entries: Traders who built pullback entries last week are being well-rewarded, with price rotation and follow-through confirming structural strength.
Caution Ahead of Earnings: With the Magnificent Seven reporting this week, we’d remain cautious adding fresh naked longs into strength into these names before such massive events. Volatility risk is elevated, and much of the short-term optimism may already be priced in.
Breakout Trader Note: For breakout traders, be wary of gap-up opens. Consider waiting the first 15–30 minutes to let early volatility settle and gain clarity. If this truly marks the start of a trend expansion, there will be plenty of opportunity to scale in with confirmation.
S&P 400 Midcap

MDY VRVP Daily Chart
% over 20 EMA: 56.10% | % over 50 EMA: 46.13% | % over 200 EMA: 58.85%
Gap-Up Open, Immediate Rejection: MDY opened with a gap higher on Friday, but the move was quickly faded near the $608 highs, signaling that midcaps are still facing overhead supply pressure.
Relative Weakness vs Nasdaq: Compared to QQQ and QQQE, MDY showed less follow-through, reflecting weaker momentum in mid-cap leadership. The index remains range-bound despite Friday’s strength- this is not bearish in itself, it just lets us know the midcaps are a laggard.
Volume Divergence: The breakout attempt occurred on notably low relative volume, in contrast to the late-August breakout, which carried much stronger participation. This makes Friday’s move less convincing technically, but context matters as individual stock scans do show a healthy list of strong looking setups in the midcap complex.
Breadth Still Constructive: Despite muted volume, breadth has materially improved, with more midcap names reclaiming key moving averages which is a necessary foundation for any sustained upside move.
Market Behavior: The lack of volume expansion tells us demand isn’t fully confirmed yet, but buyers are stepping in at higher lows. That’s consistent with early-stage risk appetite returning beneath the surface.
Russell 2000
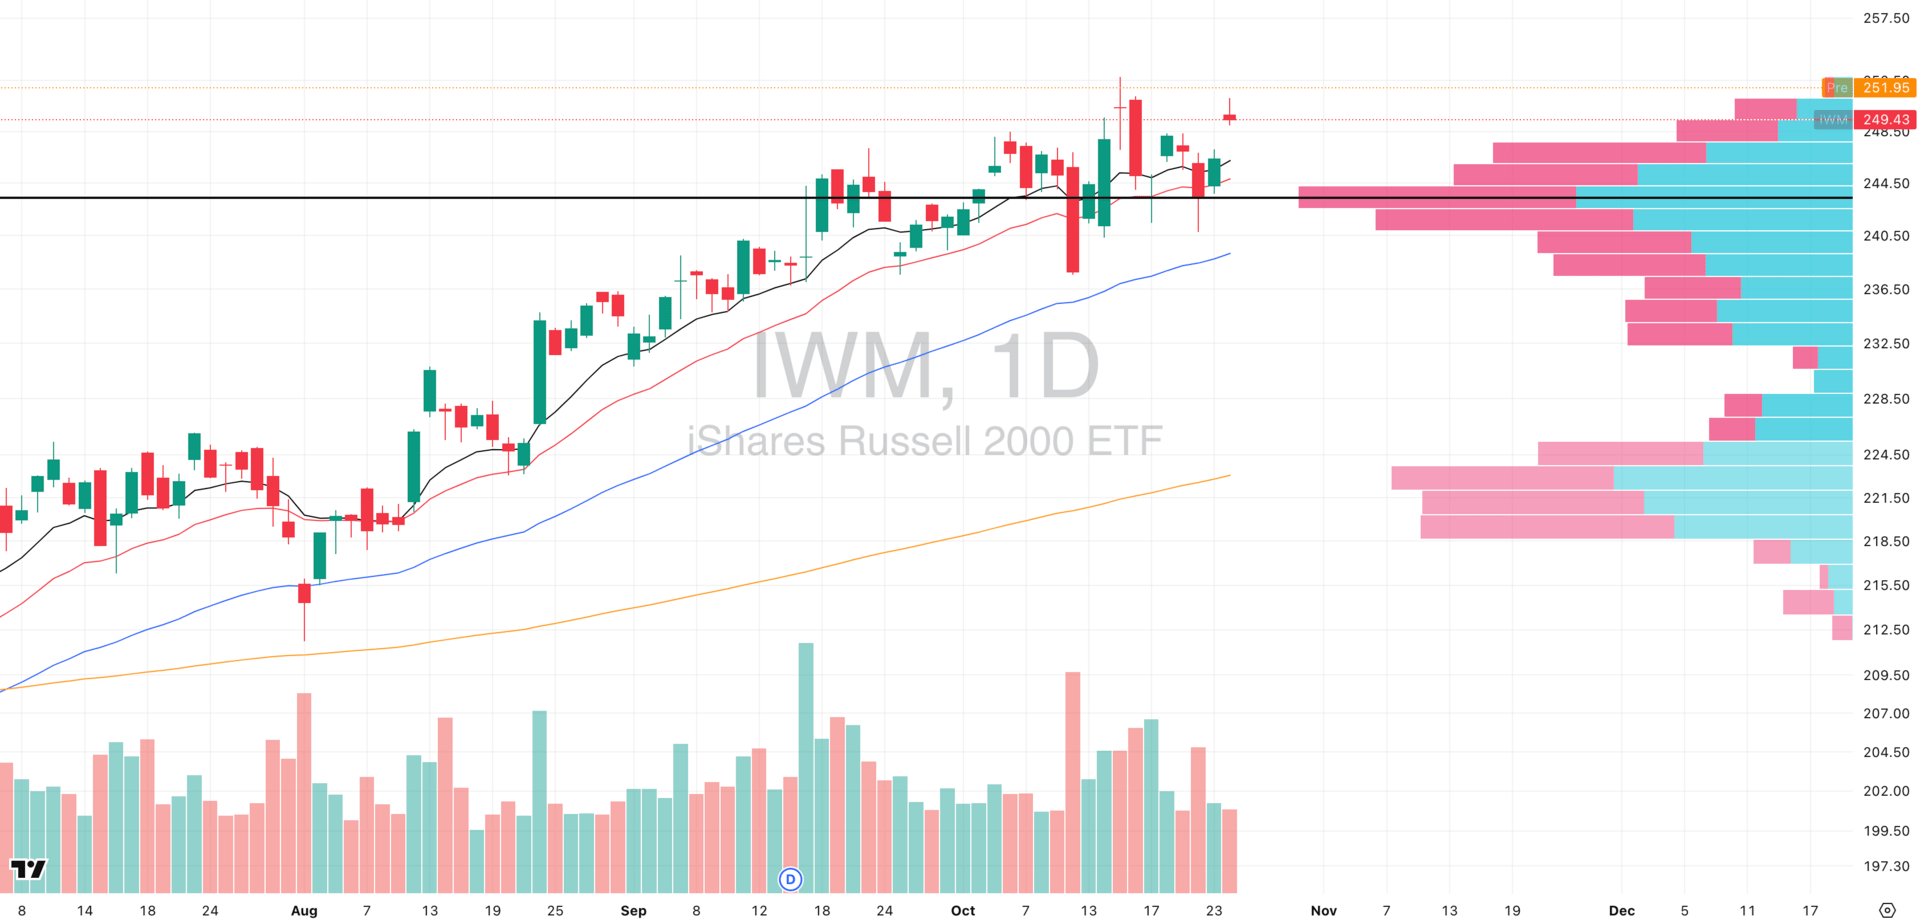
IWM VRVP Daily Chart
% over 20 EMA: 62.87% | % over 50 EMA: 53.72% | % over 200 EMA: 60.72%
Gap-Up Open, Quick Reversal: IWM gapped higher on Friday but was rejected near the $250 zone, fading through the session and closing back within range — a sign of hesitation at resistance.
Volume Weakness: The move came on just 72% of the 20-day average relative volume, suggesting weak underlying conviction behind the push. That’s a yellow flag for breakout reliability.
Breadth Improvement: Still, internal strength has expanded materially, with 63% of Russell 2000 components now above their 20-EMA. That’s a major improvement from early October levels and confirms speculative appetite returning.
Market Context: This broadening participation across small caps reflects a healthy underlying market tone, but given the volume backdrop, it’s not yet leadership strength, but it’s confirmation that the rally’s base is widening.
Risk Management Note: Like the other indices, we’d be cautious chasing gap-up opens this morning. Let the first 15–30 minutes settle before engaging as this clarity matters more than immediacy when breadth expands this quickly.
Focus Area: Our primary focus remains on large- and mega-cap tech, where relative strength and earnings catalysts remain strongest. Small caps are confirming risk appetite but are not leading it (yet).
Institutional-Grade Opportunities for HNW Investors

Long Angle is a private, vetted community connecting high-net-worth entrepreneurs and executives with institutional-grade alternative investments. No membership fees.
Access top-tier opportunities across private equity, credit, search funds, litigation finance, energy, hedge funds, and secondaries. Leverage collective expertise and scale for better terms.
Invest alongside pensions, endowments, and family offices. With $100M+ invested annually, secure preferential terms unavailable to individual investors.
FOCUSED STOCK
GTLB: Stage 1 → Stage 2 Transition Breakout

GTLB VRVP Daily Chart
ADR%: 5.55% | Off 52-week high: -34.6% | Above 52-week low: +28.1%
Who They Are: GitLab Inc. ($GTLB) is a DevSecOps platform that enables developers to collaborate, secure, and automate software delivery within a single integrated workflow.
In the era of AI-assisted coding, GitLab has become a critical infrastructure layer as it works by integrating AI tools directly into the software development lifecycle, from code generation to deployment. This positions GTLB as a key enabler in the AI productivity revolution unfolding across the tech ecosystem.

Technical Structure (Stan Weinstein Lens): From a Stage 1 accumulation standpoint, GTLB has been basing since March 2025, forming a broad multi-month bottoming structure with tightening volatility and repeated accumulation along the lows.
Point of Control (POC): Reclaimed the pivotal $44.50 zone, confirming demand absorption.
Breakout Zone: The next key level sits at $50, where the Visible Range Volume Profile (VRVP) shows very limited overhead supply, clearing the path for a potential Stage 2 breakout.
Base Duration: Roughly 7 months of accumulation, a healthy consolidation window for institutions to build positions.
FOCUSED GROUP
XLY: Cyclicals Are Back
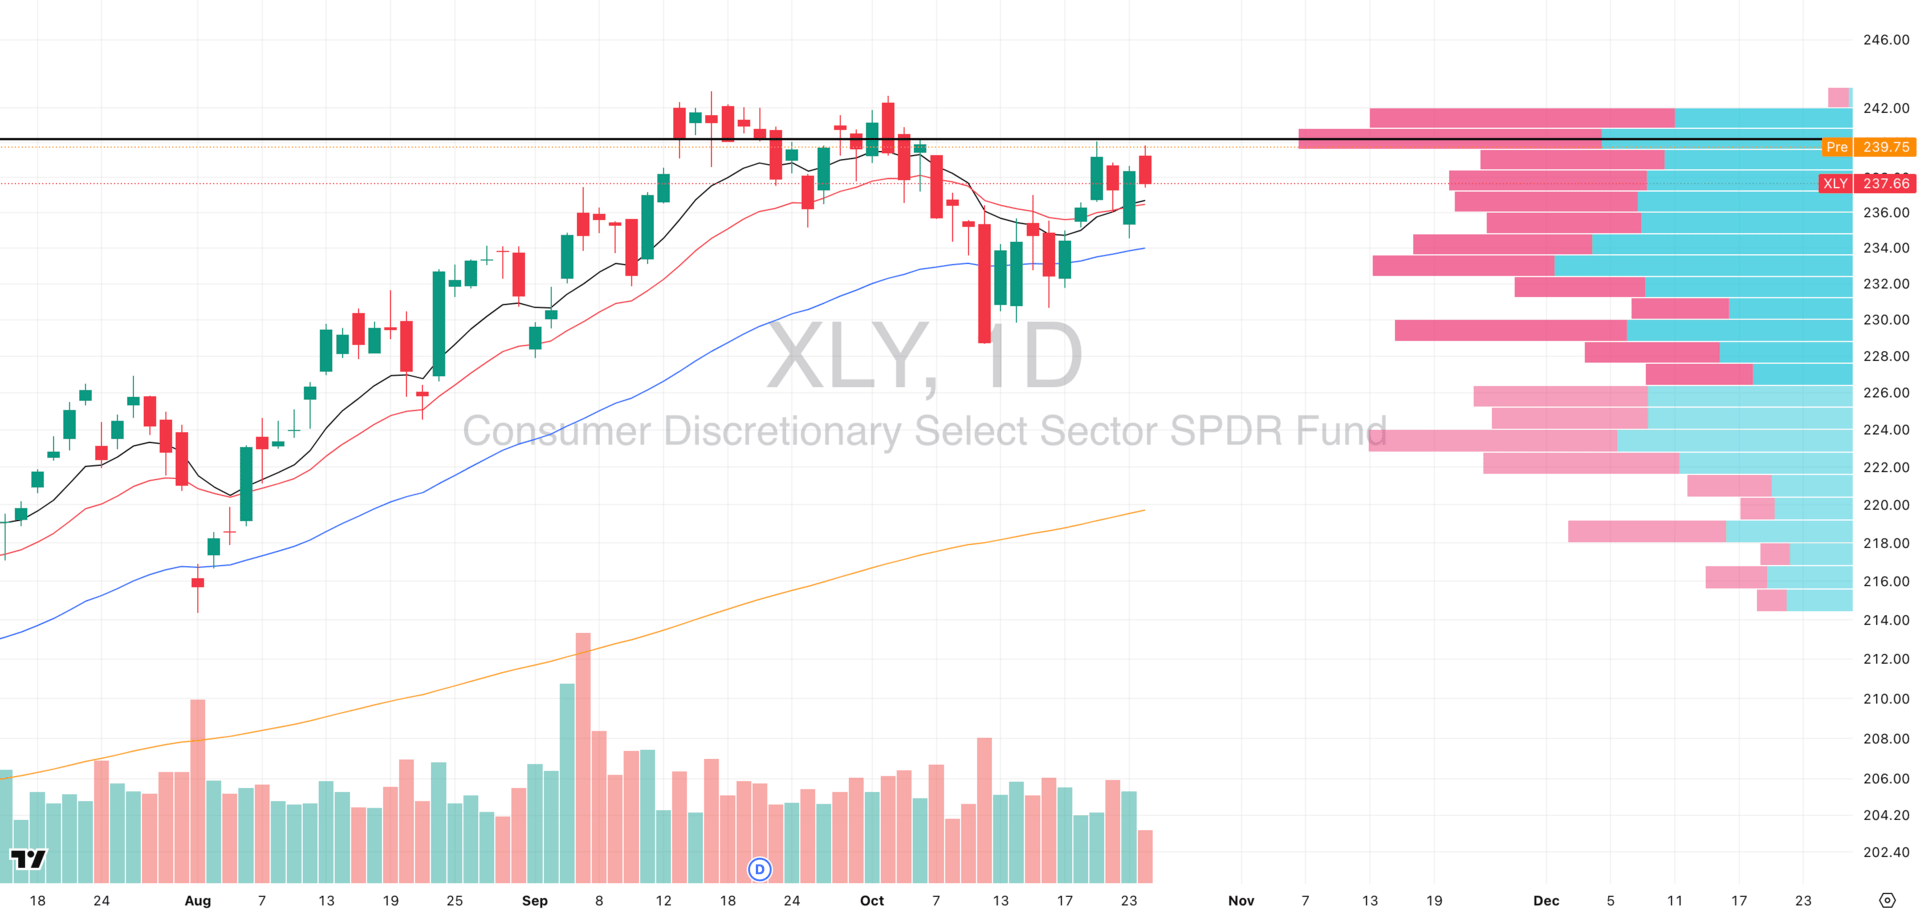
XLY VRVP Daily Chart

XLY VRVP Weekly Chart
Daily Structure: XLY continues to coil tightly just beneath its Point of Control (POC) around $240, showing clear contraction in both range and volume. The sector has seen a healthy rebound off the rising 10-, 20-, and 50-day EMAs over the past week and is signaling a very healthy and constructive technical alignment.
Volume & Compression Context: The declining volume accompanying this compression suggests energy build-up rather than exhaustion. XLY is sitting at a technical inflection where a resolution higher could trigger volatility expansion.
Weekly Context: On the weekly timeframe, XLY continues to hold its 10- and 20-week EMAs, maintaining its broader intermediate-term uptrend. Importantly, this current consolidation mirrors the November 2024 structure, when XLY peaked near the same $240 zone - marking prior all-time highs.

Did you find value in today's publication?This helps us better design our content for our readers |
Reply