- Swingly
- Posts
- The Semiconductor Stock To Bet Big On
The Semiconductor Stock To Bet Big On


MARKET ANALYSIS
Here’s What You Need To Know

Markets showed a surprising amount of resilience and strength this week, with equities rebounding despite elevated geopolitical noise and macro uncertainty.
The relief rally was driven by de-escalation headlines, but the magnitude of the bounce relative to recent volatility was notable.
Futures pulling back modestly after two strong sessions aligns with the choppy, mean-reverting structure we are seeing across indices rather than a clean trend regime.
Tech sentiment was pressured by Intel’s weak guidance, highlighting that AI and megacap leadership remains selective, not broad-based even though we have seen a lot og strength in the semiconductor space. The rally is still being carried by a narrow subset of names even in the leading groups.
Flow data showed capital rotating out of U.S. equities during the tariff escalation, with inflows into Europe and Japan. This supports a rotation and diversification narrative, not a wholesale risk-off liquidation.
Oil firming on renewed Middle East risk introduces upside inflation tail risk, which the equity market is currently treating as secondary.
Near-term macro data (PMIs) is unlikely to shift rate expectations ahead of the Fed meeting, meaning geopolitics and flows remain the dominant drivers, not monetary policy.
We expect to see some chop today though we are impressed with the last few sessions of price action all things considered with demand showing up.
Nasdaq
QQQ VRVP Daily & Weekly Chart
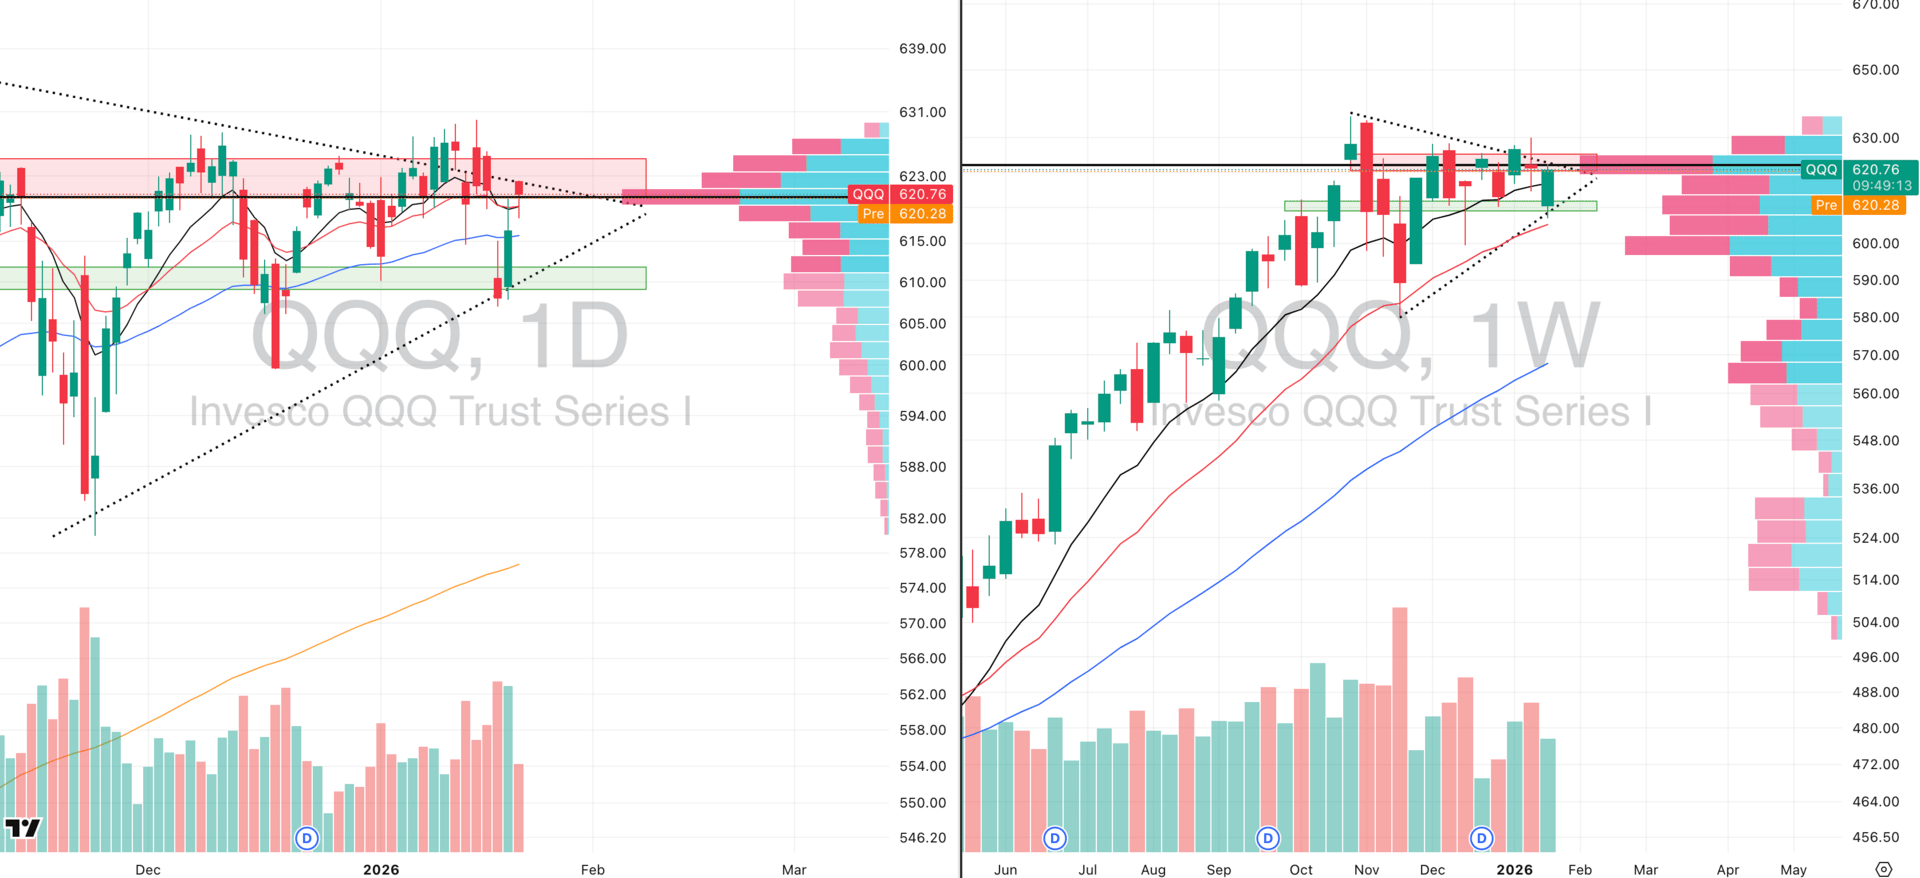
51.96%: over 20 EMA | 55.88%: over 50 EMA | 58.82%: over 200 EMA
Starting with the NASDAQ via QQQ, yesterday was a notably low-volume session, with volume at 77% of the 20-day average. That is roughly half the relative volume seen on Tuesday and Wednesday and marks the lowest volume since January 12th.
Price initially pushed lower and briefly undercut the reclaimed 10- and 20-day moving averages, but ultimately reversed higher, printing a red hammer candle that found support at the point of control around 620.
Overhead supply remains dense up to roughly 629, aligned with the January 15th reversal zone. This represents approximately 1.19% of overhead supply, and we are not expecting that zone to be cleared in a single impulsive move.
The key structural level is the 50-day EMA at 615.56, which has now been reclaimed. Historically, the NASDAQ tends to chop above the 50-day EMA during uptrends, and this level also aligns with last week’s lows.
On the weekly chart, the recent sell-off into January 20th–21st found support precisely at the rising 20-week EMA. From an intermediate perspective, the NASDAQ is finding demand where it should.
Relative volume has been cooling since the November 17th peak as price consolidates, consistent with a volatility contraction pattern on the intermediate trend.
The primary issue for traders is regime mismatch: attempting to trend trade in a range environment, rather than adapting to mean-reversion and rotational behavior.
S&P 400 Midcap
MDY VRVP Daily & Weekly Chart
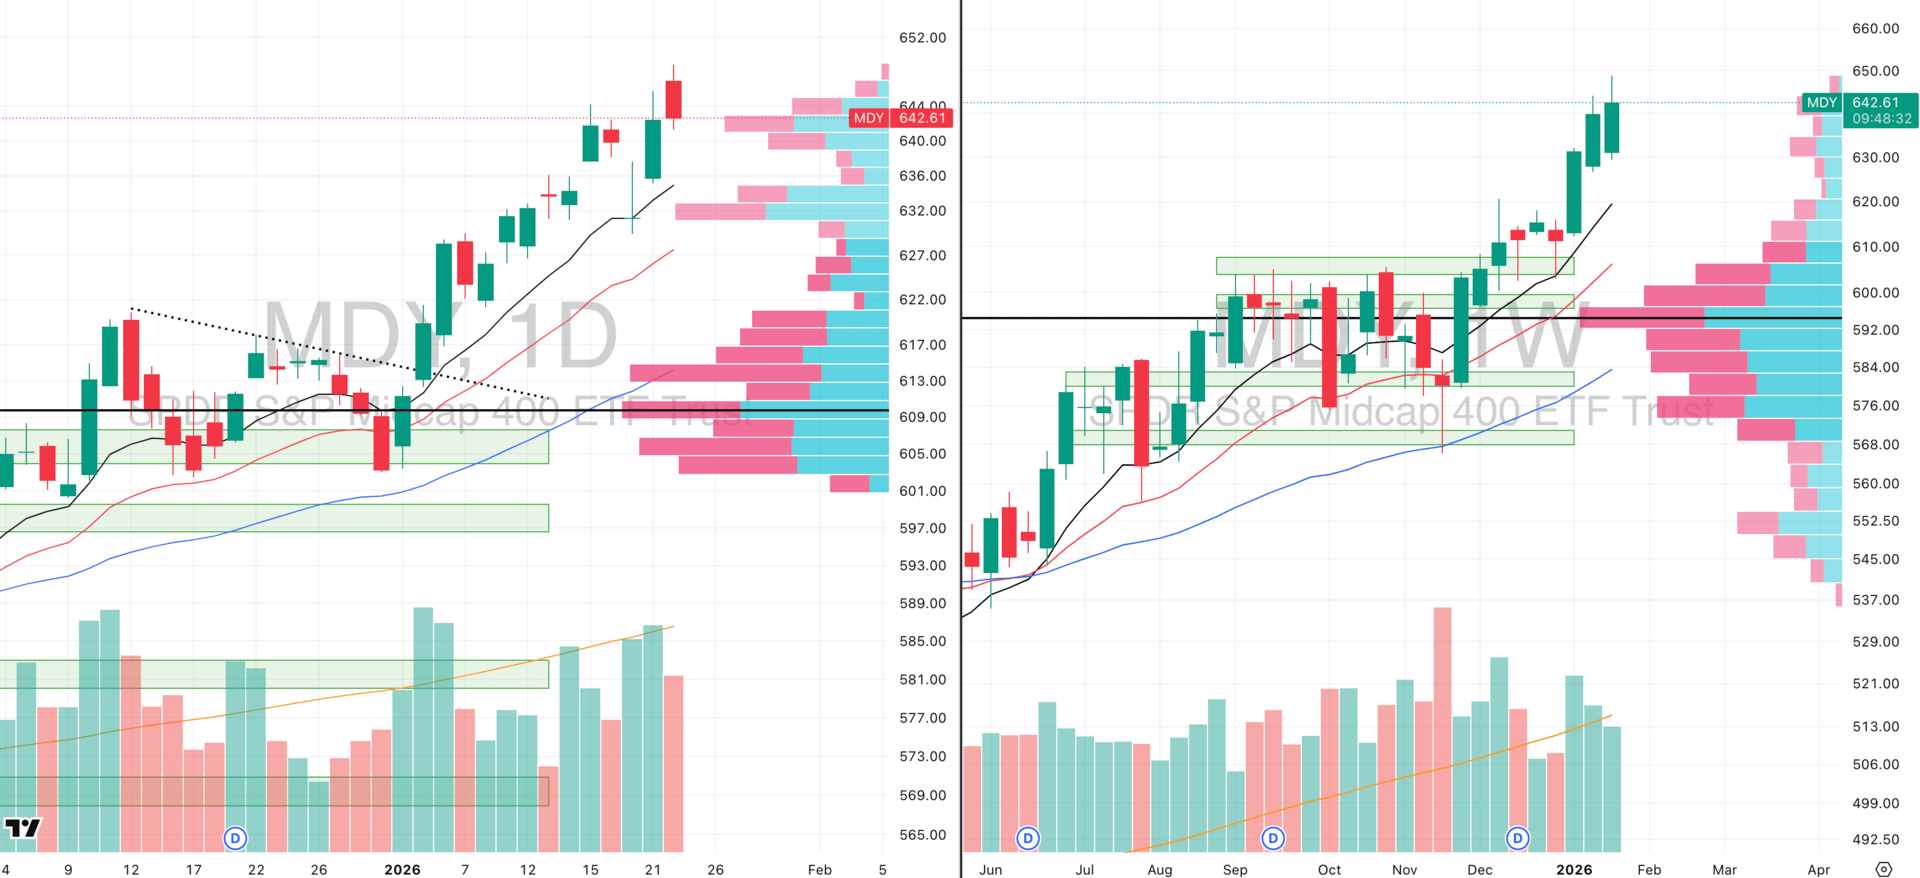
72.11%: over 20 EMA | 75.37%: over 50 EMA | 69.34%: over 200 EMA
Mid-caps experienced a modest mean reversion session, with 108% relative volume following a roughly 0.7% gap higher attempt. Price faded from the highs, and profit-taking was evident.
At 645, approximately 210,000 shares traded red versus 127,000 shares traded green, with even heavier selling above 646, where 33,000 shares traded red versus 10,000 green.
This confirms meaningful supply and profit-taking near recent highs. Mid-caps remain leaders on a relative basis but are extended, and historically they do not move in a straight line for more than two to three weeks without a consolidation phase.
Russell 2000
IWM VRVP Daily & Weekly Chart
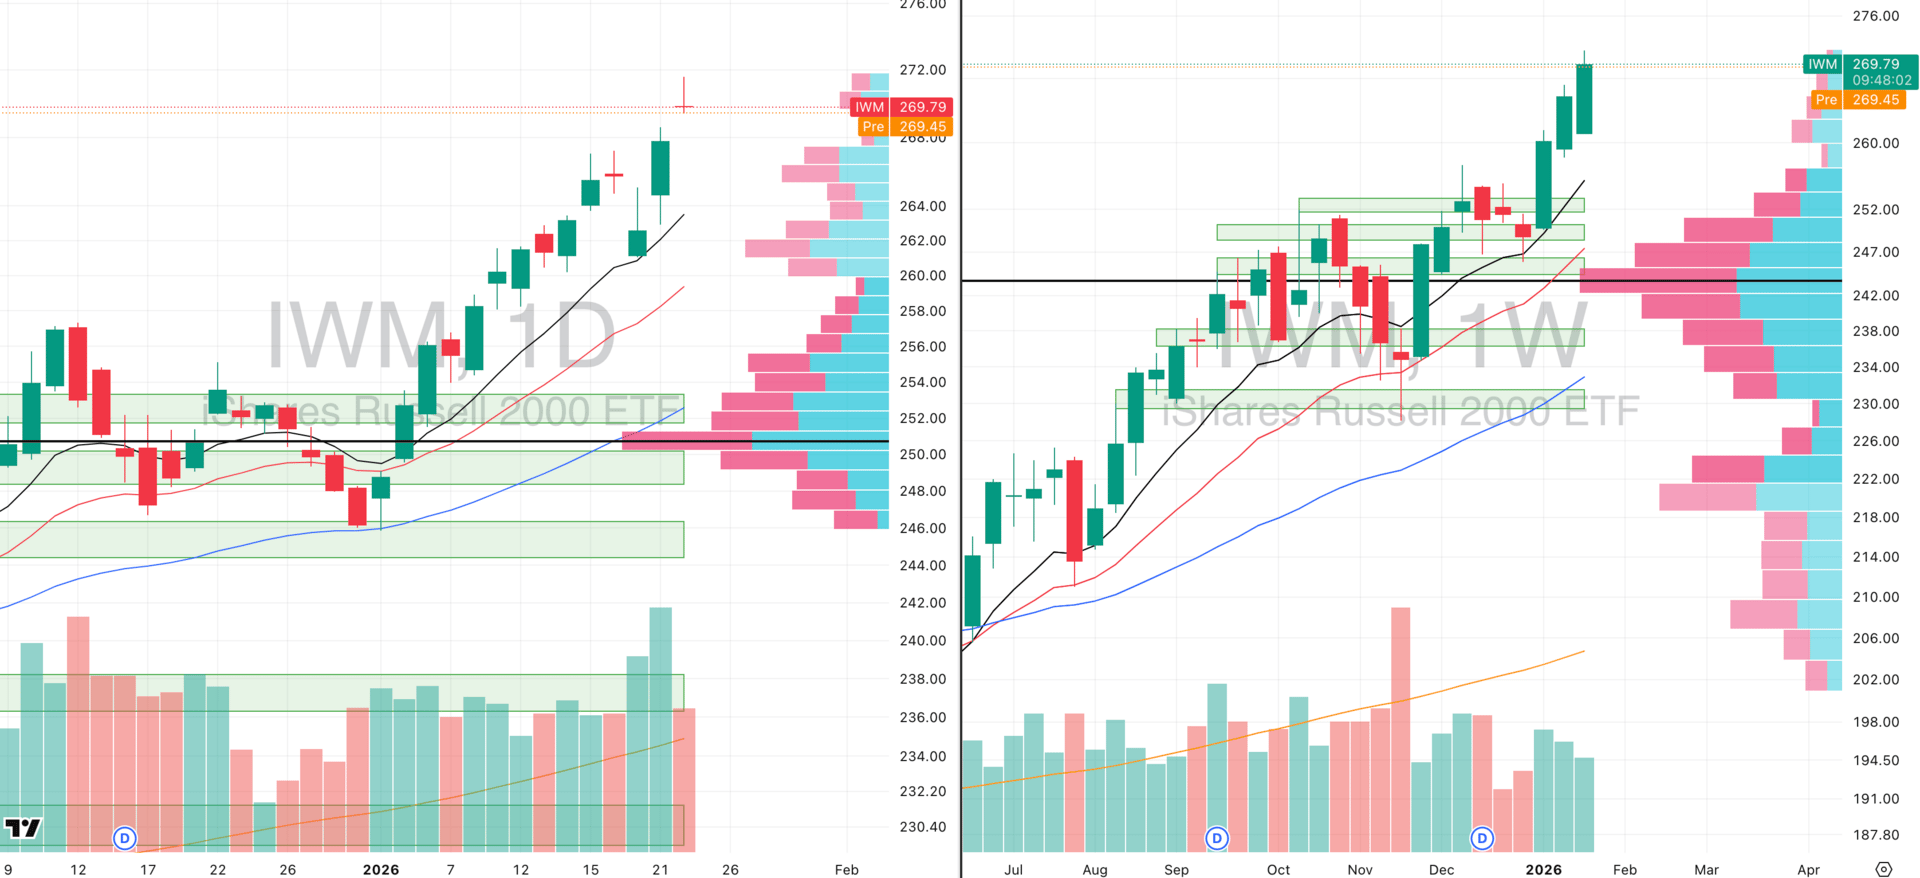
74.30%: over 20 EMA | 73.89%: over 50 EMA | 70.07%: over 200 EMA
Small-caps continue to accelerate relative to mid-caps, but yesterday printed a gravestone doji, which we are treating as an exhaustion candle.
IWM is currently extended at roughly 5.77 ATR multiples above the 50-day moving average. Anything above 5 ATR multiples tends to become unstable, and we expect near-term consolidation or pullback.
This should not be interpreted as a crash scenario, but rather as a normalization of extension
FOCUSED STOCK
OUST: Small Cap Semiconductors Pushing
OUST VRVP Daily & Weekly Chart
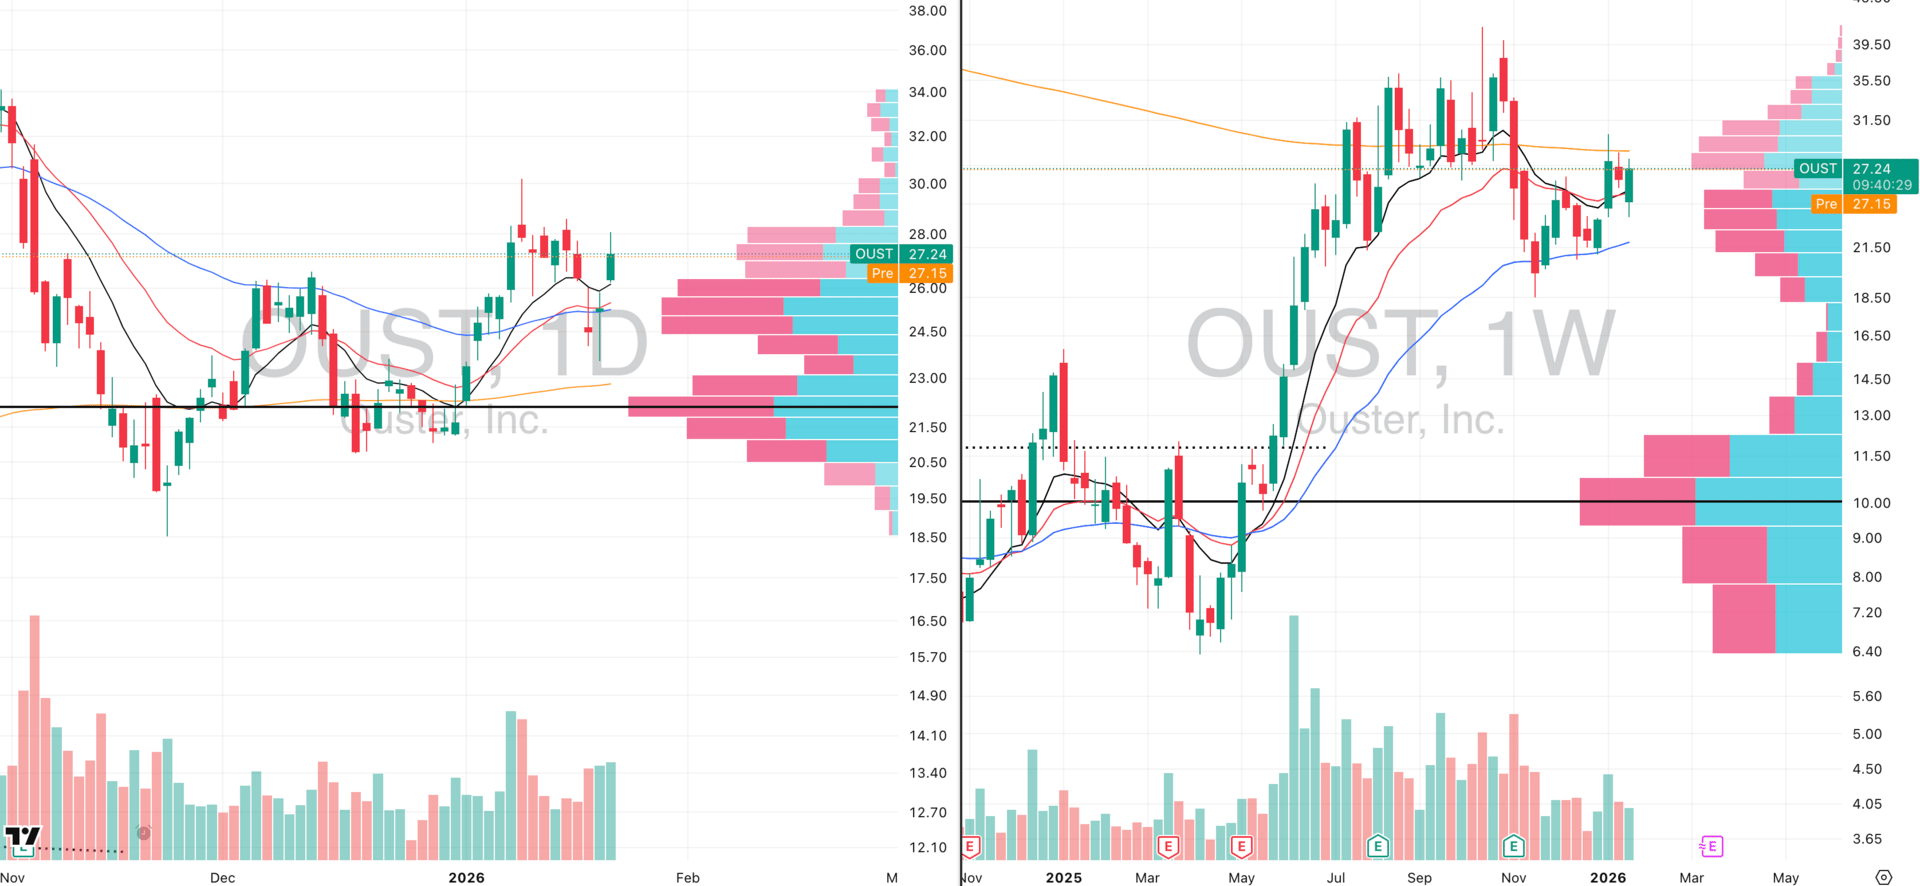
ADR%: 6.60% | Off 52-week high: -34.6% | Above 52-week low: +329.7%
OUST remains a key focus name. It has a 6.6% ADR and is showing constructive semiconductor-related strength outside the mega-cap cohort.
The stock formed a double bottom on November 17th and the week of December 29th, bouncing off the rising 50-week moving average (200-day EMA on the daily).
It has since spent three weeks contracting below the 200-week EMA after a failed breakout attempt on January 9th. Relative volume is now expanding as price pushes higher, while price remains in contraction below the 200-week EMA.
Structurally, this is consistent with continuation behavior. OUST is in a new stage-two advance following a two-year base that extended from February 21st, 2023 to May 27th, 2025, and remains one of the highest-priority names to track for continuation setups.

Did you find value in today's publication?This helps us better design our content for our readers |
Reply