- Swingly
- Posts
- The Sell Off Will Get Worse
The Sell Off Will Get Worse


MARKET ANALYSIS
What You Need To Know

Yesterday’s producer price index came in materially hotter than expected, with wholesale prices rising 0.7% versus 0.3% expected, reinforcing that inflation remains structurally sticky even before the full impact of higher energy prices is fully reflected in the data.
That matters because the market is now being forced to price two conflicting realities at once: equities are technically stretched to the downside and increasingly due some form of mean reversion, while inflation is proving far less cooperative than many expected, which keeps monetary policy restrictive for longer.
Today’s focus is firmly on Federal Reserve, where rates are widely expected to remain unchanged in the 3.5% to 3.75% range, but the real importance sits in how Jerome Powell frames inflation risk, oil, and geopolitical uncertainty in the policy statement.
The inflation print is especially important because it arrived before the latest oil surge has fully flowed through supply chains, which means current producer data likely still understates what elevated energy costs could mean over the coming weeks if crude remains firm.
West Texas Intermediate continues to hold near $97, while Brent Crude remains near $107, showing that energy markets are still pricing meaningful geopolitical risk tied to Middle East supply routes.
The continued tension around the Strait of Hormuz remains central because any prolonged disruption there directly raises transport costs, energy pricing, and broader inflation pressure globally.
Even though U.S. indices closed green yesterday, the internal structure of the move was less convincing than the headline suggests, because once again we saw early strength followed by weaker follow-through and fading momentum into higher prices.
That is not yet the type of behaviour normally associated with strong conviction buying, which is why rallies are still being treated cautiously from a trading perspective.
At the same time, global risk appetite is not collapsing broadly, with KOSPI gaining sharply overnight and Nikkei 225 also moving higher after stronger-than-expected Japanese export data.
That matters because weakness remains concentrated primarily in U.S. equities rather than reflecting a broad global liquidation event.
The key short-term conflict now is that macro headlines remain difficult, oil remains elevated, and inflation remains problematic, yet breadth inside U.S. equities has now compressed enough that upside mean reversion risk is materially increasing.
If today’s Fed communication comes in even slightly less hawkish than feared while oil stabilizes, the market has enough oversold pressure built in to produce a stronger technical bounce than many currently expect.
If inflation language hardens further and oil pushes higher again, the market will likely continue treating rallies as opportunities to sell rather than the beginning of durable recovery.
Nasdaq
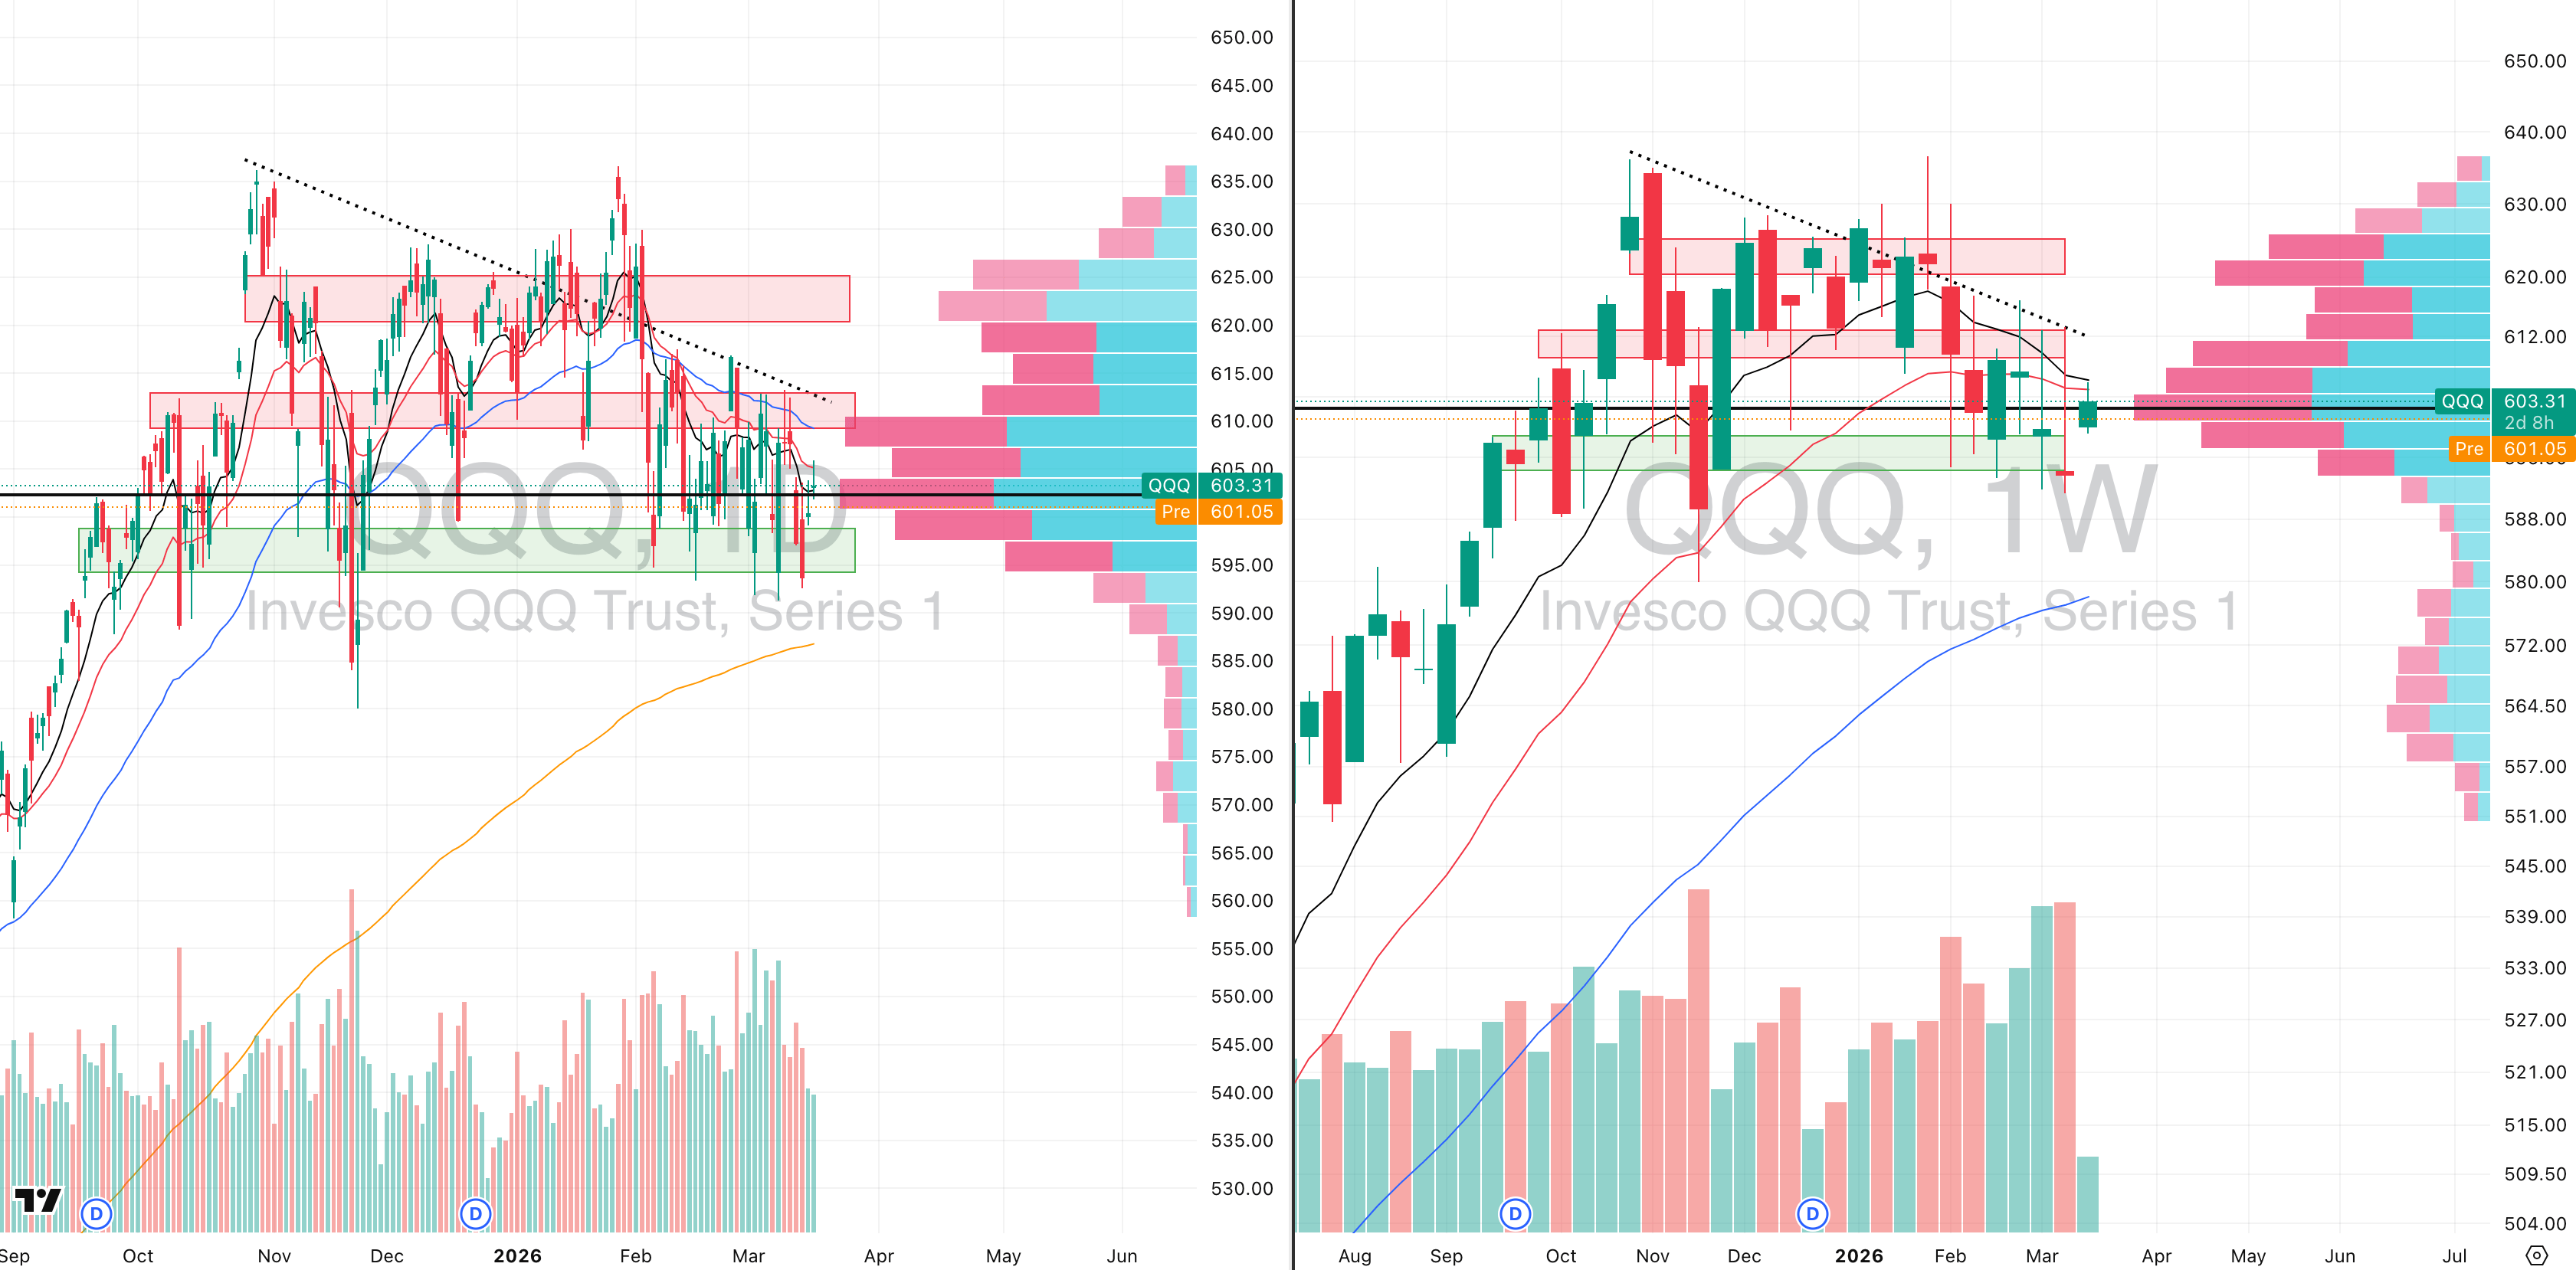
QQQ VRVP Daily & Weekly Chart
30.69%: over 20 EMA | 35.64%: over 50 EMA | 45.54%: over 200 EMA
The QQQ continues to show the same pattern we have been tracking over the last three sessions: a bounce from the 593 demand zone, followed by a low-energy drift directly into overhead resistance.
The most important takeaway is volume. The entire three-day recovery has occurred on declining relative volume, which immediately reduces confidence in the bounce because there is very little evidence that fresh demand is entering at higher prices.
The last two sessions have been especially weak from a participation standpoint, with relative volume running at well below the 20-day average, showing that this recovery has lacked institutional conviction almost entirely.
Price drifted directly into the declining 10-week and 20-week moving averages, and that cluster has once again acted exactly as resistance should inside a broader markdown phase.
Structurally, that was a major warning that the bounce was unlikely to sustain, because when price rises into declining intermediate moving averages on weak participation, the probability of failure rises sharply.
We are now beginning to see that play out this morning, with price already starting to reject that zone again.
From our perspective, the most obvious next move is another retest of 593, which remains the nearest meaningful demand shelf and represents roughly -1.4% downside from current levels.
That move would still fit entirely within the broader Stage 4 breakdown that the QQQ remains in.
Nothing in the current structure suggests that this is trend repair. At present, it still looks like a weak relief bounce inside a larger bearish trend.
The additional macro pressure from rising oil only reinforces that caution, because higher energy prices continue to limit the probability of clean upside expansion in growth-heavy indices like the QQQ.
S&P 400 Midcap

MDY VRVP Daily & Weekly Chart
23.25%: over 20 EMA | 29.50%: over 50 EMA | 47.00%: over 200 EMA
The QQQ continues to show the same pattern we have been tracking over the last three sessions: a bounce from the 593 demand zone, followed by a low-energy drift directly into overhead resistance.
The most important takeaway is volume. The entire three-day recovery has occurred on declining relative volume, which immediately reduces confidence in the bounce because there is very little evidence that fresh demand is entering at higher prices.
The last two sessions have been especially weak from a participation standpoint, with relative volume running at well below the 20-day average, showing that this recovery has lacked institutional conviction almost entirely.
Price drifted directly into the declining 10-week and 20-week moving averages, and that cluster has once again acted exactly as resistance should inside a broader markdown phase.
Structurally, that was a major warning that the bounce was unlikely to sustain, because when price rises into declining intermediate moving averages on weak participation, the probability of failure rises sharply.
We are now beginning to see that play out this morning, with price already starting to reject that zone again.
From our perspective, the most obvious next move is another retest of 593, which remains the nearest meaningful demand shelf and represents roughly -1.4% downside from current levels.
That move would still fit entirely within the broader Stage 4 breakdown that the QQQ remains in.
Nothing in the current structure suggests that this is trend repair. At present, it still looks like a weak relief bounce inside a larger bearish trend.
The additional macro pressure from rising oil only reinforces that caution, because higher energy prices continue to limit the probability of clean upside expansion in growth-heavy indices like the QQQ.
Russell 2000

IWM VRVP Daily & Weekly Chart
26.35%: over 20 EMA | 30.16%: over 50 EMA | 48.74%: over 200 EMA
The MDY printed another very weak session from a participation standpoint, with yesterday’s relative volume coming in at only around 60% of the 20-day average, which is extremely low given the importance of the current level.
That is very similar behaviour to the QQQ and once again signals that this recent bounce is not being supported by meaningful institutional demand.
Low-volume upside attempts inside a weak structure typically fail unless participation expands quickly, and right now we are not seeing that.
We have discussed over the last three sessions that the MDY remains one of the weakest segments in the entire U.S. market, and nothing in the current rebound changes that view.
The current bounce still looks vulnerable to deeper retracement back into the point of control on both the daily and weekly structure, which sits near 611.
That implies roughly -1.52% downside from current price.
The reason that level matters is because it represents the densest recent participation zone and the most likely area where price would attempt stabilization again if selling resumes.
Relative volume continues to be the biggest issue here. Even when price attempts to recover, participation fades immediately, which tells you buyers are still highly hesitant.
This remains a structurally weak chart, and until volume begins expanding on upside sessions, every bounce still needs to be treated cautiously.

Did you find value in today's publication?This helps us better design our content for our readers |
Reply