- Swingly
- Posts
- The Rally is Here: Where To Go Long
The Rally is Here: Where To Go Long
In partnership with

MARKET ANALYSIS
Here’s All You Need To Know
U.S. equity futures are trading relatively flat this morning as markets pause near record highs and await further labor market data, with ADP private payrolls and JOLTS in focus ahead of Friday’s jobs report.
Recent data has been mixed. Services activity slowed in December, reinforcing the view that parts of the economy are cooling, while labor market indicators continue to suggest a low-hire, low-fire environment rather than outright deterioration.
Markets have largely shrugged off recent geopolitical developments, including U.S. actions in Venezuela, with investor attention shifting back toward domestic economic data and earnings expectations.
The CES conference continues to generate headlines around artificial intelligence, particularly following commentary from Nvidia and AMD. While the AI narrative remains intact, price action across large-cap tech has been uneven, with follow-through lacking in several recent breakouts.
This has led to a growing narrative that the market is “consolidating near highs” and that momentum has faded. We strongly disagree with that interpretation.
When most participants say “the market,” they are typically referring to SPY and QQQ. That framing is misleading in the current environment.
SPY and QQQ are dominated by a narrow group of mega-cap technology stocks. As those names churn and digest gains, they give the impression that the broader market is stalling, even when that is not what is actually happening beneath the surface.
This is why we consistently look beyond headline indices. Right now, the most important signals are coming from mid-cap and small-cap indices, not from the cap-weighted benchmarks.
Our scans are showing broad-based participation across multiple sectors and capitalization tiers. Financials, industrials, and select growth segments are all advancing together, while mid-cap and small-cap indices continue to outperform large-cap tech on a relative basis.
Nasdaq
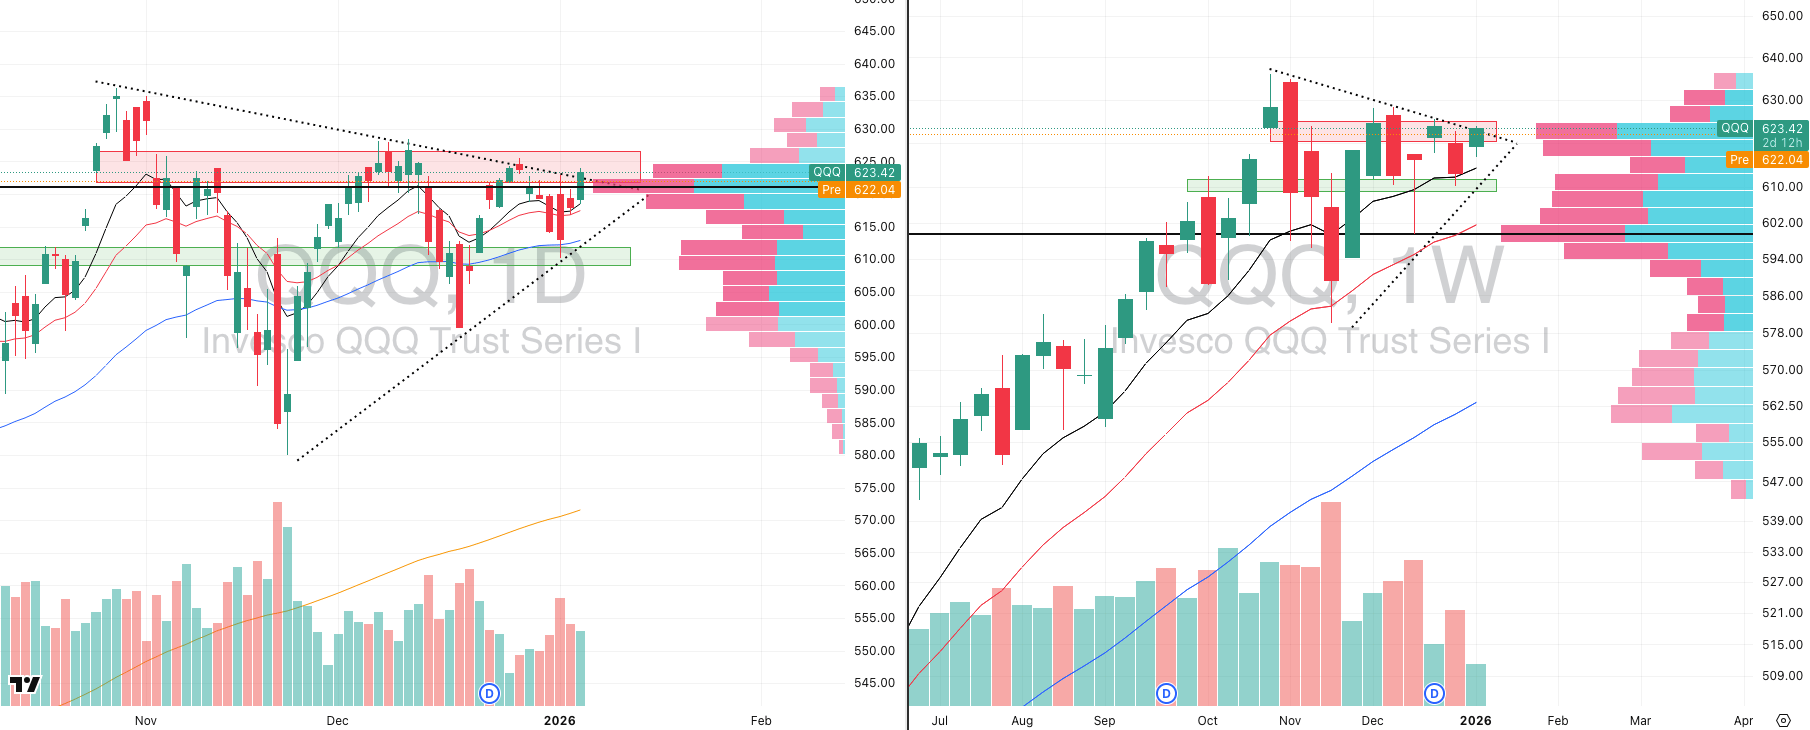
QQQ VRVP Daily & Weekly Chart
57.84%: over 20 EMA | 55.88%: over 50 EMA | 60.78%: over 200 EMA
The NASDAQ did briefly push above its declining level of resistance around 623, but the move lacked conviction. Relative volume did not expand meaningfully, and price failed to establish itself cleanly above that trendline.
From our perspective, a true breakout only begins once price can decisively clear the 625 area, where supply remains clearly visible.
Structurally, the NASDAQ remains in a very tight contraction. That is not a sign of weakness. It is a sign of compression. We do expect resolution higher at some point, but as traders, timing and relative strength matter more than direction alone.
When we compare the NASDAQ’s relative strength to other segments of the market, it is currently lagging. Internally, our scans across leading NASDAQ components are also showing mild degradation, particularly among recent breakout attempts.
At the time of writing, we are seeing a modest pullback this morning. That is not problematic. What matters is that price continues to hold above the rising 10-day and 20-day EMAs around 617. As long as those levels remain intact, the broader structure stays constructive.
There is substantial support packed into a very tight range below current price. The next meaningful downside level sits near the rising 10-week EMA and ascending support structure, roughly 1.26% lower. We are not forecasting a move there, but the proximity of support reinforces how compressed this range has become.
Despite mainstream narratives suggesting the NASDAQ looks “weak,” we strongly disagree. The NASDAQ is pausing, not breaking down, and there is nothing technically here that undermines the broader trend.
S&P 400 Midcap
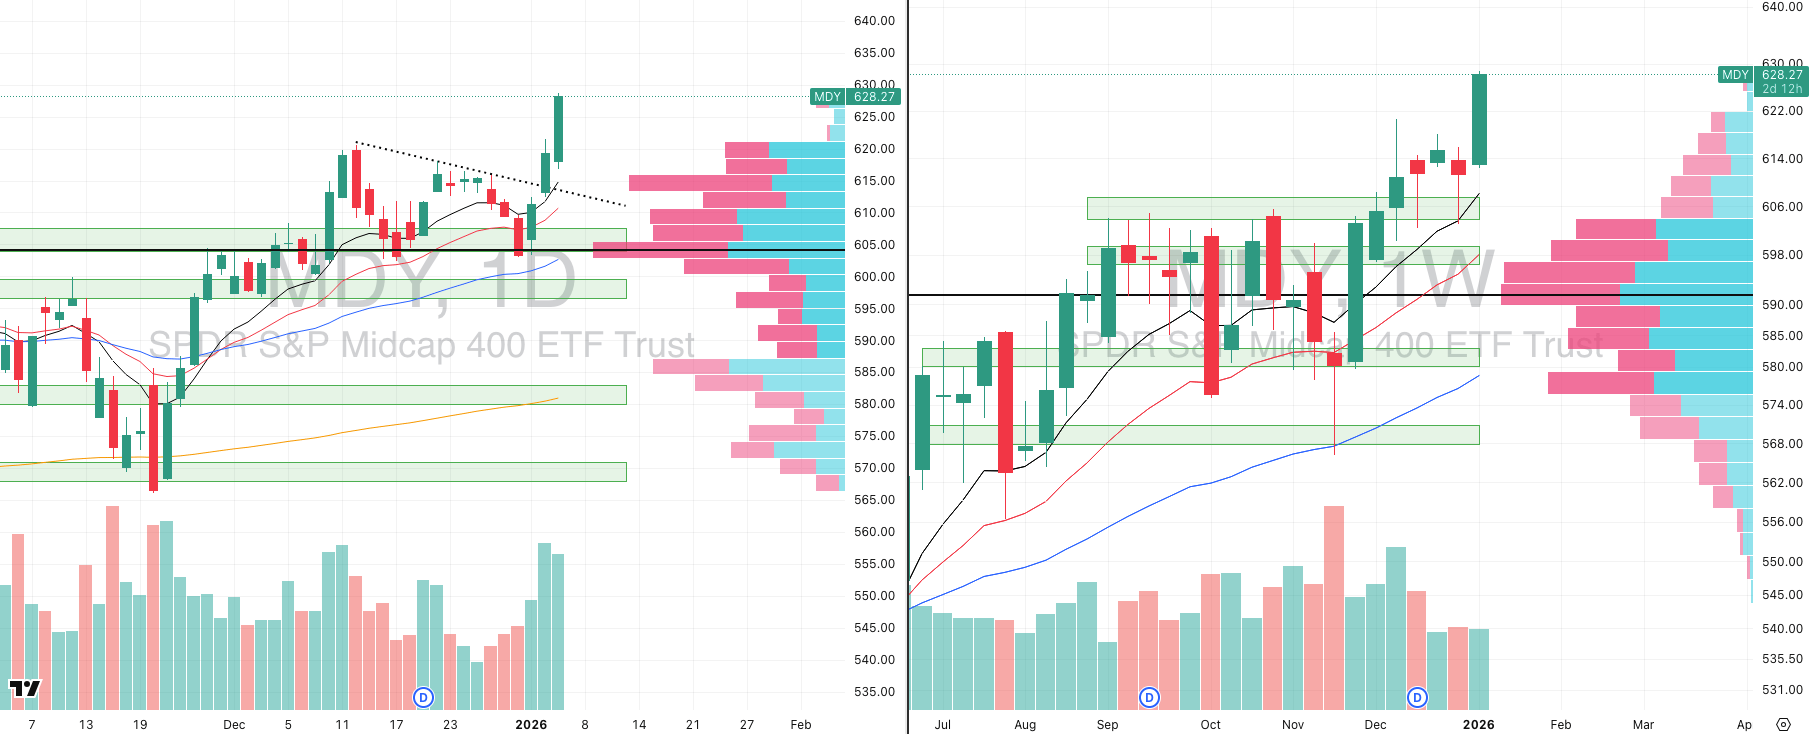
MDY VRVP Daily & Weekly Chart
73.93%: over 20 EMA | 73.43%: over 50 EMA | 66.41%: over 200 EMA
The mid-caps remain the clear leadership group in this market. The contrast versus the NASDAQ is striking. While large-cap tech is consolidating, mid-caps are actively pushing higher with authority.
Over the past two sessions, relative strength and relative volume have expanded meaningfully. Yesterday’s advance came on approximately 141% of 20-day average volume, following an even stronger surge the session prior. This is exactly what leadership looks like.
Importantly, last week’s pullback found support precisely where it needed to, at the rising 10-week EMA. That bounce was decisive, and price has followed through aggressively since.
While MDY is now modestly extended in the very short term, it remains one of the most valuable tools for understanding where capital is flowing. From a tactical standpoint, we would not chase the index itself here, but we are actively using MDY as a roadmap for where to focus stock-level exposure.
From a trader’s perspective, this is the segment demanding attention. Filtering scans toward mid-cap names with constructive pullbacks is currently the highest-probability approach.
Russell 2000
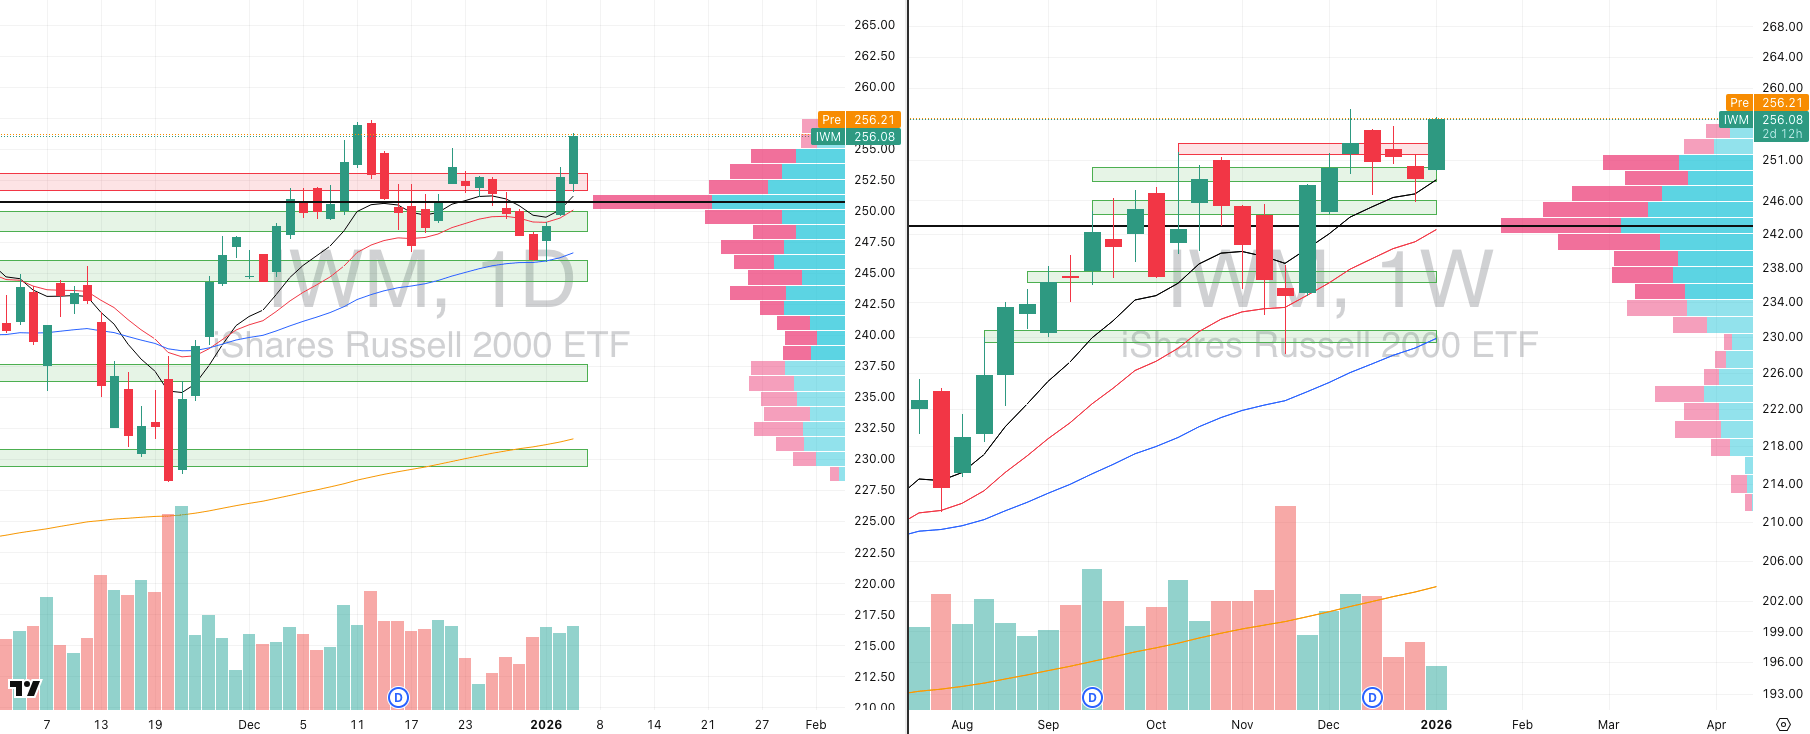
IWM VRVP Daily & Weekly Chart
52.72%: over 20 EMA | 63.66%: over 50 EMA | 63.46%: over 200 EMA
Small caps continue to trend higher and are materially outperforming the NASDAQ, though they still trail mid-caps slightly in relative strength.
Price is approaching prior highs near 257.40, the peak established on December 11th and 12th. That remains the final overhead level before all-time highs, and it is reasonable to expect some reaction there.
Even so, the intermediary trend is exceptionally strong. Recent action shows price reclaiming key levels, including a break above a former supply zone that had capped price since October.
Notably, the most recent pullback found support at the 10-day EMA before pushing higher. That combination, a pullback into short-term support followed by a breakout through prior resistance, is where long-side asymmetry is at its best.
While small caps do not yet have the same momentum profile as mid-caps, they remain firmly in an aggressive uptrend and continue to validate the broader thesis of market rotation rather than market weakness.
The Year-End Moves No One’s Watching

Markets don’t wait — and year-end waits even less.
In the final stretch, money rotates, funds window-dress, tax-loss selling meets bottom-fishing, and “Santa Rally” chatter turns into real tape. Most people notice after the move.
Elite Trade Club is your morning shortcut: a curated selection of the setups that still matter this year — the headlines that move stocks, catalysts on deck, and where smart money is positioning before New Year’s. One read. Five minutes. Actionable clarity.
If you want to start 2026 from a stronger spot, finish 2025 prepared. Join 200K+ traders who open our premarket briefing, place their plan, and let the open come to them.
By joining, you’ll receive Elite Trade Club emails and select partner insights. See Privacy Policy.
FOCUSED STOCK
DAVE: The Number 1 Stock On Our List
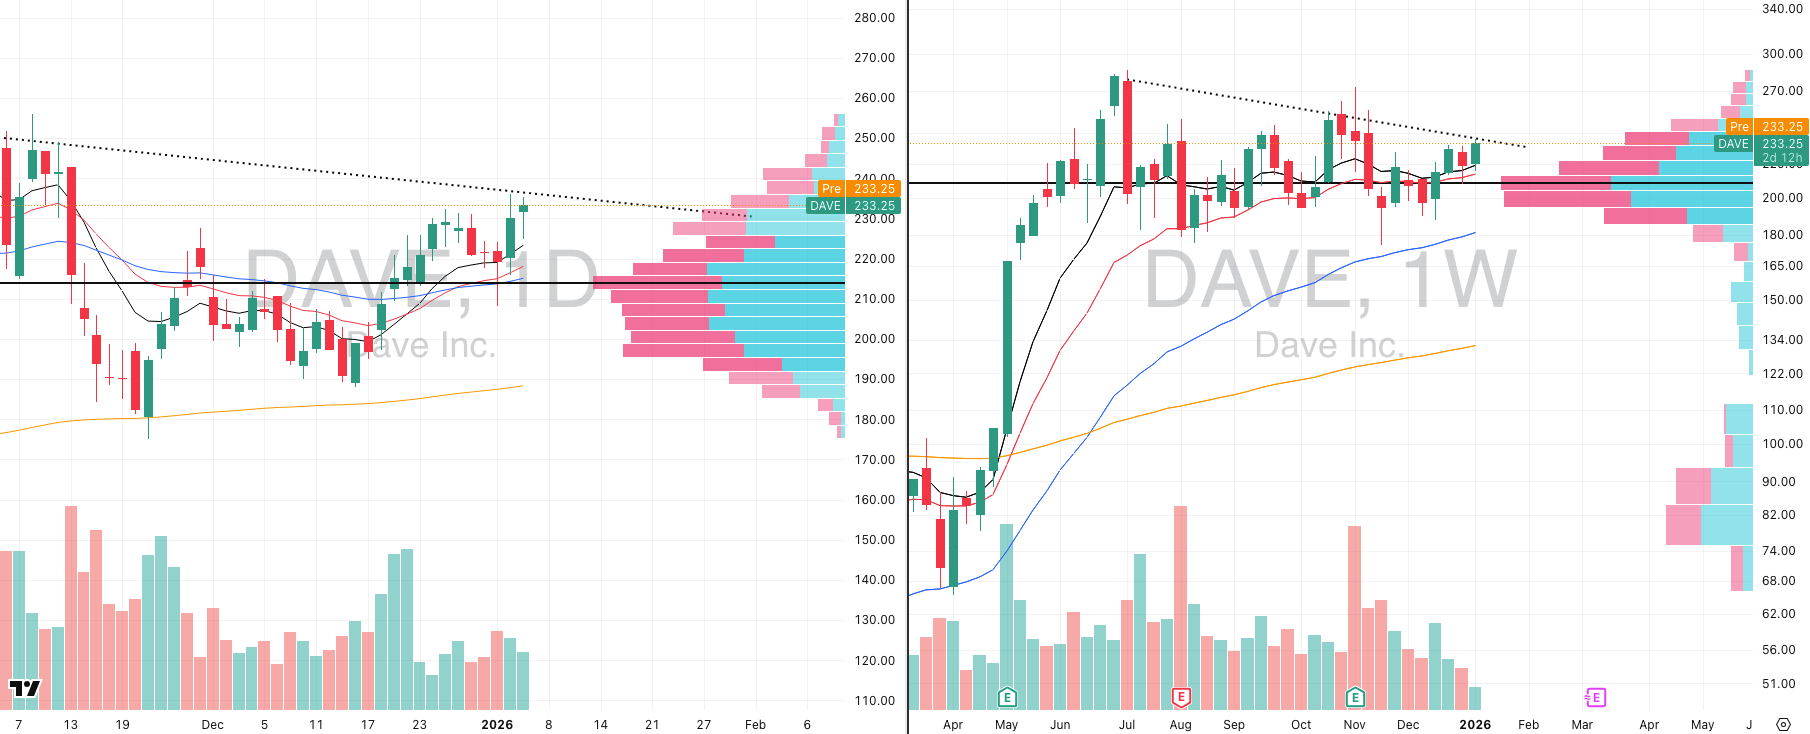
DAVE VRVP Daily & Weekly Chart
ADR%: 5.77% | Off 52-week high: -18.6% | Above 52-week low: +256.3%
Dave is currently the number one stock on our radar, and that is not an exaggeration. From a pure relative strength perspective, it sits at a 98 reading versus the broad market, placing it firmly among the strongest stocks trading today.
This is also a very high-momentum name, with an ADR just under 6%, which immediately puts it into the category of stocks capable of producing outsized moves when conditions align.
From a structural standpoint, Dave checks every box we look for in a leadership name. On the weekly chart, it was a prior market leader, with a major breakout that began in 2023. Since reclaiming its rising 50-day moving average at the start of 2024, the stock has not violated that trend even once.
Historically, Dave has shown a very consistent behavior pattern. Each time it consolidates sideways, both volume and range compress meaningfully, followed by sharp expansions higher. In April 2025, we personally traded Dave during one of these setups, capturing a move of approximately 250%.
What we are seeing now is the same structural setup forming again. Price has been trending sideways, volatility has collapsed, average true range has tightened materially, and volume has dried up. These are exactly the conditions that typically precede expansion in strong trend-following leaders.
On top of that, Dave sits in the strongest sector in the market right now, financials, and it is also a small-cap name, which further aligns it with the areas currently showing the most relative strength across the tape.
Whether Dave breaks out today is not the primary concern. The key takeaway is that this is a top-tier leader in a leading group, and it should be tracked very closely. Stocks like this are often the ones that lead the next leg higher once momentum expands.
FOCUSED GROUP
RSPT: Equal Weight Tech > Cap Weight Tech
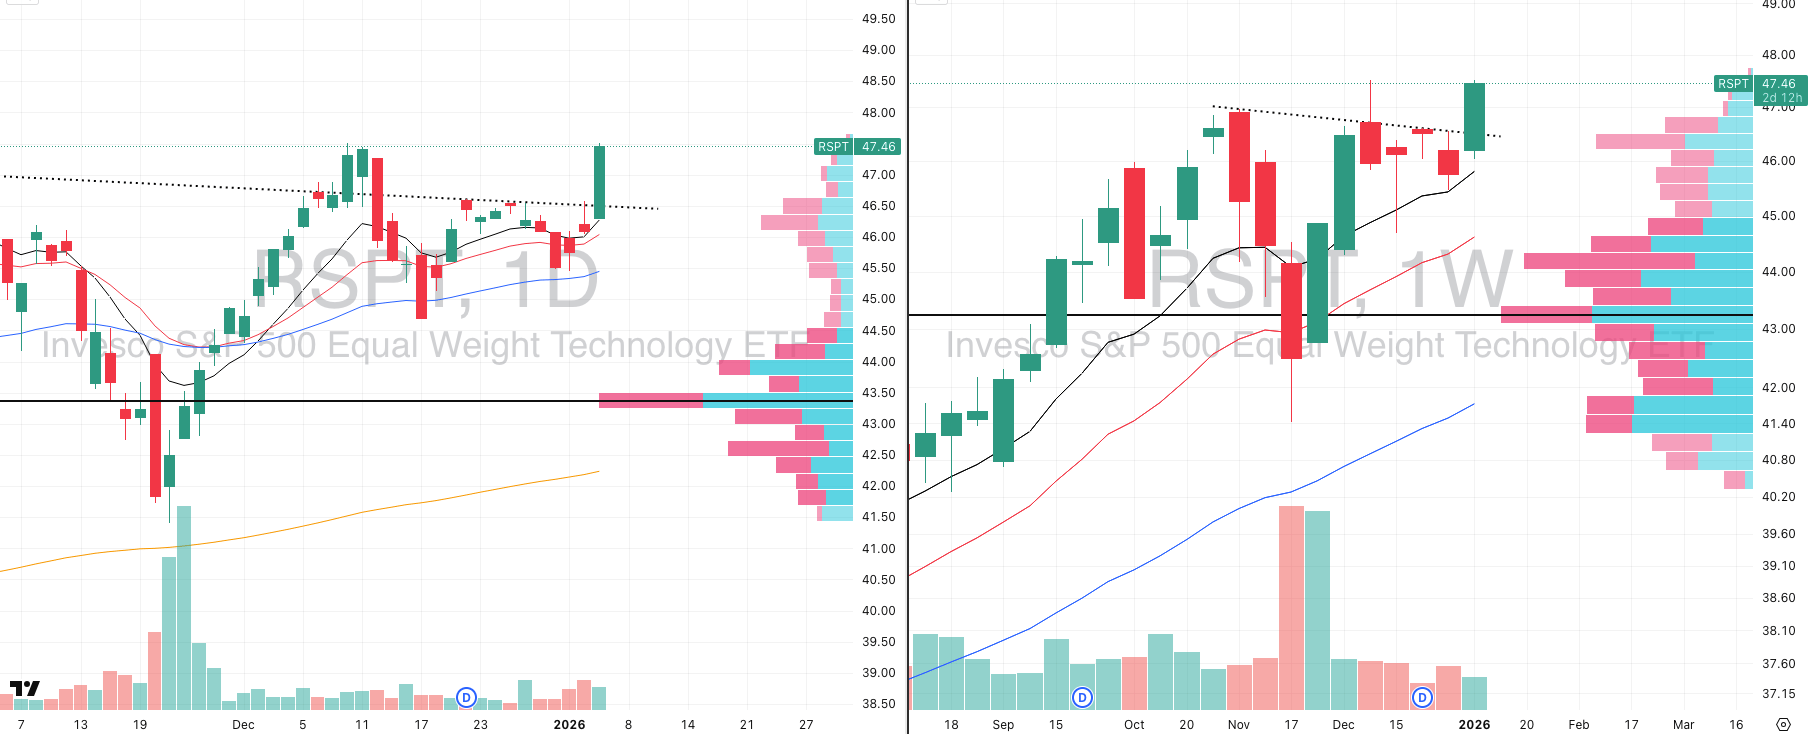
RSPT VRVP Daily & Weekly Chart
For our focus group, we are highlighting equal weight technology, not as a direct trading vehicle, but as an important signal beneath the surface of the market.
What stands out clearly is the divergence between equal weight technology and the NASDAQ. While the NASDAQ, which is heavily cap-weighted toward mega-cap names, has been lagging, equal weight technology is actively breaking out.
This tells us something critical. Technology as a sector is not weak. The weakness is concentrated in the mega-cap names, while smaller and mid-cap technology stocks are pushing higher.
This capitalization-level divergence matters. When traders say “tech is weak,” they are often referring to the NASDAQ or a handful of mega-cap stocks. When you look deeper, leadership is rotating, not disappearing.
If you are looking to maintain or increase technology exposure, the message here is not to avoid tech, but to shift down the risk curve. Smaller and mid-cap technology names are where momentum is currently expressing itself.
We also highlighted quantum computing recently, which has already broken out. That segment sits firmly within this theme of higher-growth, more speculative areas of technology leading while mega-cap tech digests.

Did you find value in today's publication?This helps us better design our content for our readers |
Reply