- Swingly
- Posts
- The Rally is Here: Time To Push
The Rally is Here: Time To Push
In partnership with


MARKET ANALYSIS
Here’s What You Need To Know

Markets are continuing the same process that started after the Fed decision: money is rotating out of crowded growth and into cyclicals, small cap names and further down the cap spectrum.
Index futures this morning reflect that clearly. Dow futures are higher, S&P futures are flat to slightly lower, and Nasdaq futures are under pressure again.
Nvidia, Micron, Oracle, and other AI-adjacent names are extending their recent pullback. This is the third consecutive session of weakness in that complex, and it is occurring after a very strong multi-month run. That context matters however again these are the large/mega-cap names, the small/mid-cap names are strong.
Strength is also showing up exactly where you would expect in a post-cut environment. Financials, Industrials, Health Care, and parts of Consumer are attracting consistent flows, both yesterday and again in pre-market today.
Comments from Fed officials overnight leaned slightly dovish, with more emphasis placed on labor market risk than inflation risk. That supports the idea that policy remains biased toward easing if growth shows any signs of slowing.
Nasdaq
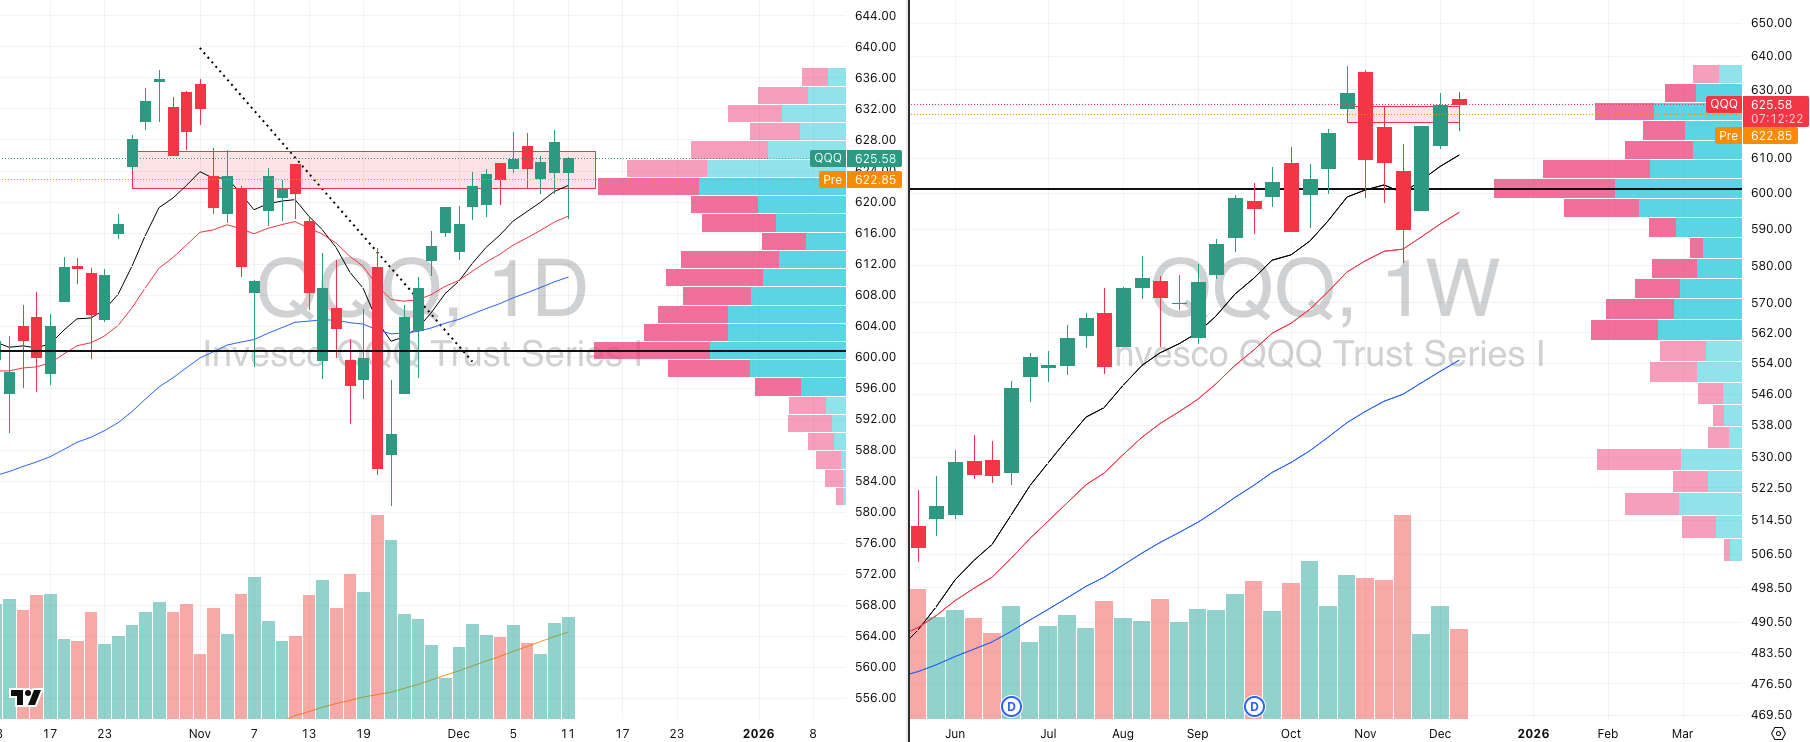
QQQ VRVP Daily & Weekly Chart
67.32%: over 20 EMA | 58.41%: over 50 EMA | 57.42%: over 200 EMA
The Nasdaq saw a sharp shakeout yesterday, with a fast push lower toward the 618 area, which was a scenario we explicitly highlighted as a risk given the ongoing rotation out of mega-cap tech.
The selloff came on roughly average relative volume, but what matters far more is how price behaved into the close rather than the intraday volatility itself.
Despite the aggressive downside move, buyers stepped in decisively, and QQQ closed back inside the prior range rather than breaking down. That response is important context.
Supply remains clearly overhead in the 625–628 zone, and price is still reacting to that area, but there is now mounting evidence that the Nasdaq is struggling to follow through on the downside.
Pullbacks over the past several sessions have consistently been bought, suggesting that while QQQ may be lagging relative to mid and small caps, it is not behaving like a market that wants to trend lower.
From a broader perspective, the Nasdaq is still only around 1.8% below all-time highs. That alone should temper any reflexive bearish conclusions based purely on headlines or single-session moves.
The more likely interpretation is continued digestion and underperformance rather than structural weakness, especially given the strength being seen elsewhere in the market.
As always, the focus should remain on price and volume at the close. Intraday volatility is expected in this environment, but the inability of sellers to press follow-through lower remains the key takeaway.
S&P 400 Midcap
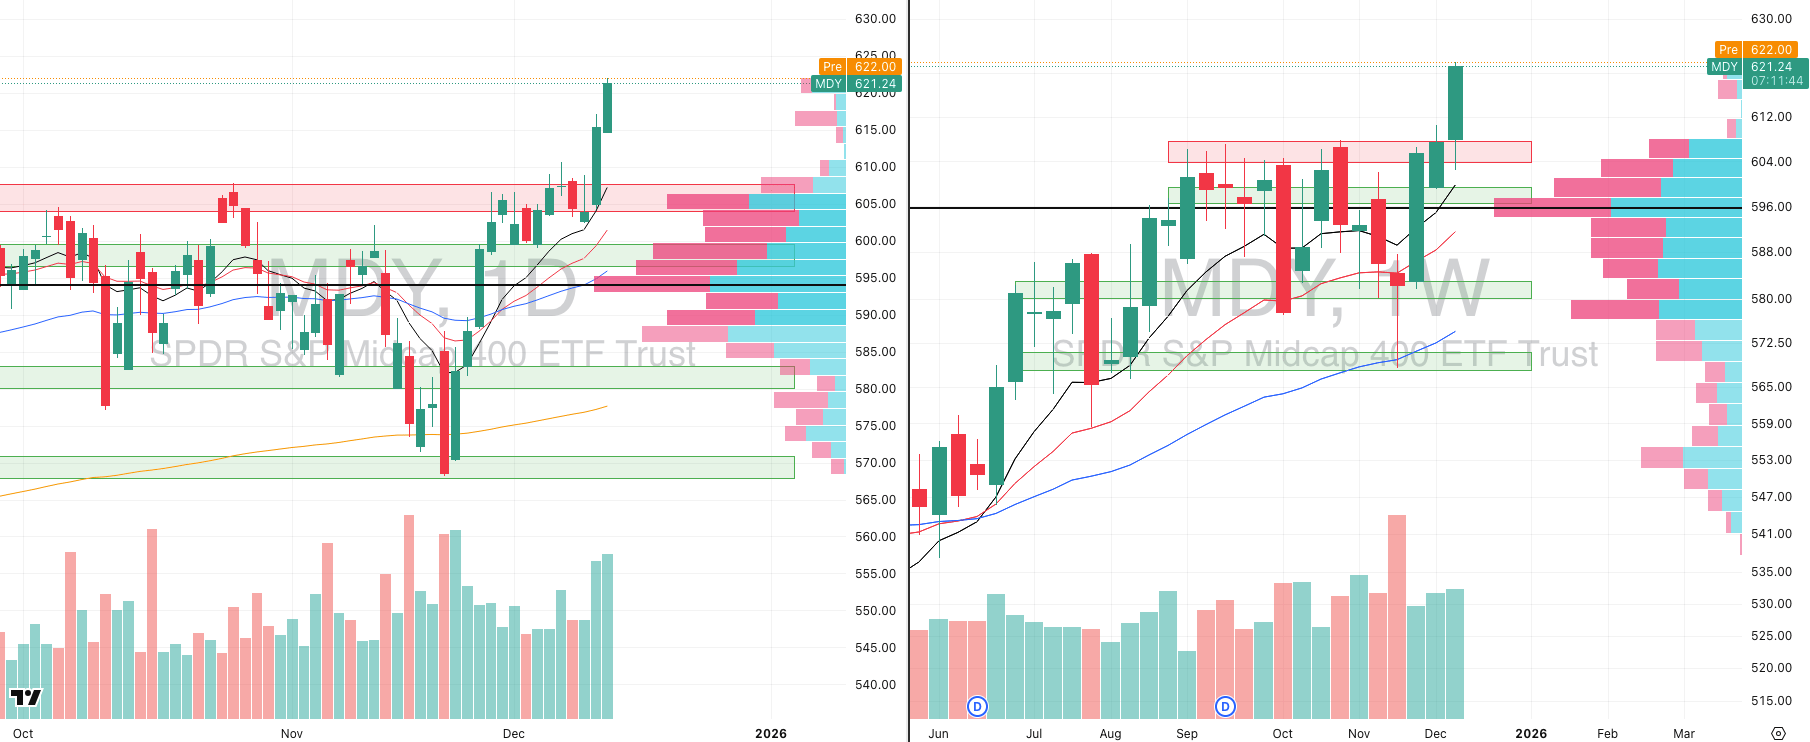
MDY VRVP Daily & Weekly Chart
76.30%: over 20 EMA | 67.83%: over 50 EMA | 63.34%: over 200 EMA
The mid-cap space continues to validate why we have been consistently leaning into it over the past several weeks. Yesterday’s session delivered a decisive breakout, supported by roughly 150% relative volume, following a prolonged contraction that began in late November.
That contraction phase mattered. Since November 26th, price tightened, volatility compressed, and volume began to expand subtly beneath the surface. When breakouts emerge from that type of structure, they tend to carry persistence rather than fail quickly.
The follow-through after Wednesday’s initial breakout is particularly important. This was not a one-day move driven by positioning noise. Price expanded, held, and continued higher, confirming real demand rather than short-term speculation.
On the higher timeframe, the morning star formation we highlighted during the week of November 24th has now fully resolved to the upside. That pattern aligned cleanly with improving volume behavior and expanding range, reinforcing the idea that the intermediate trend has shifted decisively higher.
Russell 2000
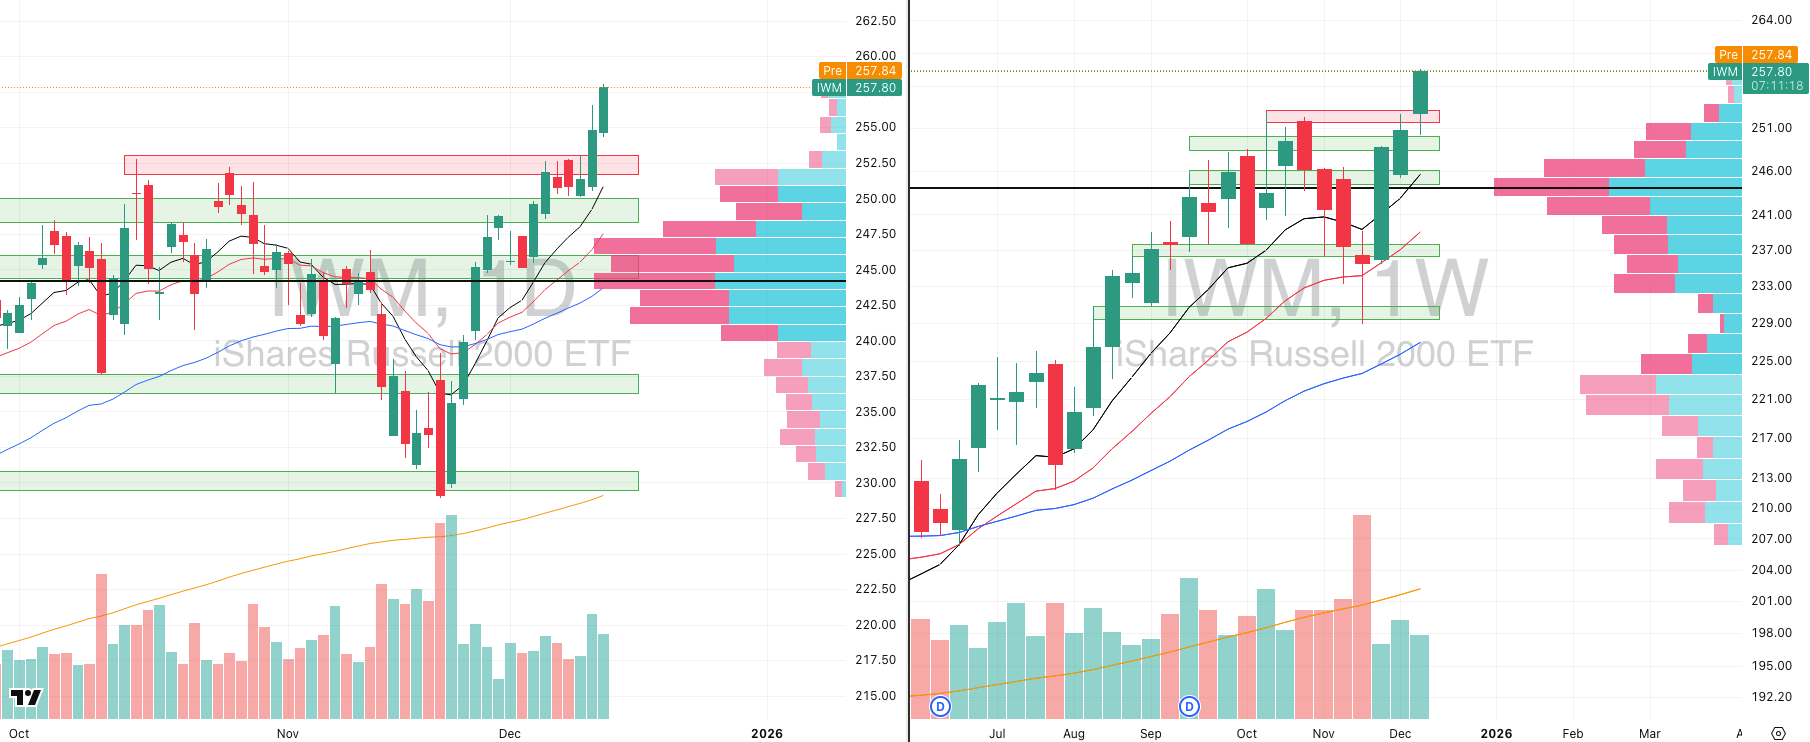
IWM VRVP Daily & Weekly Chart
82.81%: over 20 EMA | 69.71%: over 50 EMA | 66.35%: over 200 EMA
Small-caps continue to trend constructively and remain in a strong uptrend, though it is worth noting that relative strength is currently stronger in mid-caps than in small-caps, which is an important distinction.
Yesterday’s session produced another solid continuation move in IWM, supported by approximately 100% relative volume. This followed a clean expansion off the 10-day EMA near $250.60 on Wednesday, which acted as the springboard for the current leg higher.
From a structural perspective, IWM has now been advancing in a near-straight line for roughly three weeks. That tells us demand is persistent, pullbacks are being absorbed quickly, and sellers are failing to gain traction.
While short-term pauses or shallow retests would be entirely normal at this stage, there is no technical evidence yet of distribution or exhaustion that would invalidate the trend.
What matters most is confirmation across the broader universe. Morning scans continue to surface an increasing number of actionable setups across multiple groups, particularly outside of mega-cap technology. That type of participation tends to accompany sustainable trends rather than late-stage moves.
This is precisely why we continue to stress discipline around narratives. Headlines will always fluctuate, but momentum, volume, and relative strength are telling a very clear story: leadership remains concentrated in small- and mid-cap growth rather than the largest names in the market.
7 Ways to Take Control of Your Legacy

Planning your estate might not sound like the most exciting thing on your to-do list, but trust us, it’s worth it. And with The Investor’s Guide to Estate Planning, preparing isn’t as daunting as it may seem.
Inside, you’ll find {straightforward advice} on tackling key documents to clearly spell out your wishes.
Plus, there’s help for having those all-important family conversations about your financial legacy to make sure everyone’s on the same page (and avoid negative future surprises).
Why leave things to chance when you can take control? Explore ways to start, review or refine your estate plan today with The Investor’s Guide to Estate Planning.
FOCUSED STOCK
QBTS: Quantum Computing is Next
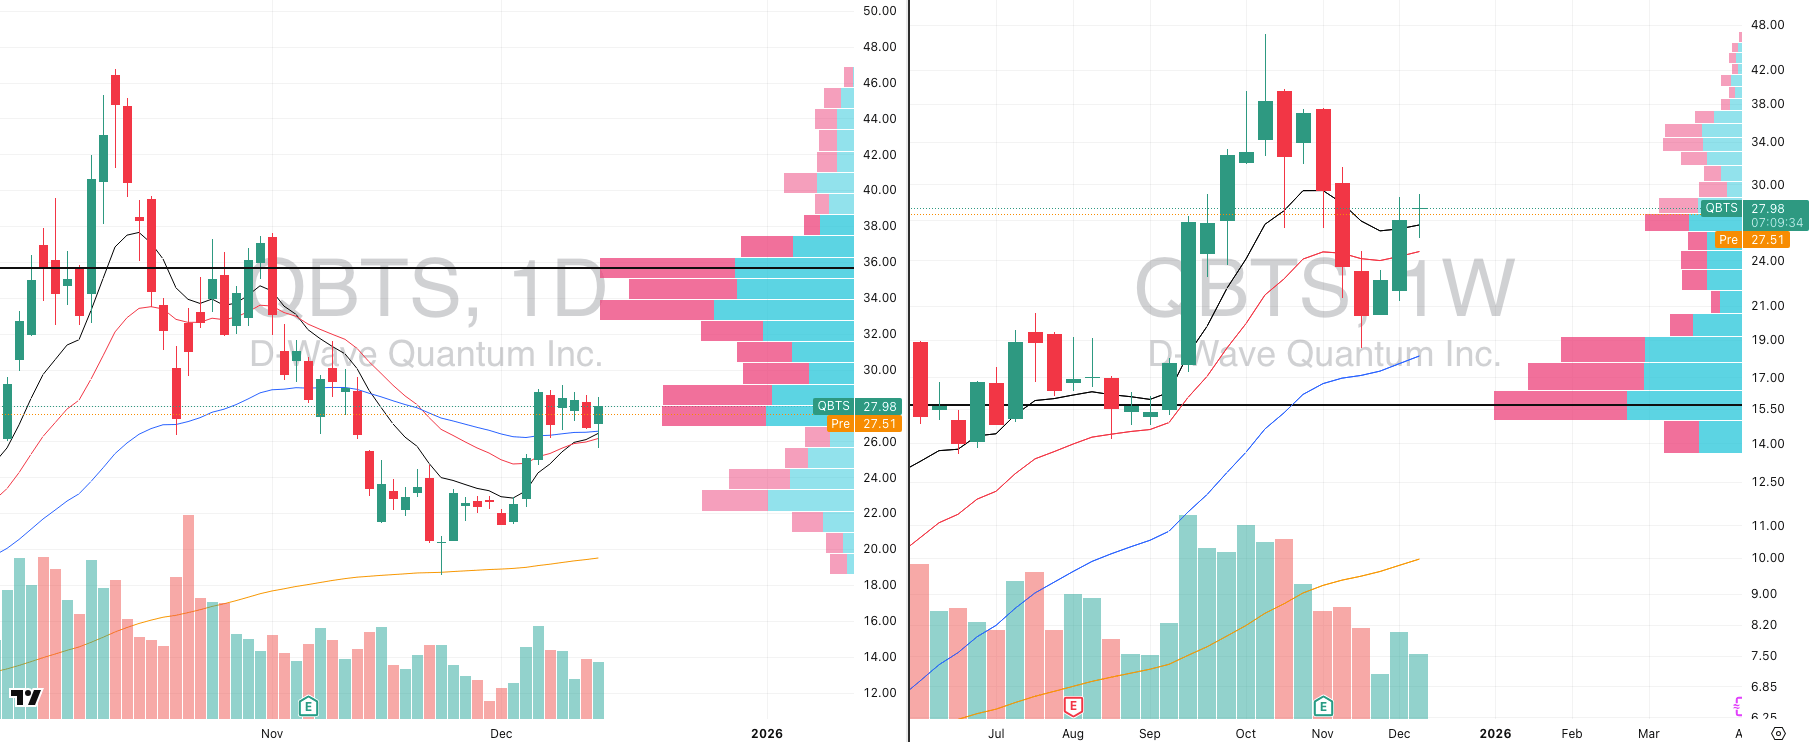
QBTS VRVP Daily & Weekly Chart
ADR%: 9.81% | Off 52-week high: -40.1% | Above 52-week low: +654.2%
The quantum computing group as a whole is tightening, and that is important context. This is not an isolated setup — strength is appearing across multiple names in the space.
QBTS is the clear leader within the group. Relative strength versus the broad market is sitting at the top of the range, which is exactly what you want to see before a potential expansion phase.
Price found support off the rising 200-day moving average in late November, followed by a strong impulse move into early December on expanding volume.
Since that push, QBTS has transitioned into consolidation rather than distribution. Price is holding above the 10-week EMA and remains supported by the 10, 20, and 50-day moving averages.
Over the past week, volatility has compressed noticeably. Ranges are tightening, and volume has backed off in a constructive way rather than showing signs of supply.
This type of behavior — expansion followed by controlled consolidation above rising averages — is exactly what we look for before continuation in speculative growth environments.
Given how many stocks in the quantum computing space are now setting up simultaneously, the probability of a group-level expansion is increasing.
FOCUSED GROUP
BLOK: Blockchain Technology Looks Ready
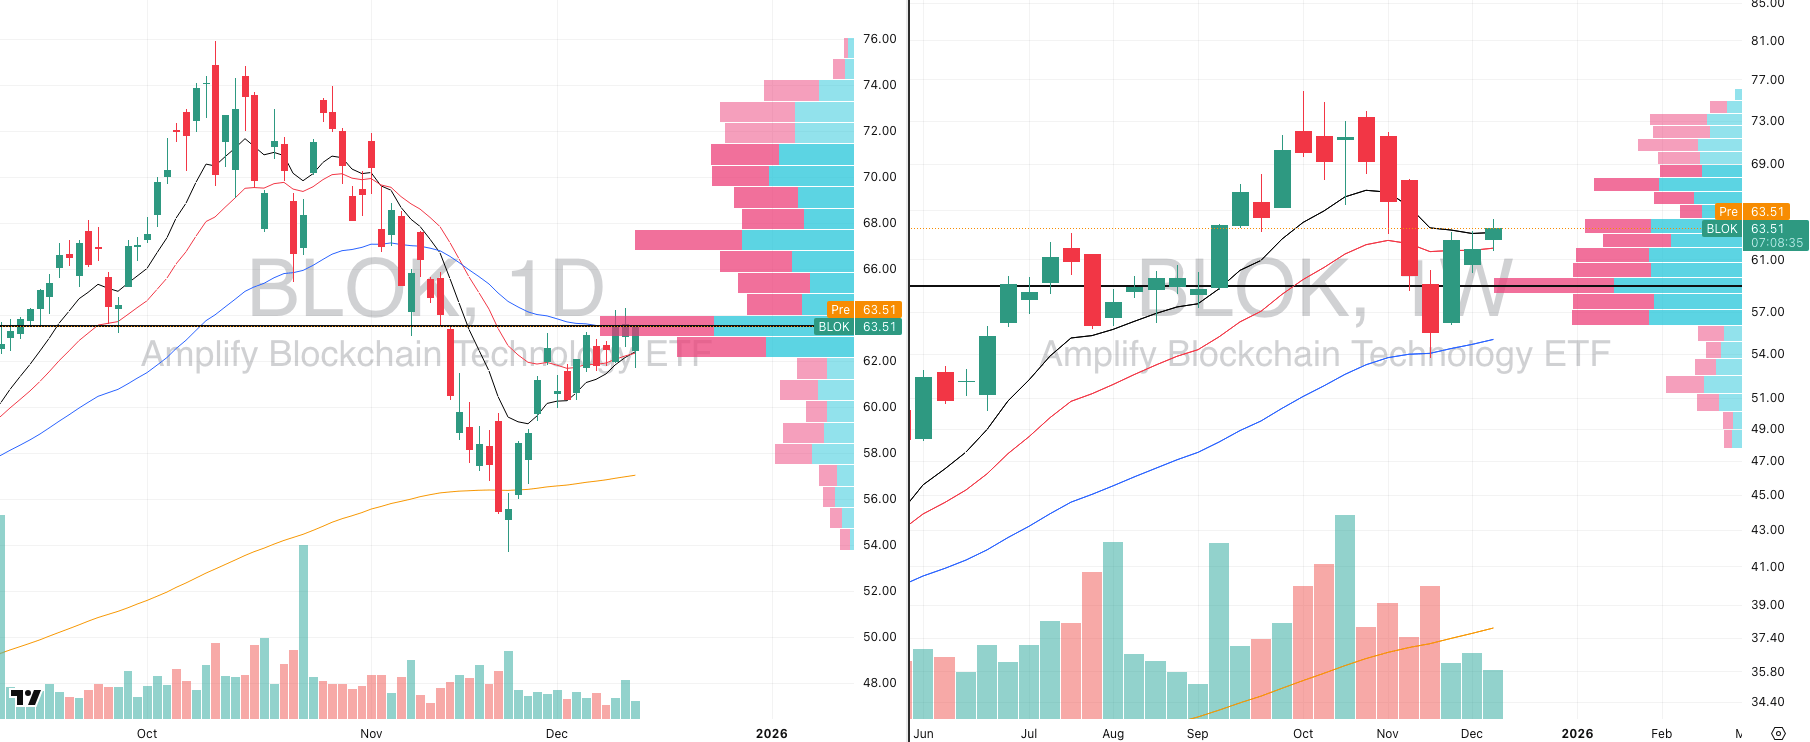
BLOK VRVP Daily & Weekly Chart
Blockchain equities are starting to show similar structural behavior to what we are seeing in other higher-beta growth groups.
BLOK found support at the rising 50-week moving average following the late-November selloff, which marked a clear change in downside momentum.
Since that low, price has rebounded sharply and is now consolidating just beneath the 10-week and 50-day moving averages.
Volatility has compressed meaningfully over the past several sessions, suggesting supply is being absorbed rather than aggressively sold into.
The visible range volume profile shows limited overhead supply once price clears the mid-60s area, which makes that zone an important level to monitor.
Strength in blockchain equities often aligns with improving risk appetite more broadly, particularly within speculative and momentum-driven areas of the market.
If BLOK resolves higher, it would likely confirm continued rotation into higher-beta growth rather than signaling exhaustion.

Did you find value in today's publication?This helps us better design our content for our readers |
Reply