- Swingly
- Posts
- The Next Two Sessions Set the Tone
The Next Two Sessions Set the Tone
In partnership with
OVERVIEW
What You Need To Know
Macro
AI leaders digesting post earnings with valuation reset, not thesis violation; elevated multiples invite volatility until trend sponsorship returns
Soft landing evidence building as labor data remains orderly and earnings strength persists, keeping downside contained barring credit deterioration
QQQ
Failed reclaim of 10 day EMA puts tactical control with sellers as price travels through a thin liquidity zone toward 612, where first true demand sits
Rising VIX and failure at highs suggests choppy tape with poor follow through until price finds structure at a real level
MDY
Defended 20 week EMA at 584 but continues to show sloppy structure and persistent supply on every bounce attempt
Respect support but patience favored as buyers must prove sponsorship via relative strength and reclaim of short term MAs before exposure makes sense
IWM
Rejected 244 POC intraday and now sitting on 50 day and 10 week EMA confluence with soft demand character
Constructive trend support still intact but repeated seller control on rallies argues for waiting until demand confirms through higher lows and EMA reclaim

MARKET ANALYSIS
Sitting Out Might Be the Winning Trade

AI leadership wobbles but holding up
Post-earnings digestion continues in AI hardware and infrastructure names. Margins/guidance were “good but not good enough,” and the market is punishing anything short of acceleration. The takeaway isn’t a narrative shift away from AI, but a recalibration after a crowded, extended run. Forward multiples remain elevated vs. history, so this is a valuation-clearing phase rather than a fundamental unwind.Earnings remain constructive
With ~360 S&P companies reported, beat rates sit ~82% and blended EPS growth >12% showing a meaningful positive in a tape that has become more sentiment-driven than data-driven this week. Despite isolated high-profile misses, corporate profitability is not confirming recessionary fears.Labor: ADP showing stability versus doom narratives
Private payrolls +42k vs +22k expected, reversing last month’s decline. Incremental but important: labor softening remains orderly and this supports a soft-landing path and reduces tail-risk around forced policy reactions.
This sets up asymmetric paths:
If leadership stabilizes at trend + breadth holds → continuation into year-end still on the table.
If AI weakness bleeds into credit or consumption → drawdown deepens, but macro data does not yet justify panic positioning (the odds of a stabilisation and not a deep correction appear higher right now).
Nasdaq

QQQ VRVP Daily & Weekly Chart
% over 20 EMA: 39.21% | % over 50 EMA: 51.96% | % over 200 EMA: 52.94%
Clear character shift as we had a failed reclaim of the 10-day EMA → short-term control back to sellers
Slide into a low-liquidity zone on VRVP and there is inefficient structure until ~612
That area = prior October pivot + first real demand shelf
This appears like an orderly pullback into empty air, where price tends to move quickly and sloppily
Weekly chart map reinforces the same liquidity gap down to ~612
Rising VIX + failed highs = choppy tape with poor follow-through until buyers step in at a real level
We would be extremely cautious building aggressively long or short position here unless looking for intraday swings.
S&P 400 Midcap
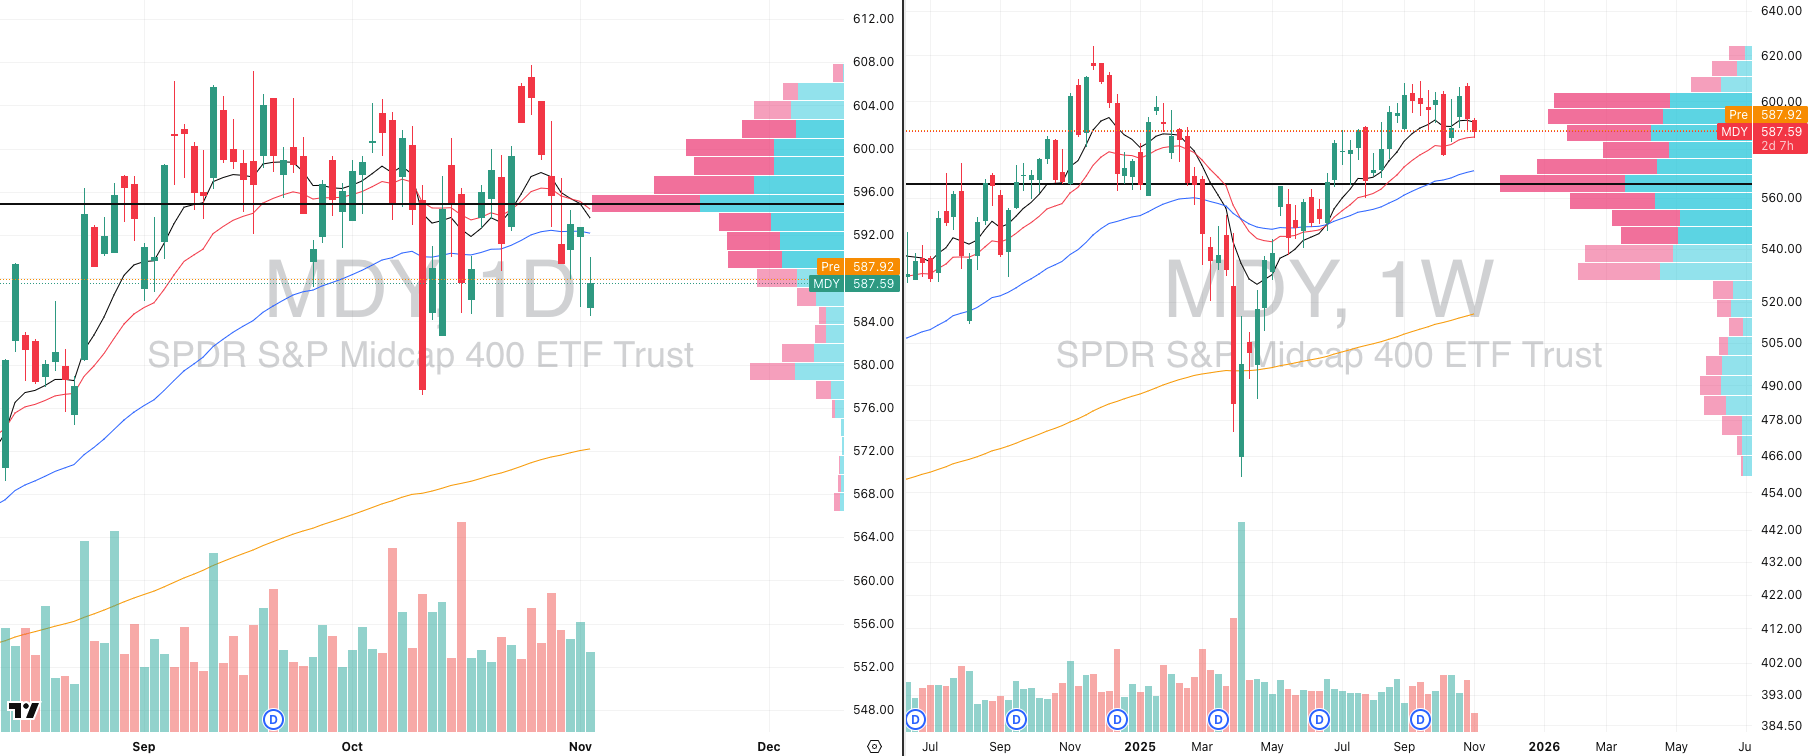
MDY VRVP Daily Chart
% over 20 EMA: 34.66% | % over 50 EMA: 31.92% | % over 200 EMA: 48.87%
Found buyers right where you'd expect at $584, the same area we've been chopping around since mid-October.
That bounce was off the 20-week zone but the midcaps have been the weakest part of the tape recently (weaker than the small caps).
Structure on the daily still isn’t inspiring. Lower highs, sloppy trend, and no real momentum sponsorship. It is hard to trust bounces when the asset keeps getting sold every time it peeks up.
The 20-week EMA has been the backbone of this uptrend since the rally accelerated in May of this year and we did defend it again which is very important for the sake of the intermediary trend.
How we handle it
Respect the level, but don’t romanticize it. A bounce here is possible and even logical but not yet earned by behavior.
If we see:
follow-through strength,
reclaim short-term MAs,
improving relative strength,
Until then, staying out is a position. We’re at support, but the burden of proof is squarely on buyers. This is where you wait for evidence to justify exposure.
Russell 2000
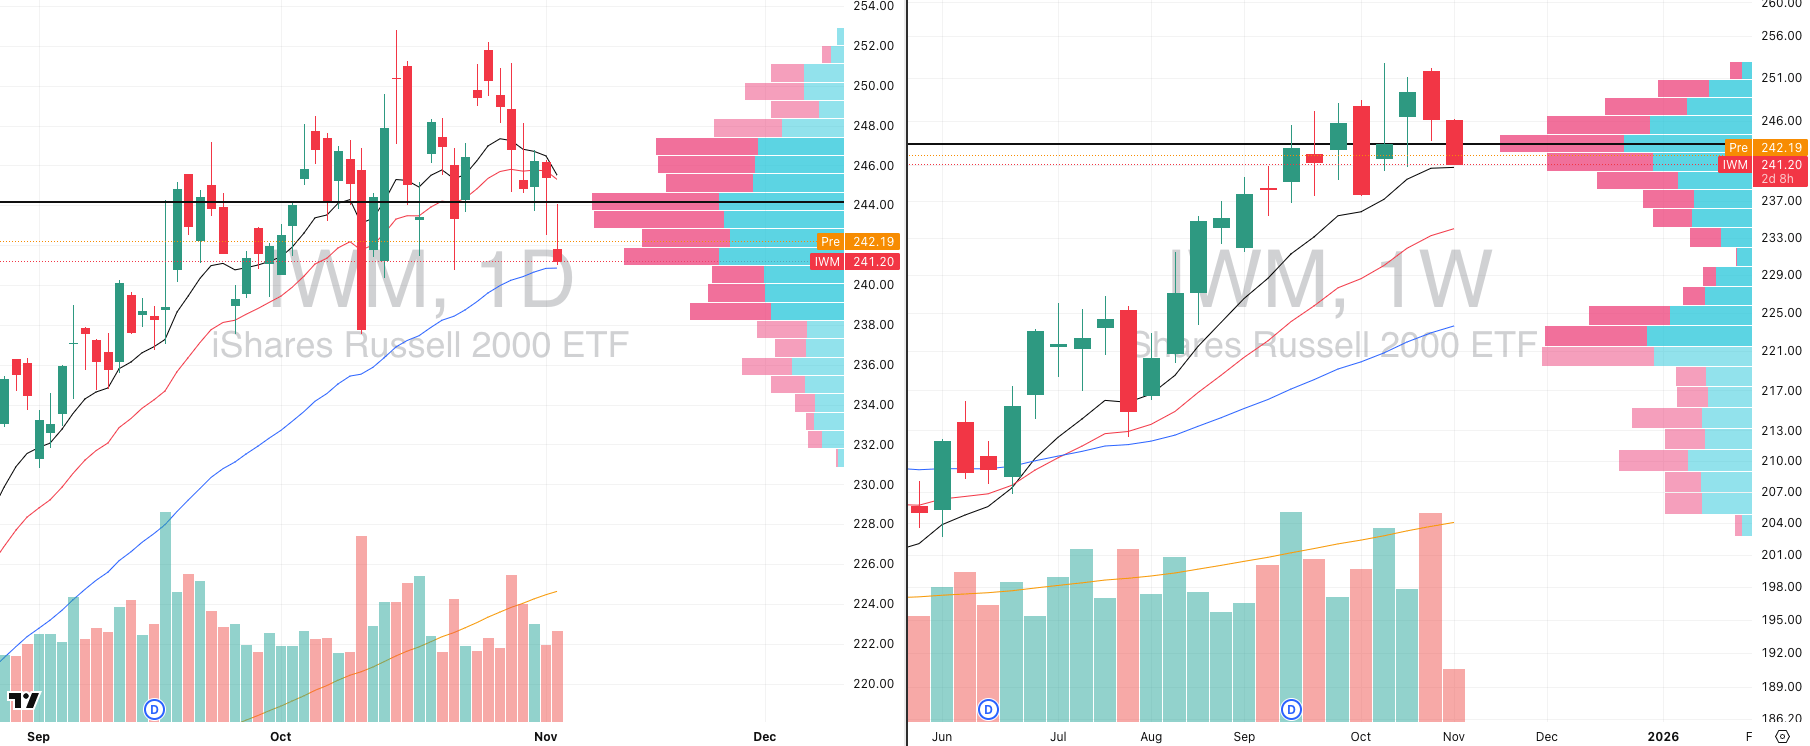
IWM VRVP Daily & Weekly Chart
% over 20 EMA: 33.02% | % over 50 EMA: 33.28% | % over 200 EMA: 51.86%
Tried to reclaim the 244 POC intraday and got slammed right back down with a failed reclaim on an inverted-hammer / gravestone look.
Volume came in light (~91% of 20-day avg), which tells you that was not aggressive selling, but still a clear rejection with little demand.
Sitting right on the 50-day EMA, with the 10-day already lost and price is hovering at a prior Nov–Dec ’24 supply shelf, now being tested as support.
In a vacuum, this is where you could see a bounce as this is a mean-reversion level, confluence of trend MAs, prior level but weak hands have been in control for days and this tape is punishing anticipation.
Testing the 10-week EMA on same zone that’s supported the trend since mid-year.
Structure still technically constructive, but the character isn't: each attempt to push higher is sold. Nothing structurally broken yet, but nothing that demands risk either.
Until IWM can reclaim short-term trend and prove demand, we stay patient. This market rewards discipline, not heroics.
Smart Investors Don’t Guess. They Read The Daily Upside.

Markets are moving faster than ever — but so is the noise. Between clickbait headlines, empty hot takes, and AI-fueled hype cycles, it’s harder than ever to separate what matters from what doesn’t.
That’s where The Daily Upside comes in. Written by former bankers and veteran journalists, it brings sharp, actionable insights on markets, business, and the economy — the stories that actually move money and shape decisions.
That’s why over 1 million readers, including CFOs, portfolio managers, and executives from Wall Street to Main Street, rely on The Daily Upside to cut through the noise.
No fluff. No filler. Just clarity that helps you stay ahead.
MINDSET CHECK
Take A Step Back & Observe
We’re not going to lie to you or sugarcoat it - this is a messy, highly volatile environment, and pretending otherwise doesn’t help anyone.
We want to be transparent about how we’re handling it: by stepping back, tightening risk, and waiting for cleaner setups to emerge.
There are no Focused Stock or Group sections today because there simply aren’t any that meet our criteria for high-probability follow-through.
When leadership is unclear and breadth is fragmented, the best trade is often no trade at all.
The single greatest advantage retail traders hold over institutions is freedom.
You don’t have to deploy capital. Hedge funds do as they’re obligated to meet quarterly benchmarks, justify mandates, and explain underperformance. You aren’t.
That autonomy is one of the most powerful alpha-generating edges in trading - the ability to not play when odds aren’t in your favor.
This is what’s known as dynamic risk modulation i.e. scaling exposure based on system performance rather than emotion.
When your process starts to underperform, your job isn’t to push harder; it’s to pull back and protect mental and financial capital.
How to Quantify When to Step Aside
Rather than trading on “feel,” track your system like a live market. You can use technical overlays on your own metrics to identify when conditions shift:
Dynamic Win Rate: When your 10- or 20-day EMA of win rate starts trending below its long-term average, that’s a quantitative signal your setups are degrading.
Equity Curve Momentum: When your cumulative equity curve breaks below its 10- or 20-day EMA, it’s the trading equivalent of price losing trend alignment and is a cue to reduce size, cut frequency, or step aside entirely.
Breadth Confirmation: If market breadth compresses simultaneously (fewer stocks making new highs, rising correlation), those weak internal signals reinforce the defensive bias.
These data-driven indicators create an objective risk thermostat and this can allow you to begin scaling exposure down when your system cools and ramping up when it reaccelerates.
Cash as Strategic Offense
In a 4% yield environment cash isn’t idle, it’s actually positive-carry optionality.
It earns while you wait, compounds quietly in the background, and grants instant strike power when conviction returns.
But beyond optionality, cash plays a deeper role in the mathematics of performance as it limits drawdowns, and by extension, protects your ability to compound.
Why Drawdown Control Is Everything
Every trader eventually learns the same truth: returns are multiplicative, not additive, and that means the path matters far more than the headline result.
If you’re down 25%, you need +33% to recover. Down 50%, you need +100%.
Every additional drawdown compounds against you geometrically, slowing recovery and eroding psychological capital.
The best traders in the world don’t just optimize for return, they also optimize for consistency and drawdown depth.
If you can halve your maximum drawdown while maintaining 70–80% of your upside, your long-term CAGR (compound annual growth rate) will be significantly higher than a trader who swings for every move.
Did you find value in today's publication?This helps us better design our content for our readers |
Reply