- Swingly
- Posts
- The Next Breakout Wave: Biotech & Nuclear Leading
The Next Breakout Wave: Biotech & Nuclear Leading
OVERVIEW
What You Need To Know
Macro: No fresh catalysts until Friday’s jobs report. Yields elevated (10Y ~4.3%, 30Y ~5%) but equities holding trend. Rotation (Value > Growth) driving flows.
Nasdaq: QQQ defended 50-EMA ($564) on high volume, retest of $570–573 supply zone ahead. Still H&S risk. Today’s pop = GOOG-driven. QQQE broke neckline + 50-EMA, confirming weak breadth.
Midcaps (MDY): Demand held $587 (20-EMA + POC). Structure strong, but fewer fresh setups. Focus on managing winners + pullbacks.
Small Caps (IWM): Textbook gap-fill long worked. Defended 10-EMA, cleared ORH ~$232.40, filled to $234. Short-term strength remains tactical.
Focused Stock (SMR): High-volume reversal into $34–39 cluster. Testing $37–39 EMAs. Above $40 = room to $44–45. Nuclear theme intact.
Focused Group (XBI): Biotech broke out $91–92 on strong volume. Thin VRVP pocket opens path to $97–100. Support $91.

MARKET ANALYSIS
All Eyes on Jobs + Yields

There isn’t a new macro catalyst driving markets right now — which in itself is telling. Yields continue to hover near key inflection levels (10Y ~4.3%, 30Y pressing toward 5%), but so far equities have absorbed the pressure without breaking trend. That’s notable because earlier in the year, every push higher in yields triggered sharper risk-off flows.
Friday’s jobs report will be the next real event risk. Markets are pricing a September Fed cut at ~90% odds, so labor data either validates or challenges that expectation. Until then, macro is less about fresh headlines and more about how equities digest elevated rates.
The bigger takeaway: flows are being dictated more by sector rotation than macro shock. Value-heavy groups (Financials, Energy, Industrials, Metals, Healthcare) are absorbing capital, while crowded Growth/Tech exposure is still unwinding at the margin.
Nasdaq
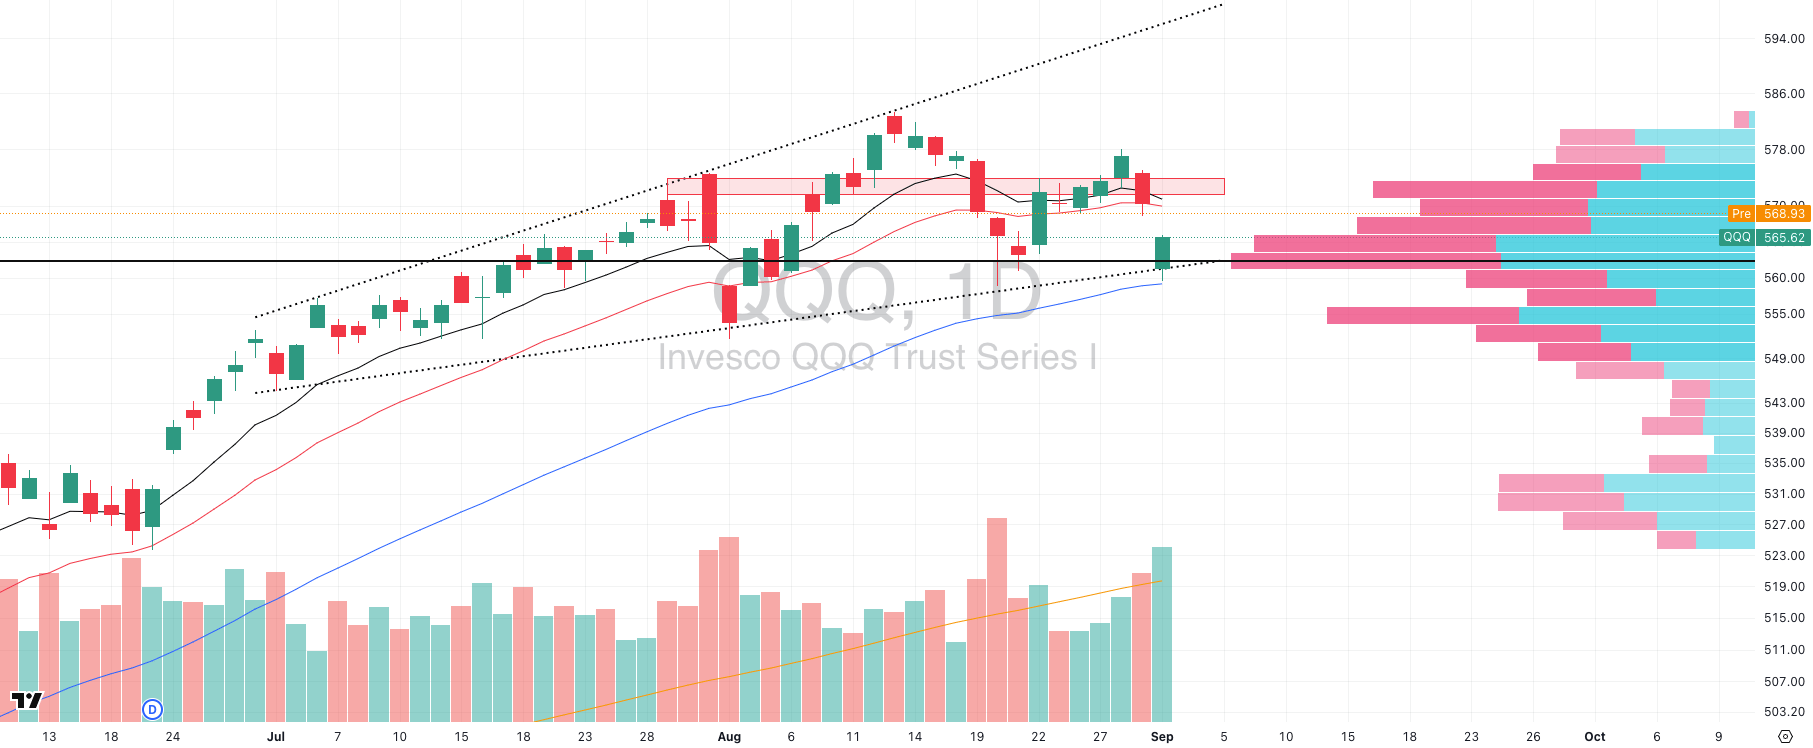
QQQ VRVP Daily Chart
% over 20 EMA: 36.63% | % over 50 EMA: 40.59% | % over 200 EMA: 56.43%
Yesterday gave us a clear split between the cap-weighted QQQ and the equal-weighted QQQE, showing exactly how much the index is leaning on a handful of megacaps.
QQQ (Cap-Weighted)
Price defended the 50-day EMA (~$564) with authority yesterday. Importantly, this defense came on elevated relative volume, which adds credibility to the bounce.
That puts us back on track for a retest of the red-box supply zone at $570–$573, the same zone that has rejected every rally since late July.
Structurally, QQQ is still carrying the head-and-shoulders topping formation, with the neckline sitting around $563. Yesterday’s defense keeps the pattern intact but unconfirmed — only a decisive close under $560 (50 day EMA) would trigger it.
Today’s gap higher is almost entirely a GOOG-driven distortion after the antitrust ruling. Given GOOG is nearly 10% of QQQ, this pop is not representative of broader Nasdaq strength. Without confirmation from breadth, any upside follow-through should be treated with caution.
QQQE (Equal-Weight)
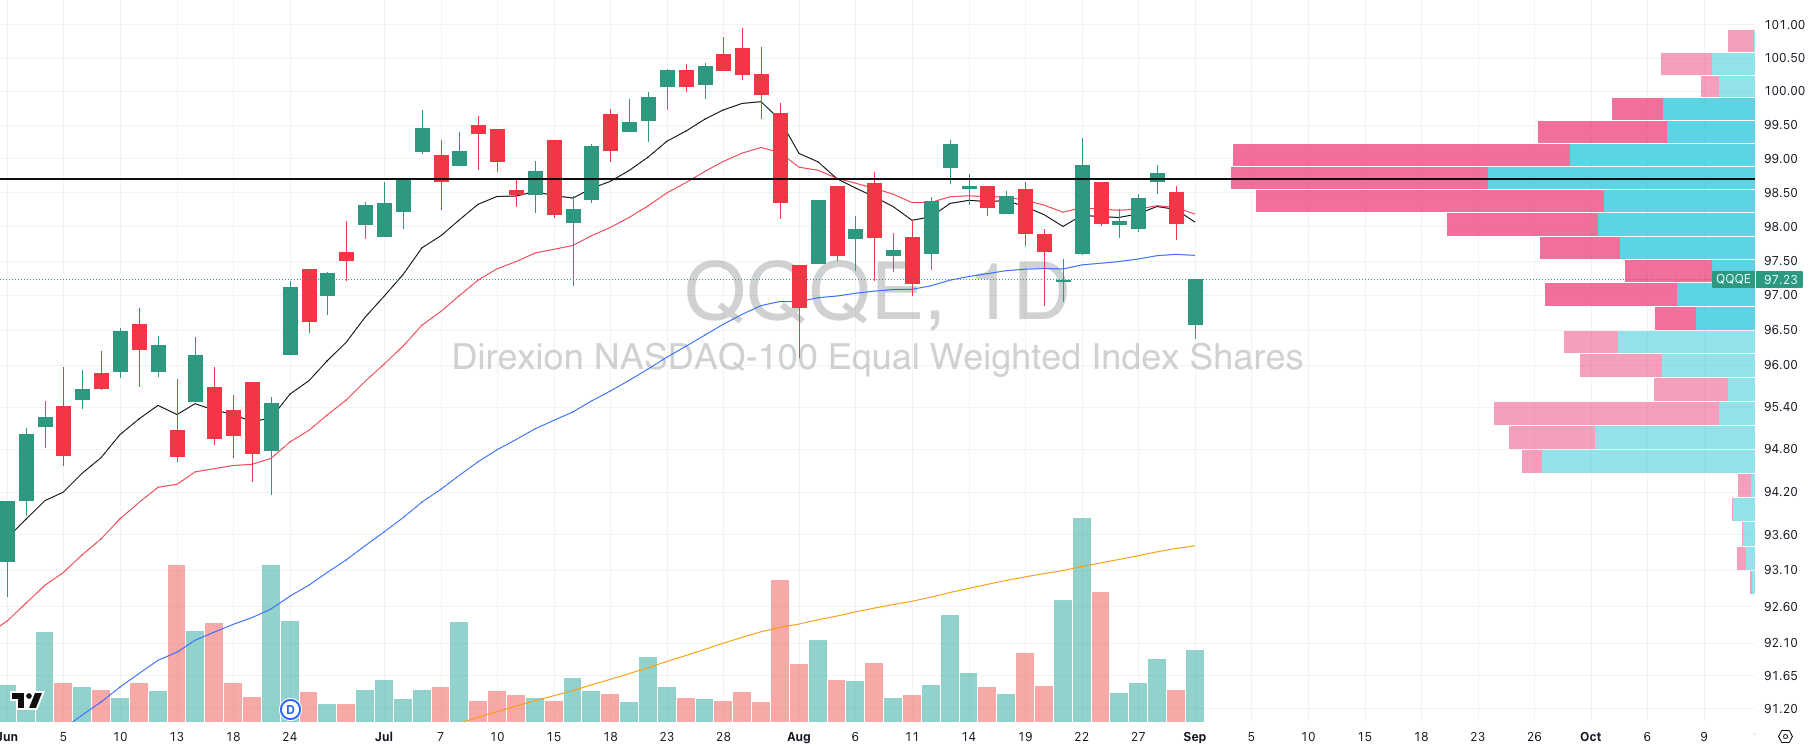
QQQE VRVP Daily Chart
In contrast, QQQE broke down yesterday. The index sliced through its 50-day EMA (~$97.40) and closed below it.
More importantly, this confirms the neckline break of the head-and-shoulders top we flagged yesterday, with the neckline at $97.60–$97.80 now turning into resistance.
Next demand shelf sits around $95.50–$96.00, where the VRVP shows a dense volume node.
Unless participation broaden and we see demand really step up, the megacap tech rally will likely resolve in a breakdown below the 50-EMA which would be a solid short play.
S&P 400 Midcap
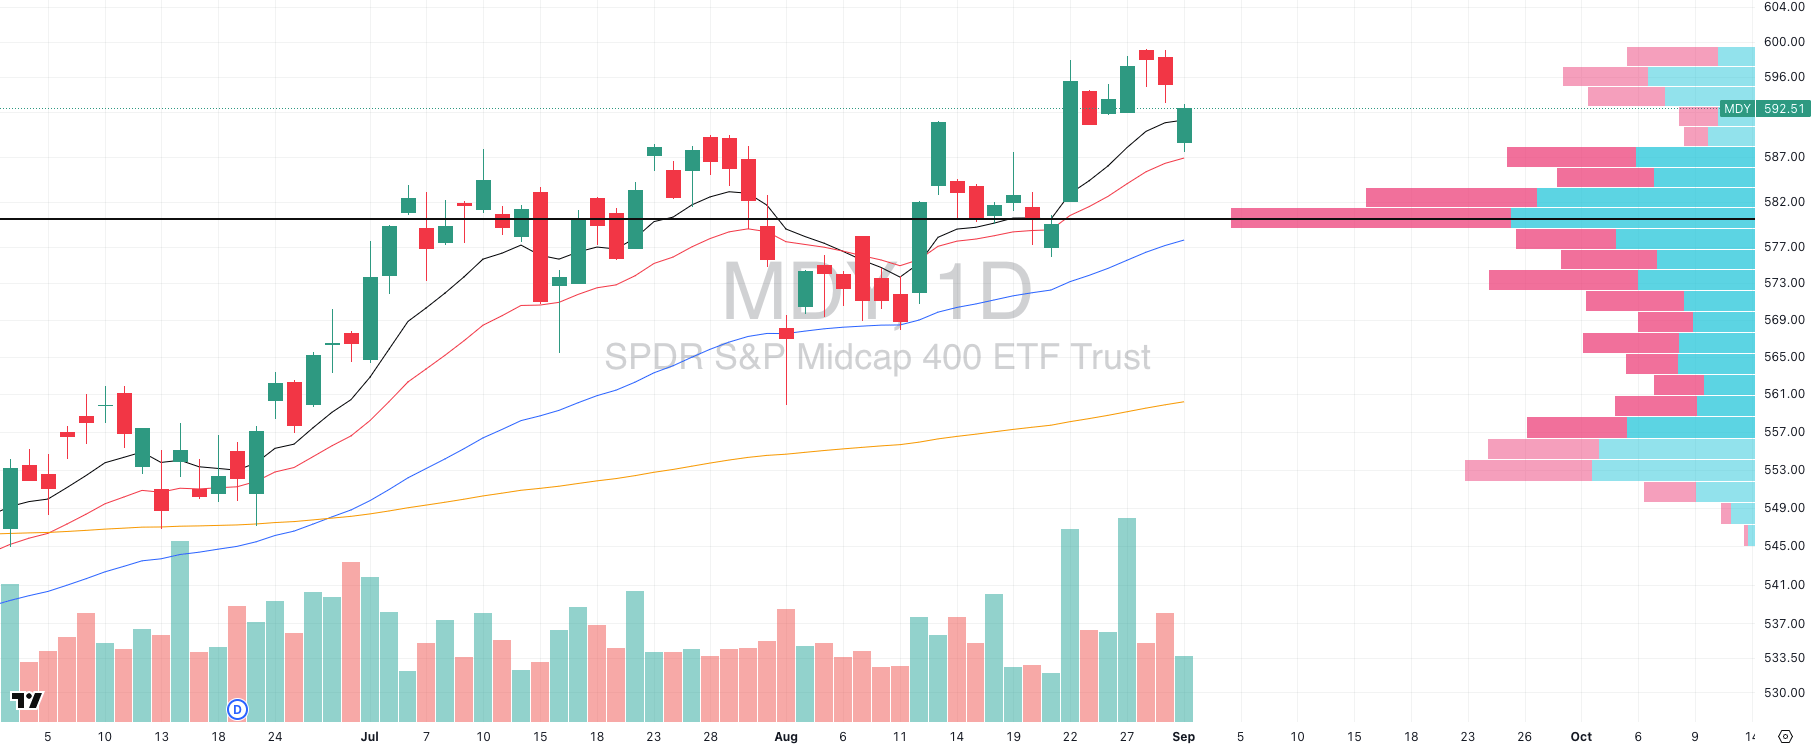
MDY VRVP Daily Chart
% over 20 EMA: 64.00% | % over 50 EMA: 63.00% | % over 200 EMA: 60.25%
Midcaps once again showed their structural strength yesterday, even though the bounce came on lower relative volume compared to large caps. Price pulled back directly into the 20-day EMA (~$587), which we highlighted yesterday as a pivotal level because it aligns with the highest-volume node on the VRVP cluster ($586–$588).
That test played out almost perfectly: intraday demand defended the zone, producing a clean reversal that validated the bounce-long setup we discussed. This confirms that institutions are still anchoring risk at this level and absorbing supply.
That said, the opportunity set for new naked trend-following entries within midcaps is thinning out. Many names have already broken out in prior weeks, and fresh setups are less abundant.
The playbook here is more about managing existing winners and buying controlled pullbacks into support, rather than aggressively chasing new breakouts.
Russell 2000
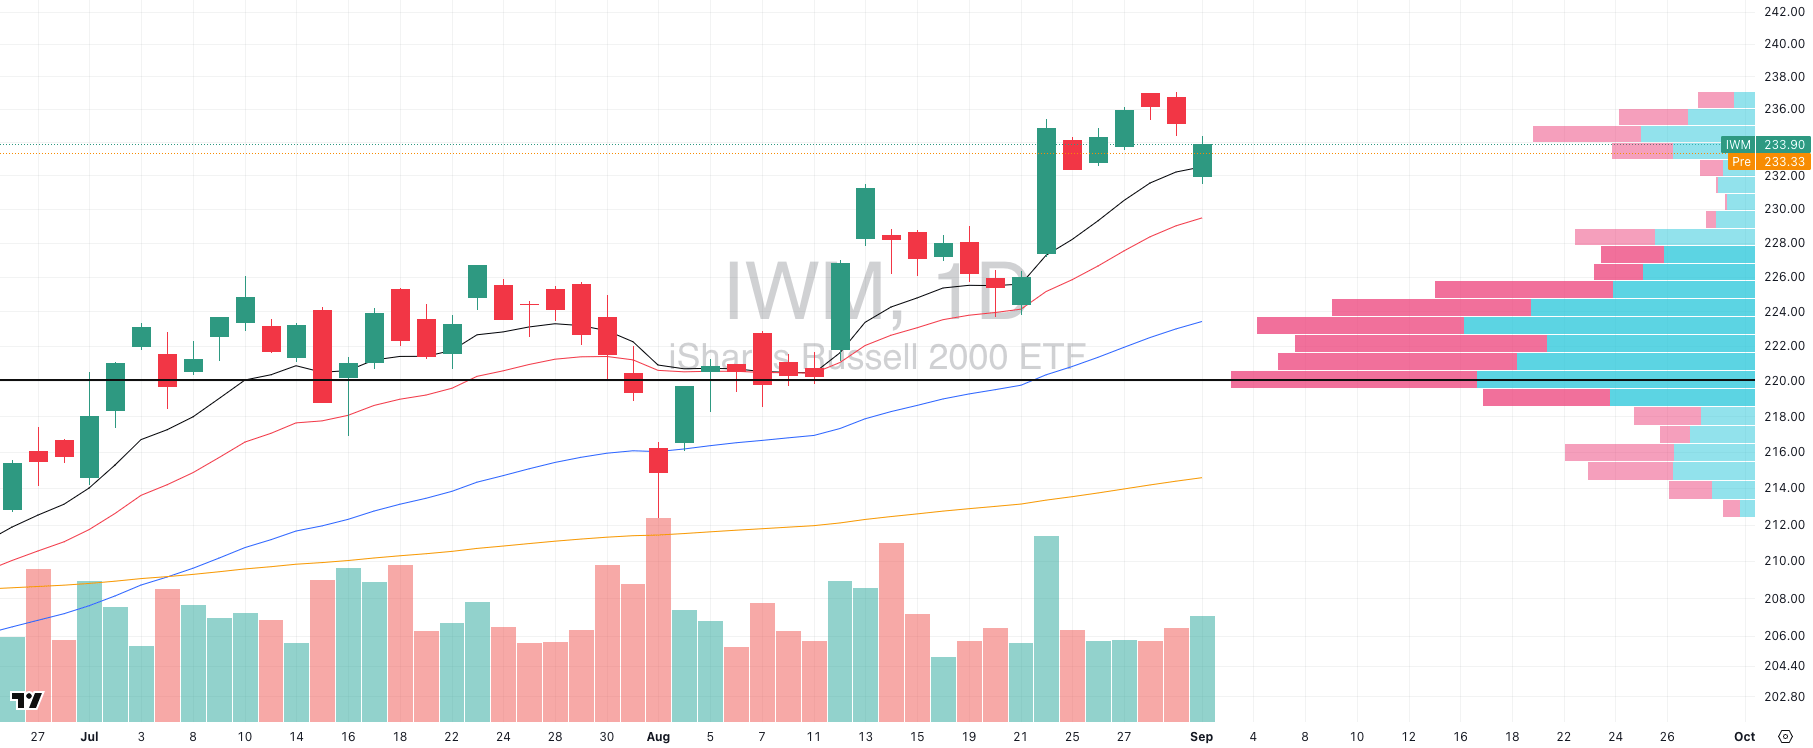
% over 20 EMA: 70.18% | % over 50 EMA: 67.02% | % over 200 EMA: 59.07%
IWM showed strong relative performance yesterday, with a textbook intraday recovery after the gap down. On the daily chart, price tested the 10-EMA on the open and immediately attracted demand.
That dynamic defense turned into a clean gap-fill rally, with IWM closing back near $234 with a very strong response compared to other indices.
This was the exact setup we outlined in yesterday’s report: a short-term gap play off the open. The structure worked almost perfectly. The execution framework was straightforward:
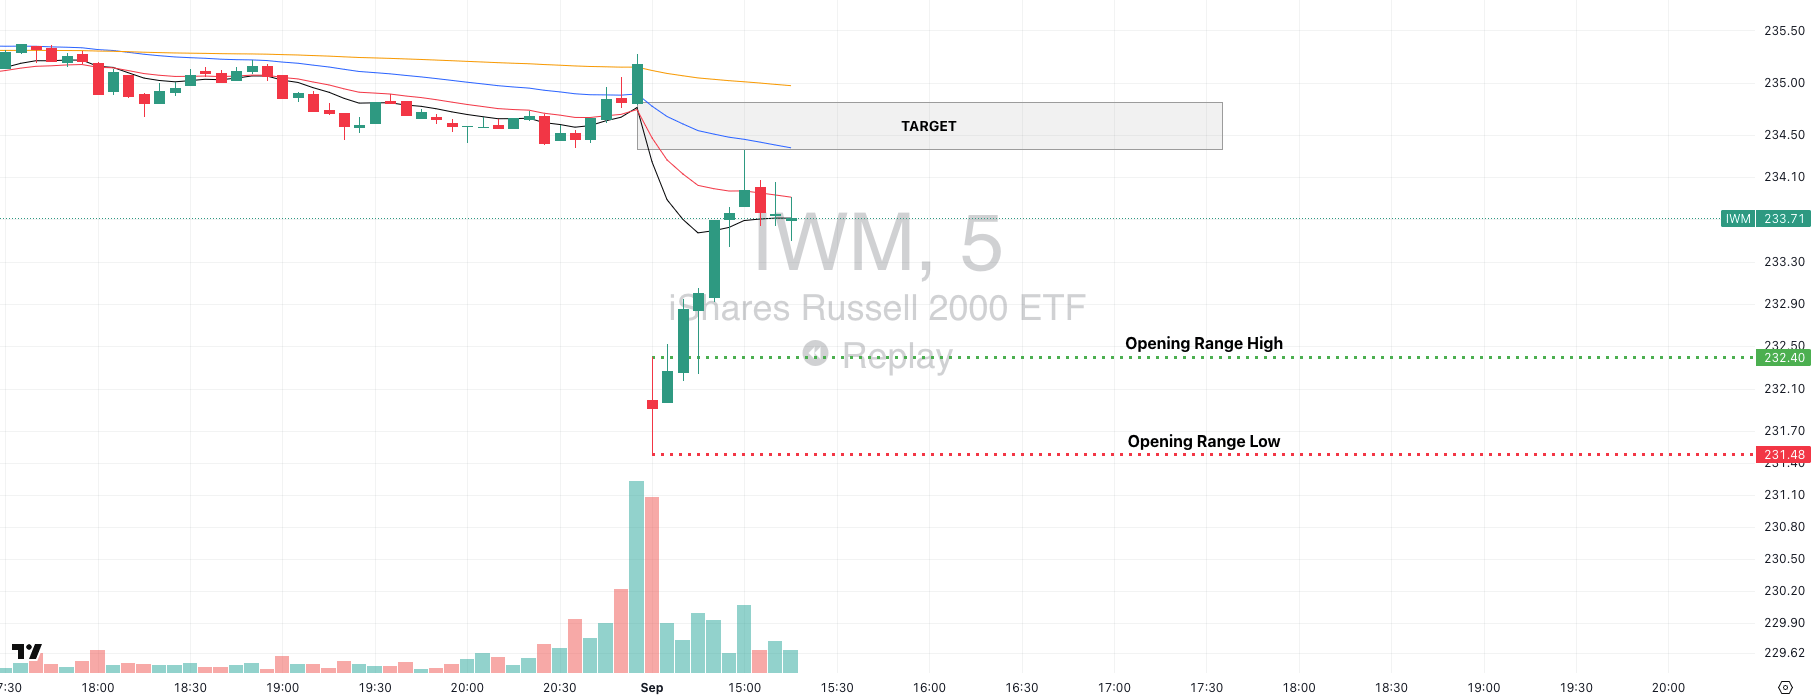
IWM Gap Fill Intraday Play
Step 1: Wait for the first 5-minute candle to establish the opening range.
Step 2: Enter long once price clears the opening range high (yesterday that was ~$232.40).
Step 3: Place the stop just under the breakout candle’s low (~$231.50 in this case).
Step 4: Target the gap-fill zone (~$234), with short-term moving averages (10- and 20-EMA) as additional reference guides for scaling out.
This play worked cleanly because the demand response aligned with both the broader structural trend and the high-probability nature of gap-fills when supply is absorbed quickly.
It’s important to emphasize that these are short-term tactical trades and so you need to respect stops and targets, because once the gap is filled, risk/reward deteriorates quickly and the entire trade unwinds.
FOCUSED STOCK
SMR: Nuclear Technology Gaining Traction
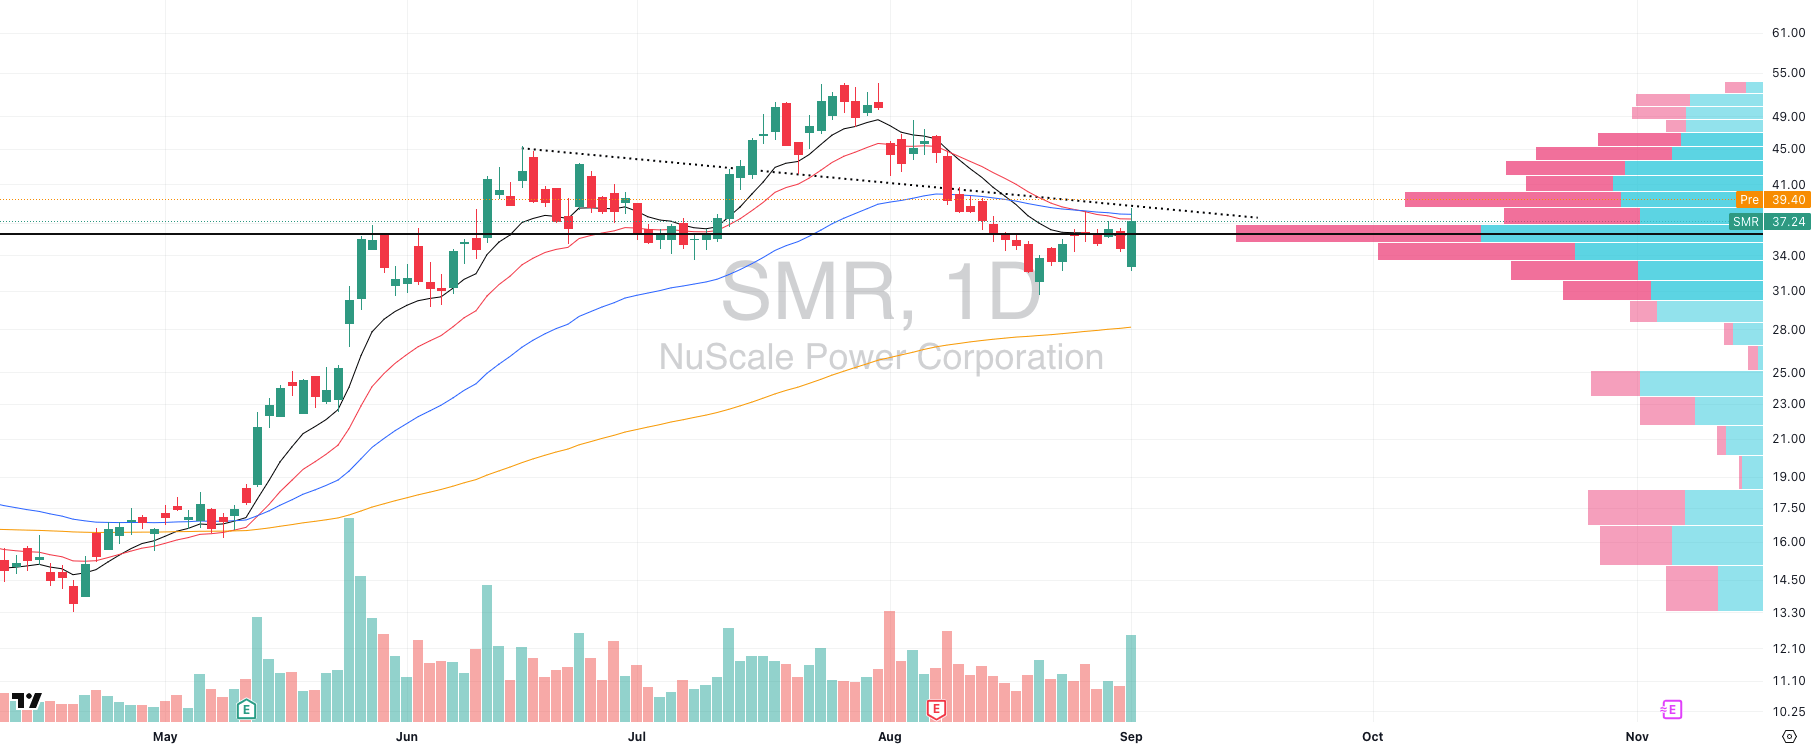
SMR VRVP Daily Chart
ADR%: 8.03% | Off 52-week high: -30.4% | Above 52-week low: +441.3%
SMR is carving out a potential inflection point after a corrective phase. The nuclear energy theme remains strong with URA holding trend, and SMR’s high relative volume reversal yesterday adds weight to the setup.
Yesterday’s gap down was immediately absorbed and filled on exceptionally high relative volume, signaling demand at lower prices. Price closed back inside the key VRVP volume cluster between $34–39, an area that has acted as both support and resistance throughout the summer.
Price is now retesting the declining 10- and 20-day EMA cluster (~$37–38). Reclaiming this zone would be the first technical confirmation of momentum shifting. The 50-day EMA (~$39.50) sits just above, aligned with the upper edge of the VRVP node, making this a critical battleground.
The level to watch for a breakout is $40 as if this breaks with volume, upside opens to $44–45, which was the early August breakdown zone.
FOCUSED GROUP
XBI: Second Wave Healthcare Breakout
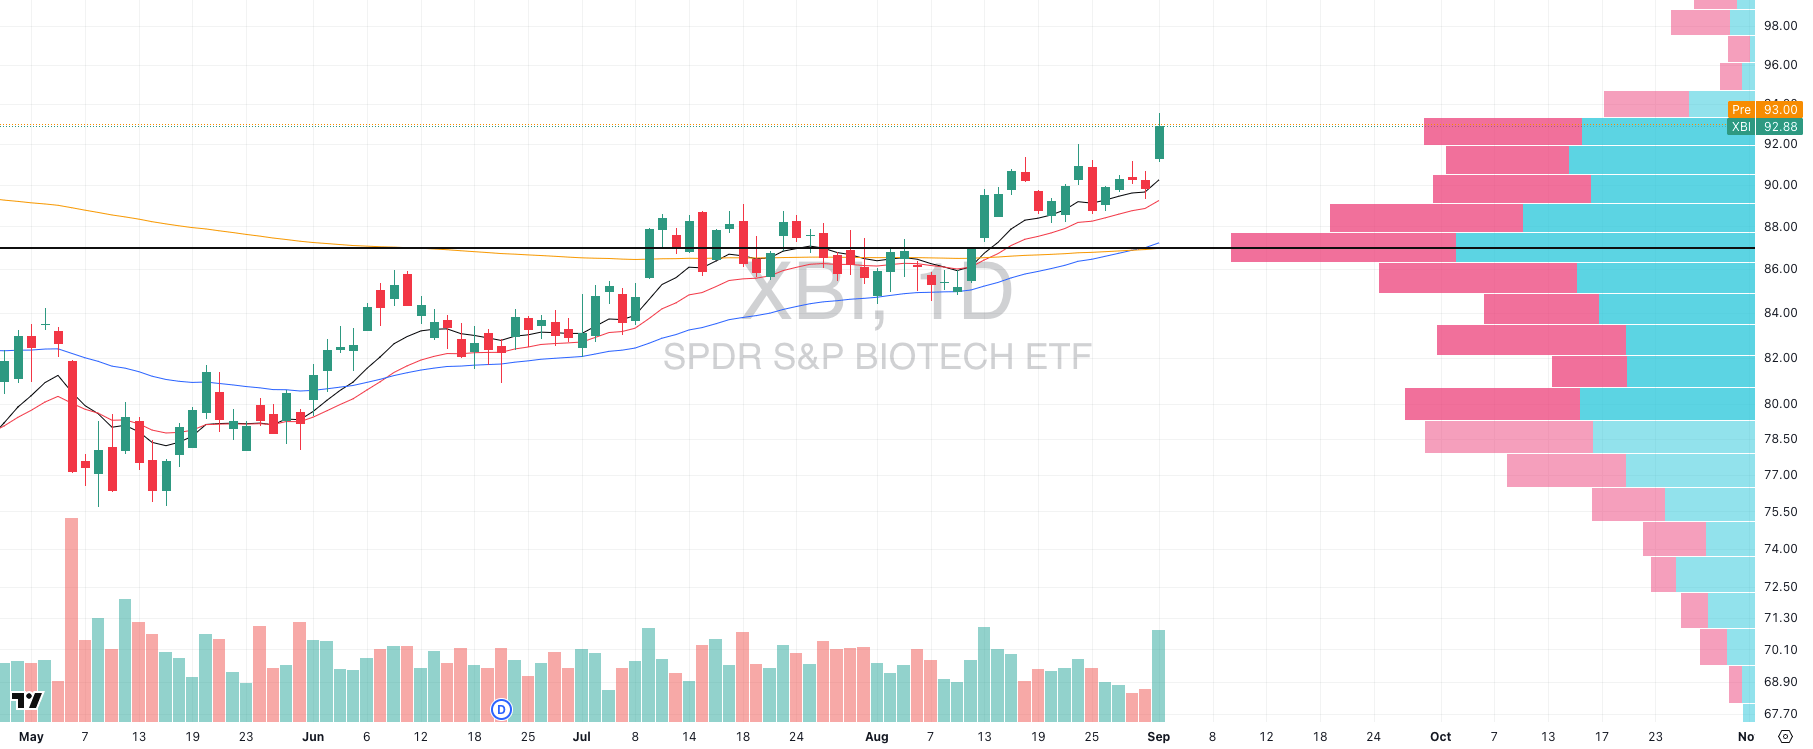
XBI VRVP Daily Chart
Healthcare as a sector has quietly emerged as a market leader. XPH (pharma) continues to act as the strongest sub-group, while XLV (broad healthcare) and XES (healthcare services) are also holding trend.
Yesterday, however, the spotlight shifted decisively to biotech (XBI) with a clean, high relative volume breakout through the $91–92 zone.
The move was sharp, linear, and fueled by real demand, not a choppy grind. This breakout carried conviction, with volume expanding well above recent averages.
Price cleared a multi-week consolidation base, breaking through both the 20- and 50-day EMAs, and now sits just under a thin-volume pocket on the VRVP between $93–97. This creates room for efficient price discovery higher if momentum continues.
The levels to watch:
Immediate support: $91 (prior breakout zone).
Resistance: $97–98 (upper end of VRVP pocket).
Above that, $100 is psychological and structural resistance.

Did you find value in today's publication?This helps us better design our content for our readers |
Reply