- Swingly
- Posts
- The Market Is Rotating- Be Very Careful
The Market Is Rotating- Be Very Careful
In partnership with

OVERVIEW
When Markets Rotate, Rotate With Them
Growth cracks, defensives bid: Yesterday’s session saw high-beta sectors (tech, discretionary) break down on rising volume while staples and utilities rotated higher — a classic late-trend behavior.
Fed minutes today (2 p.m. ET): July meeting showed first double dissent since 1993 (Waller & Bowman opposed the pause). Markets will dissect tone for signs of deeper division.
Powell Friday at Jackson Hole: Futures already price ~85% probability of a September cut. Whether Powell validates or pushes back will set the tone for risk.
Indices diverging:
QQQ: Breakdown on heavy volume into $570 (20-EMA). Short squeezes possible, but trend-longs remain low probability.
MDY: Repeated distribution → key watch is $580 EMA cluster. Breakdown targets $571.
IWM: Outperforming with $226 flipping from resistance → support. Remains best-in-class if it holds.
Leadership shift: Metals (KGC, GDX) consolidating at demand while growth cracks. Defensives (XLP) are 0.7% from a 6-month base breakout.

MARKET ANALYSIS
This Is Not The Time To Get Aggressive…

Yesterday’s session underscored a clear rotation: growth and high-beta sectors cracked, while defensive groups like staples and utilities found steady bids. This kind of behavior is typical late in a trend when capital starts prioritizing stability over momentum.
The real catalyst on deck is macro:
Fed minutes (July) drop today at 2 p.m. ET. While the Fed held rates steady at that meeting, the detail that matters is dissent — Governors Waller and Bowman voted against the pause. That’s the first double dissent since 1993, highlighting a real split within the committee.
Powell speaks Friday at Jackson Hole. Markets are hyper-focused on whether he validates the dovish tilt priced into futures.
As of this morning, Fed funds futures imply an ~85% probability of a September cut. The market has already front-run the move, but Powell’s tone will dictate whether this becomes an all-clear for risk or a sell-the-news event.
Nasdaq
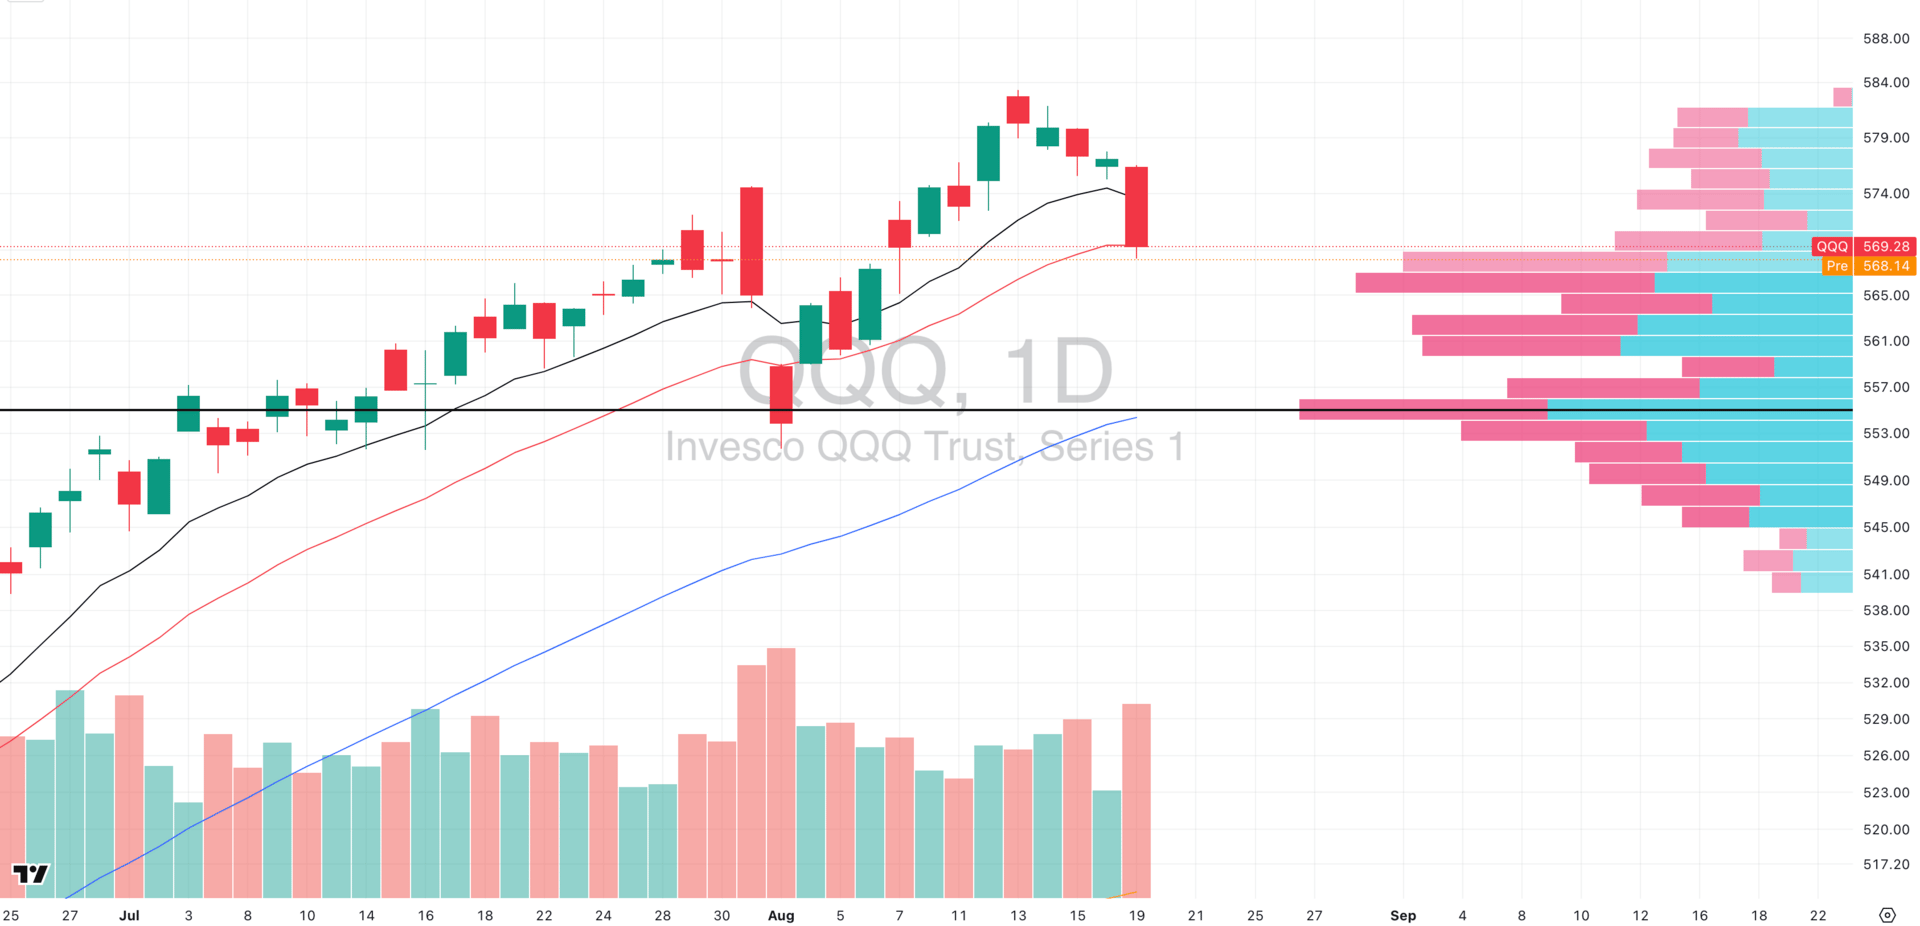
QQQ VRVP Daily Chart
% over 20 EMA: 47.52% | % over 50 EMA: 49.50% | % over 200 EMA: 62.37%
The QQQ broke down yesterday on very high relative volume, pressing directly into the dense supply zone around its 20-EMA near $570.
What matters here isn’t just price — it’s the volume profile. Over the past week, as QQQ has pushed lower, relative volume has steadily increased, confirming that there’s real conviction behind the selloff. This isn’t just light summer chop — sellers are actively leaning on the tape.
⚠️ Trading Implications:
Short side caution → While the breakdown has fuel, chasing shorts here is risky with the 20-EMA acting as immediate support. A bounce from this level could easily unwind short exposure.
Long side caution → Quick mean-reversion bounces may work intraday, but trend-following longs are low-probability until breadth expands and demand proves it can sustain above resistance.
➡️ Bottom line: The QQQ is in a dangerous no-man’s land — squeezed between growing downside momentum and short-term support. This is not an environment for high conviction trades.
S&P 400 Midcap
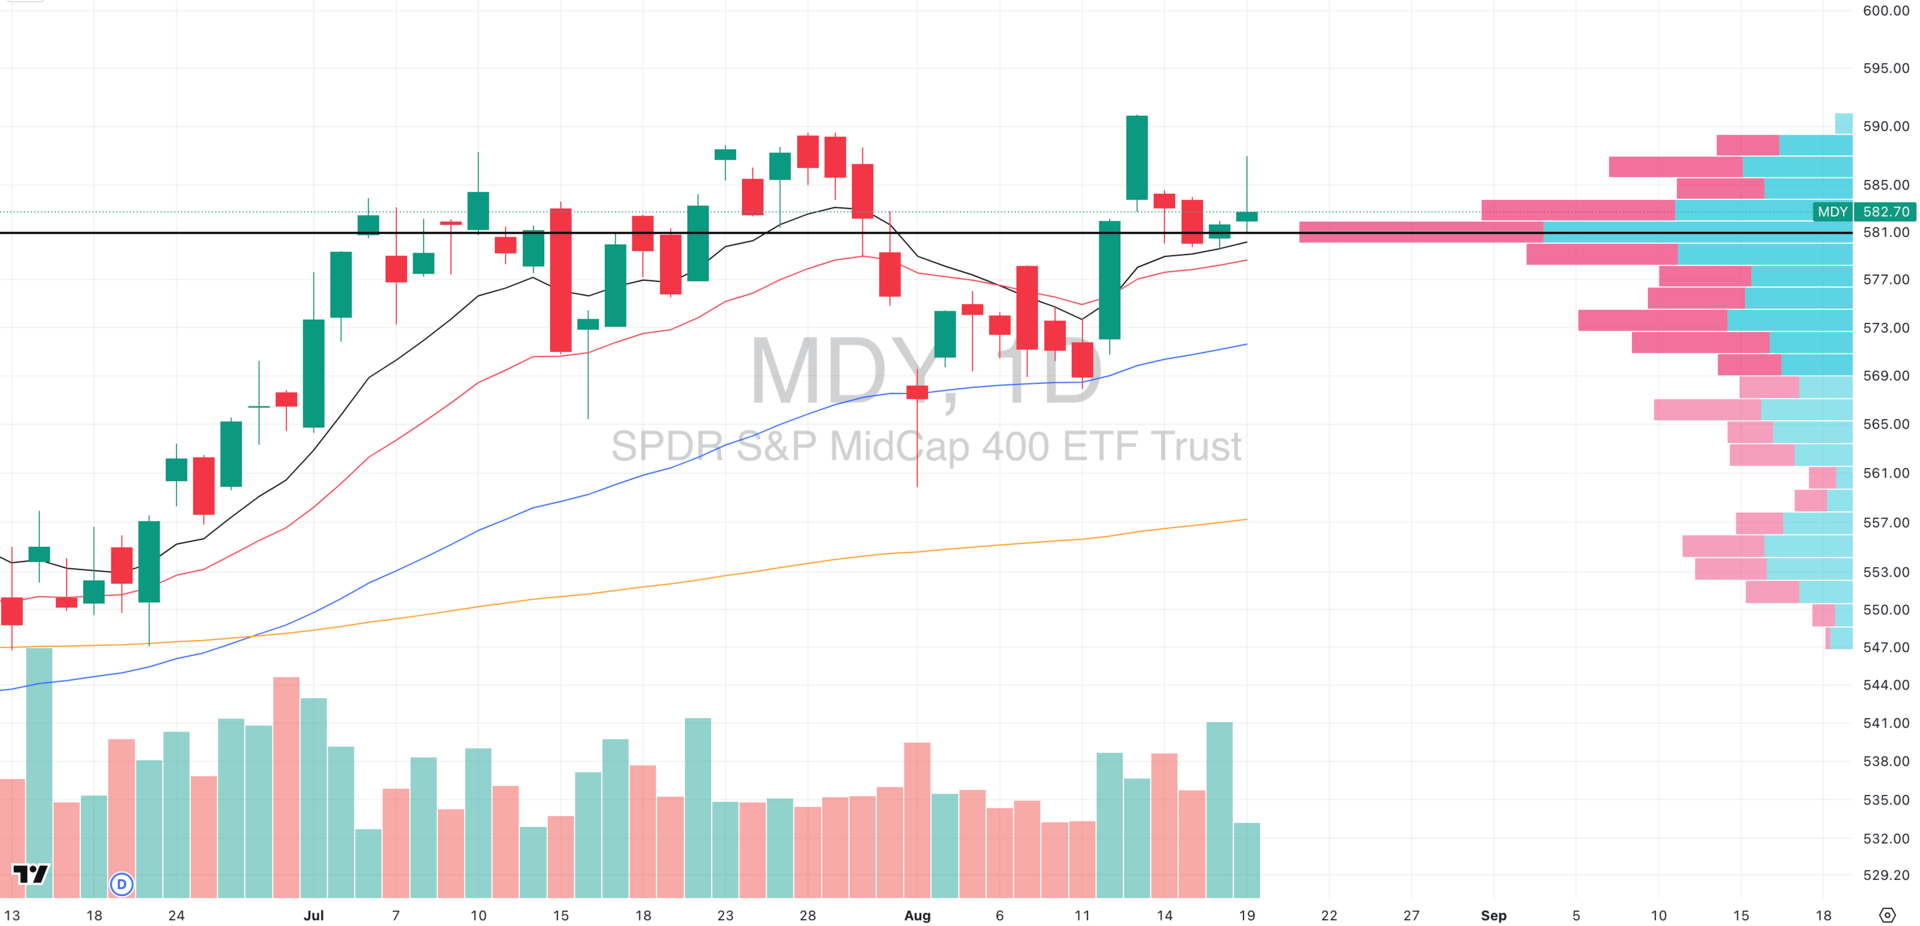
MDY VRVP Daily Chart
% over 20 EMA: 61.50% | % over 50 EMA: 62.25% | % over 200 EMA: 54.75%
Midcaps were faded hard yesterday, though notably on low relative volume. Still, the bigger issue isn’t just one session — it’s the consistent failure to make new relative highs over the past 1–2 months, which signals distribution rather than healthy consolidation. Cracks are beginning to show.
From a risk perspective, the read here aligns with the Nasdaq: this is not a tape to be aggressive in. Capital deployment carries asymmetric downside when breadth is this weak.
⚠️ Key Level: The only valid setup we see is a breakdown through the rising 10/20-EMA cluster around $580 (a VRVP node).
If that fails on strong relative volume, it opens the door for a momentum burst short into the rising 50-EMA, sitting roughly -1.45% lower near $571.
➡️ Bottom line: Midcaps are showing distribution, not accumulation. Unless demand reasserts quickly, risk is skewed to the downside.
Russell 2000
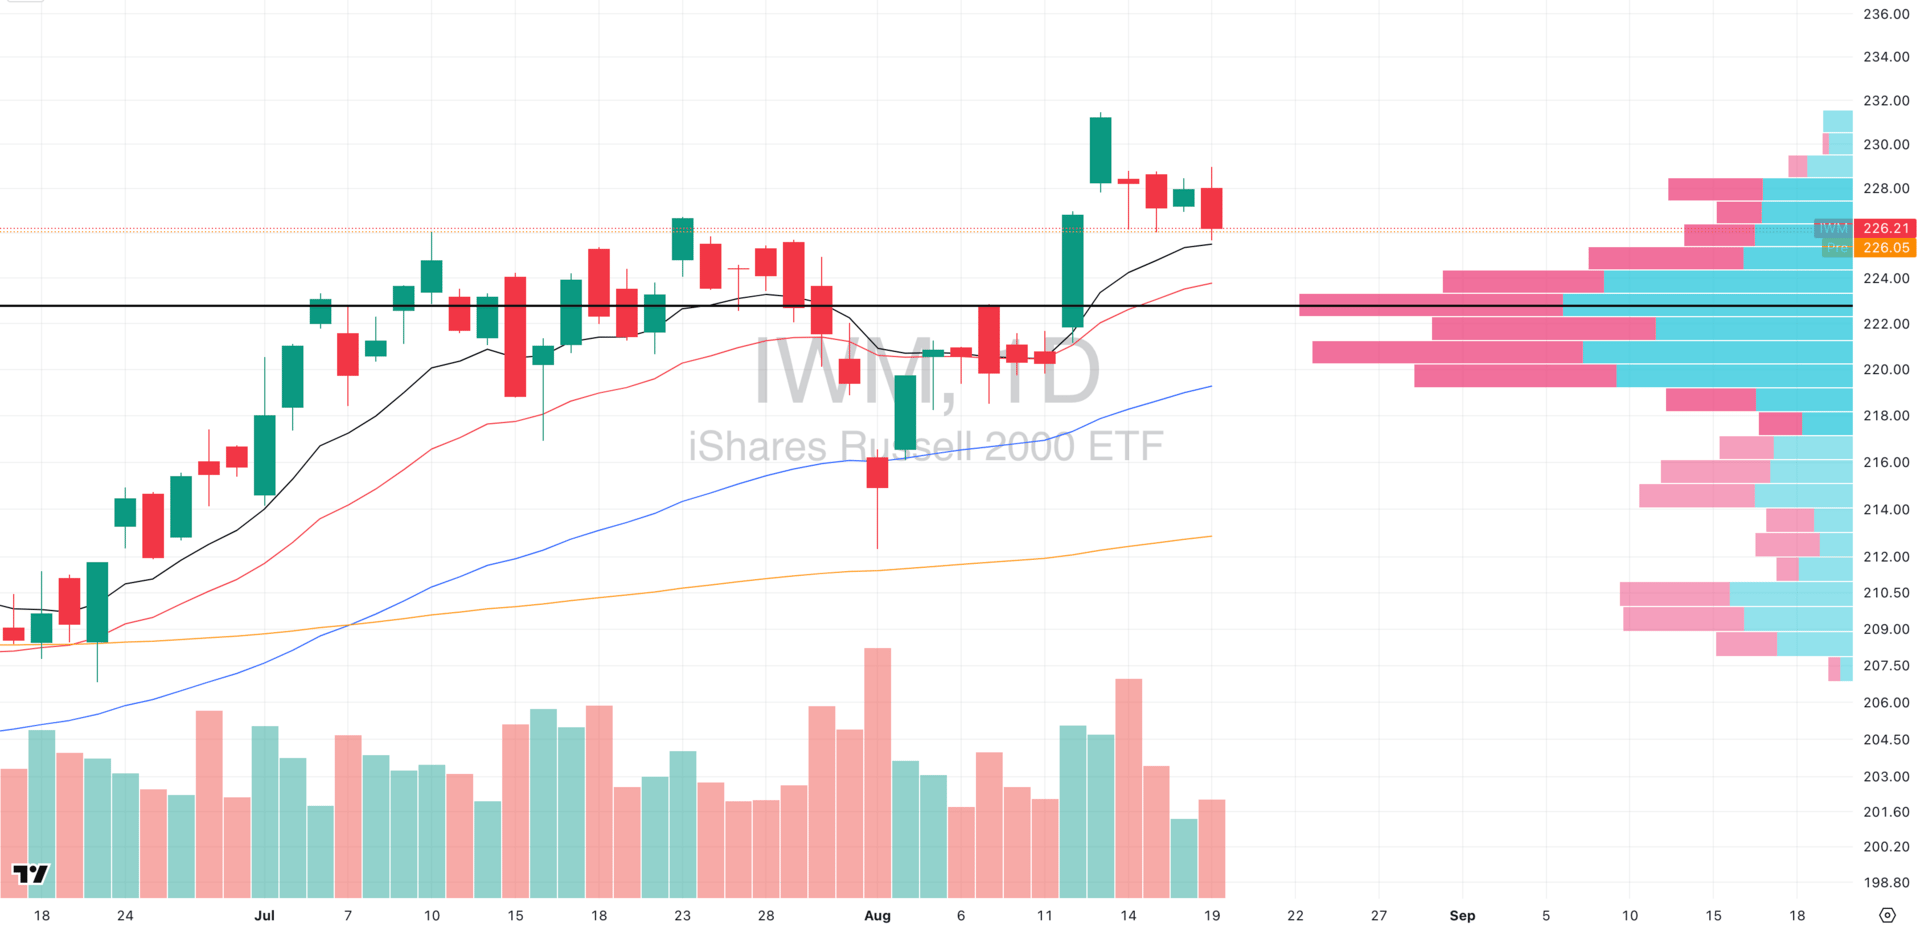
IWM VRVP Daily Chart
% over 20 EMA: 52.18% | % over 50 EMA: 57.42% | % over 200 EMA: 58.95%
Small caps continue to outperform relative to both QQQ and MDY, with repeated demand stepping in at the $226–227 zone, right along the rising 10-EMA. Structurally, this is the most constructive capitalization group in the market.
The significance of $226 cannot be overstated: it was a major resistance ceiling throughout July 2025, and the recent ability to flip it into support marks a meaningful change in character. Short-term chop and consolidation above this zone is not only normal but healthy price action.
That said, we temper enthusiasm. Broader leadership — particularly in high-beta growth — remains under pressure, which caps how far small caps can run on their own.
📌 Macro Tailwind: Small caps are the most sensitive to interest-rate policy. With Fed funds futures now pricing an ~85% chance of a September rate cut, IWM stands to benefit disproportionately, as lower borrowing costs flow directly into the balance sheets of smaller businesses.
2025: The Year of the One-Card Wallet

When an entire team of financial analysts and credit card experts go to bat for the credit card they actually use, you should listen.
This card recommended by Motley Fool Money offers:
0% intro APR on purchases and balance transfers until nearly 2027
Up to 5% cash back at places you actually shop
A lucrative sign-up bonus
All for no annual fee. Don't wait to get the card Motley Fool Money (and everyone else) can't stop talking about.
FOCUSED STOCK
KGC: Leading Stock in a Leading Group
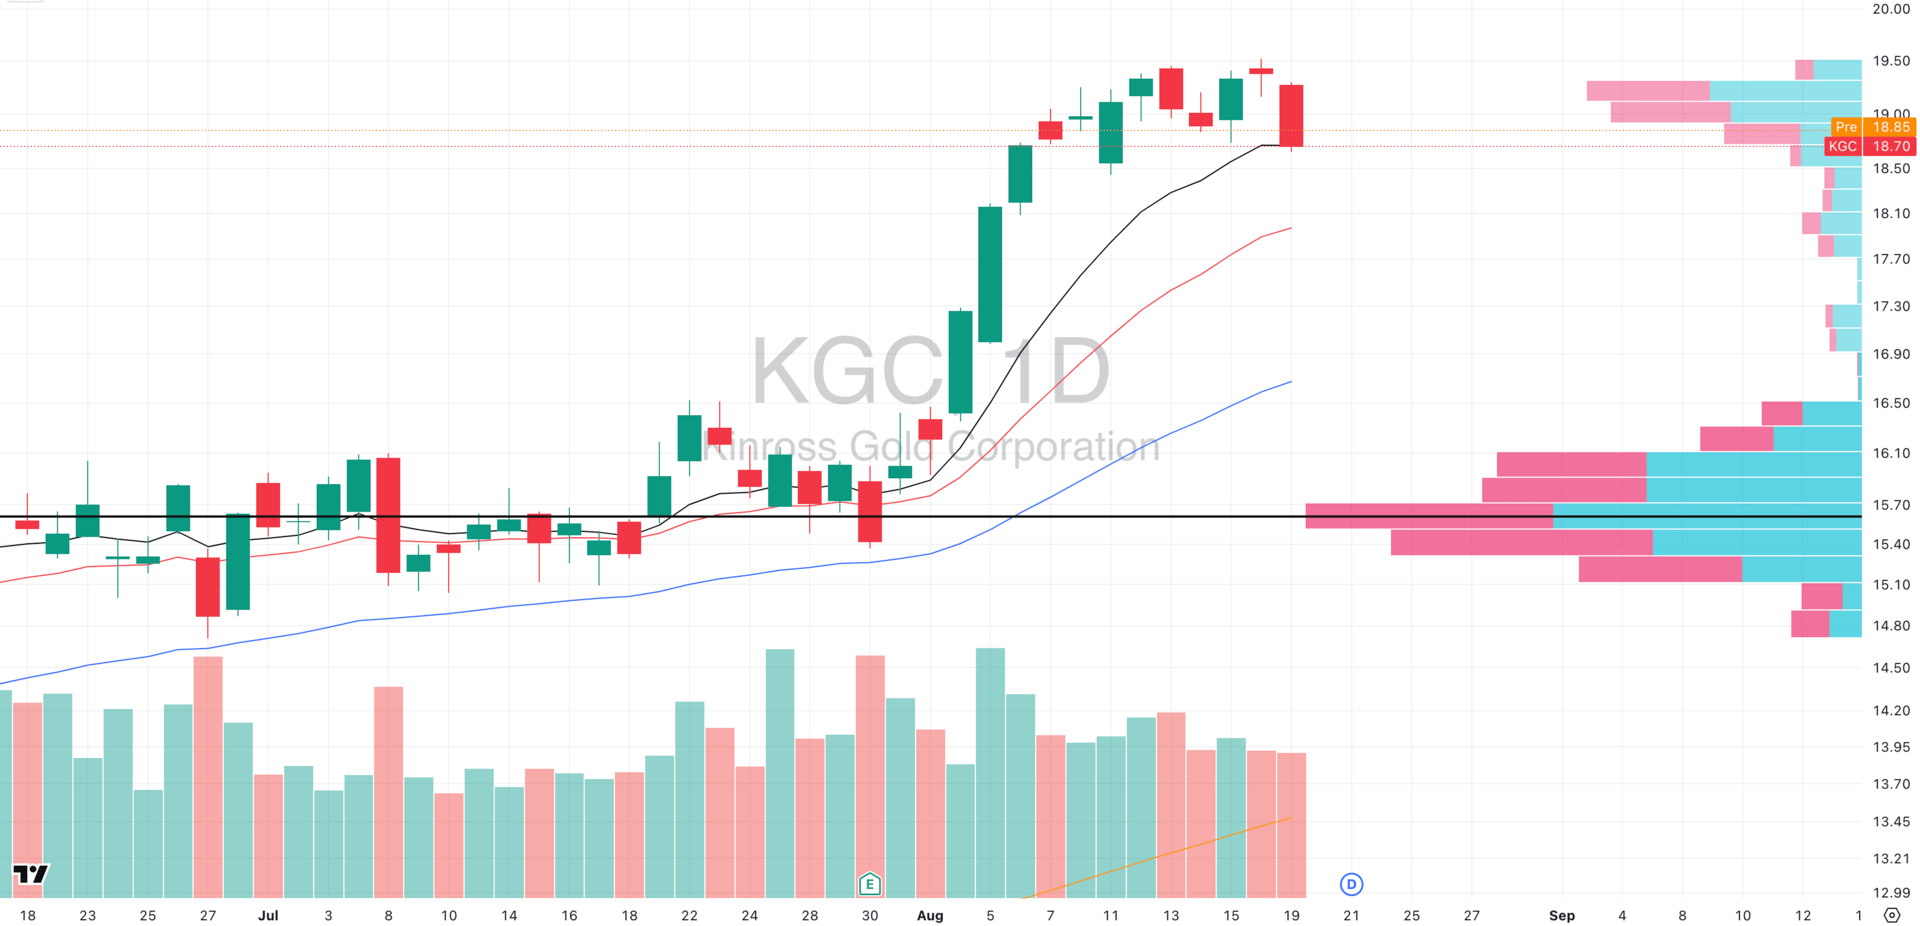
KGC VRVP Daily Chart
ADR%: 3.30% | Off 52-week high: -3.9% | Above 52-week low: +126.8%
As high-beta sectors continue to unwind — something we’ve been flagging for nearly two weeks via deteriorating breadth and collapsing follow-through — precious metals are emerging as relative strength leaders.
Within that theme, KGC is offering a clean pullback setup:
Technical Setup
Pulled back yesterday into the rising 10-EMA (~$18.65).
The test occurred on muted relative volume, suggesting controlled digestion rather than distribution.
Broad-based strength across metals and miners reinforces the likelihood of demand stepping in here.
Trade Context
We view this as a high-probability pullback long, provided buyers confirm demand.
Execution focus: use intraday timeframes (5–15min) to identify bullish engulfing candles or similar reversal signals aligning with the 10-EMA defense.
FOCUSED GROUP
XLP: Defensives On The Rise
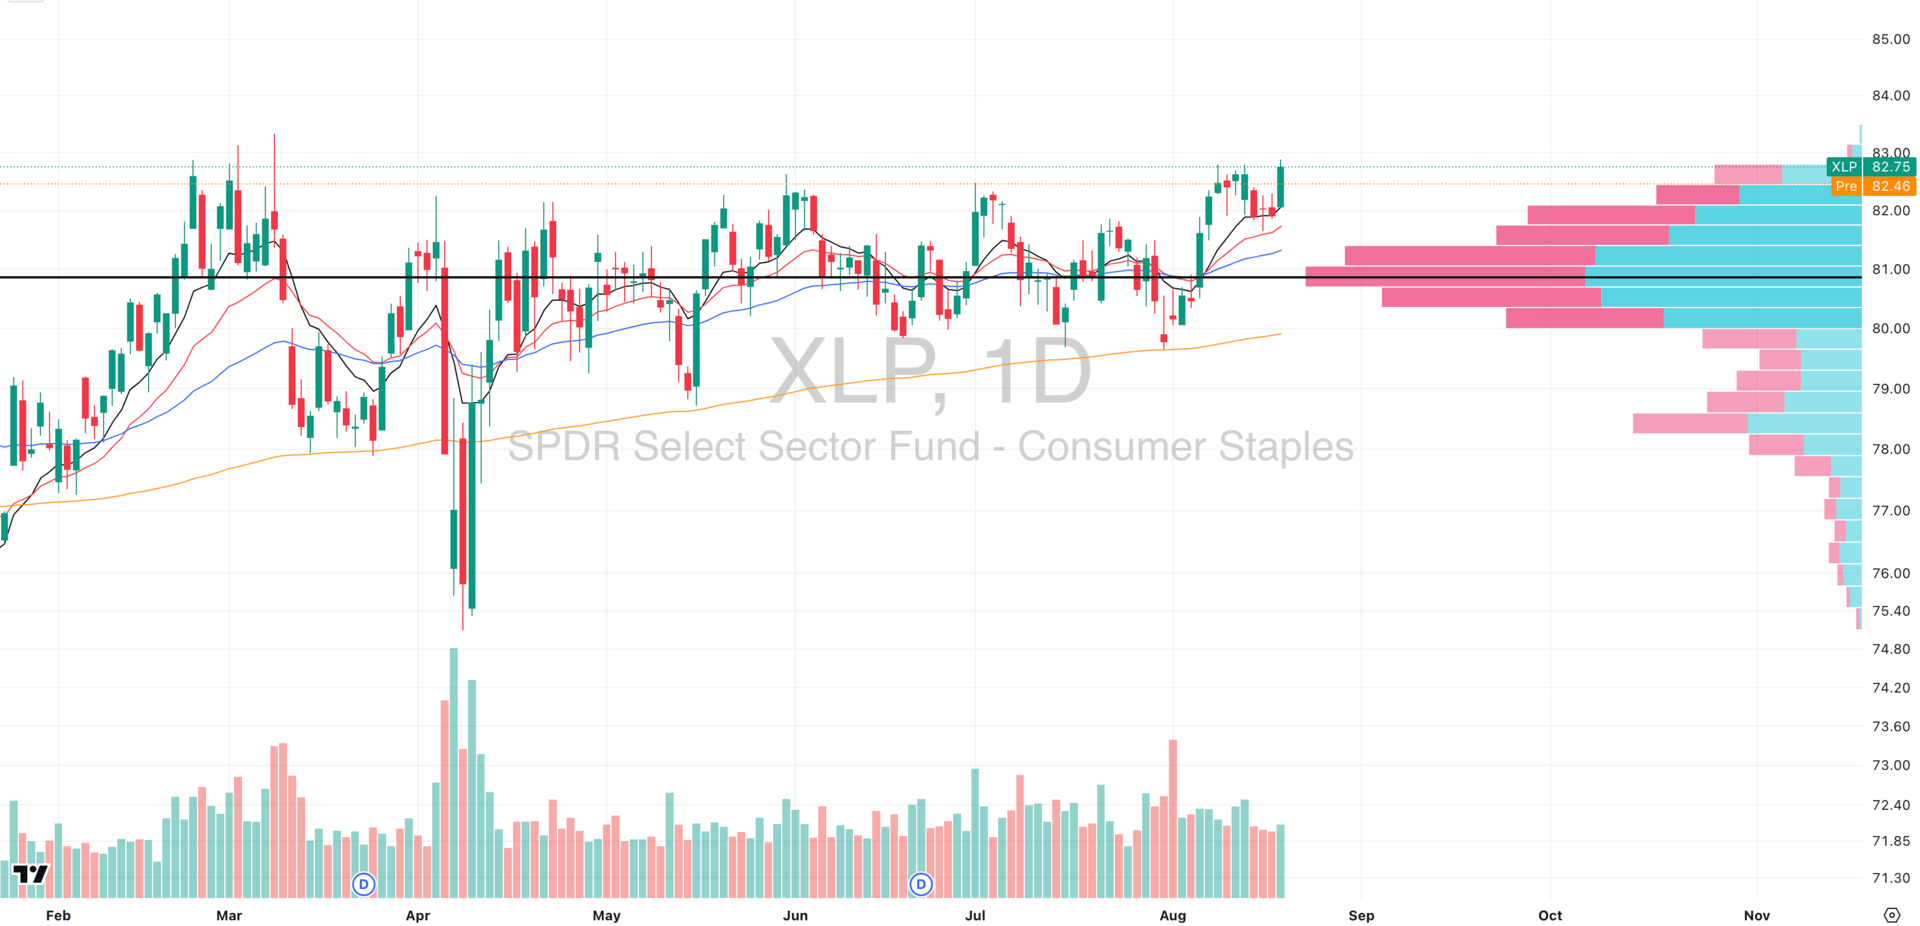
XLP VRVP Daily Chart
With SPY and QQQ under pressure, we saw a clear defensive bid emerge in Consumer Staples.
XLP has been locked in a broad accumulation base since February 2025. As of Friday’s close, it sits just 0.7% away from a breakout and this is a very a structurally important development given how rare it is to see staples pressing new highs while growth cracks.
Key Observations:
Base Structure: 6+ months of sideways action between ~$78–83 has built a massive volume shelf (POC ~$81).
EMA Support: Last week’s pullback into the rising 10/20-EMA held firmly, showing buyers were willing to defend levels even as growth sold off.
Volume Dynamics: The defense happened on low relative volume — meaning there was no aggressive unwinding. Yesterday’s push higher came with a modest uptick in relative volume, showing controlled accumulation rather than panic flows.
Macro Context
With growth sectors in cleanup mode, defensives often catch a bid. If market breadth keeps fragmenting and growth keeps cracking, staples like XLP will act as a capital shelter by attracting flows from higher-beta sectors.

Did you find value in today's publication?This helps us better design our content for our readers |
Reply