- Swingly
- Posts
- The Market Bounce Everyone Buys Too Early
The Market Bounce Everyone Buys Too Early
OVERVIEW
What You Need To Know
Macro
Trump softened tariff tone → global markets rebounding.
Friday’s AI/semiconductor panic reversing, but this is relief, not trend restoration.
Rare earths & reshoring theme still structurally bullish.
Nasdaq (QQQ / QQQE)
QQQ fell ~3.6% Friday, slicing below 595–600 support on heavy volume.
Premarket bounce = resistance test, not reversal.
QQQE weaker → broad-based selling confirmed.
Needs 2–3 days of stabilization + reclaim 50-day MA before strength confirmed.
S&P 400 Midcap (MDY)
Weakest major index; only 17.7% of components above 20 EMA.
Rejected hard at $602.50 → heavy-volume breakdown.
Clinging to final support near $595; loss = acceleration lower.
Russell 2000 (IWM)
Sharp Friday selloff but still above rising 10-week EMA.
Breadth weakening (22.9% > 20 EMA) but not collapsing.
Holding slightly better than midcaps; watch for follow-through buying today.
Focused Stock: PLTR
Pullback to major support at $167–$168 (50 EMA + 10-week EMA).
Buyers defending hourly 200 EMA again.
Above $181 = breakout, below $167 = breakdown.
Focused Group: XLU/RSPU (Utilities)
Strong uptrend, minimal reaction to Friday’s selloff.
Outperformance = defensive rotation into stability.
Signals institutional hedging as growth leadership narrows.

MARKET ANALYSIS
The Market’s “Tariff Whiplash” Moment
After Friday’s violent selloff triggered by tariff threats, global markets are now staging a sharp rebound following President Trump’s Truth Social post softening his tone toward China.
Key Development: Trump wrote that the “China situation will all be fine,” signaling that the previously floated “massive tariff escalation” may not materialize.
Vice President JD Vance reinforced this narrative over the weekend, suggesting that negotiations are ongoing and that the U.S. “has far more cards if needed.”
The implication: the White House appears to be walking back the idea of an immediate escalation, replacing fear of an all-out trade war with the perception of controlled negotiation.
Why It Matters:
AI & Semiconductor Exposure: Friday’s selloff was led by AI and semiconductor names with sectors most exposed to China’s supply chain and rare-earth dependencies. Trump’s latest tone effectively neutralizes short-term panic in those areas. Expect semis and AI-linked equities to rebound sharply today, but without confirmation of policy clarity, this remains headline-driven volatility, not trend restoration.
Macro Context:
Trump’s pivot came after one of the largest single-session market drawdowns of 2024–25. The administration likely recognizes that aggressive tariffs risk financial instability during election season. The shift back toward diplomacy shows how markets themselves are being used as a policy feedback mechanism.Rare Earths & Strategic Metals:
Despite Trump’s softer stance, U.S.-based rare earth stocks surged premarket, underscoring an ongoing structural theme: supply-chain reshoring and strategic autonomy. The administration’s rhetoric is oscillating, but the underlying policy direction e.g. reducing dependence on Chinese inputs, still remains intact.
Nasdaq
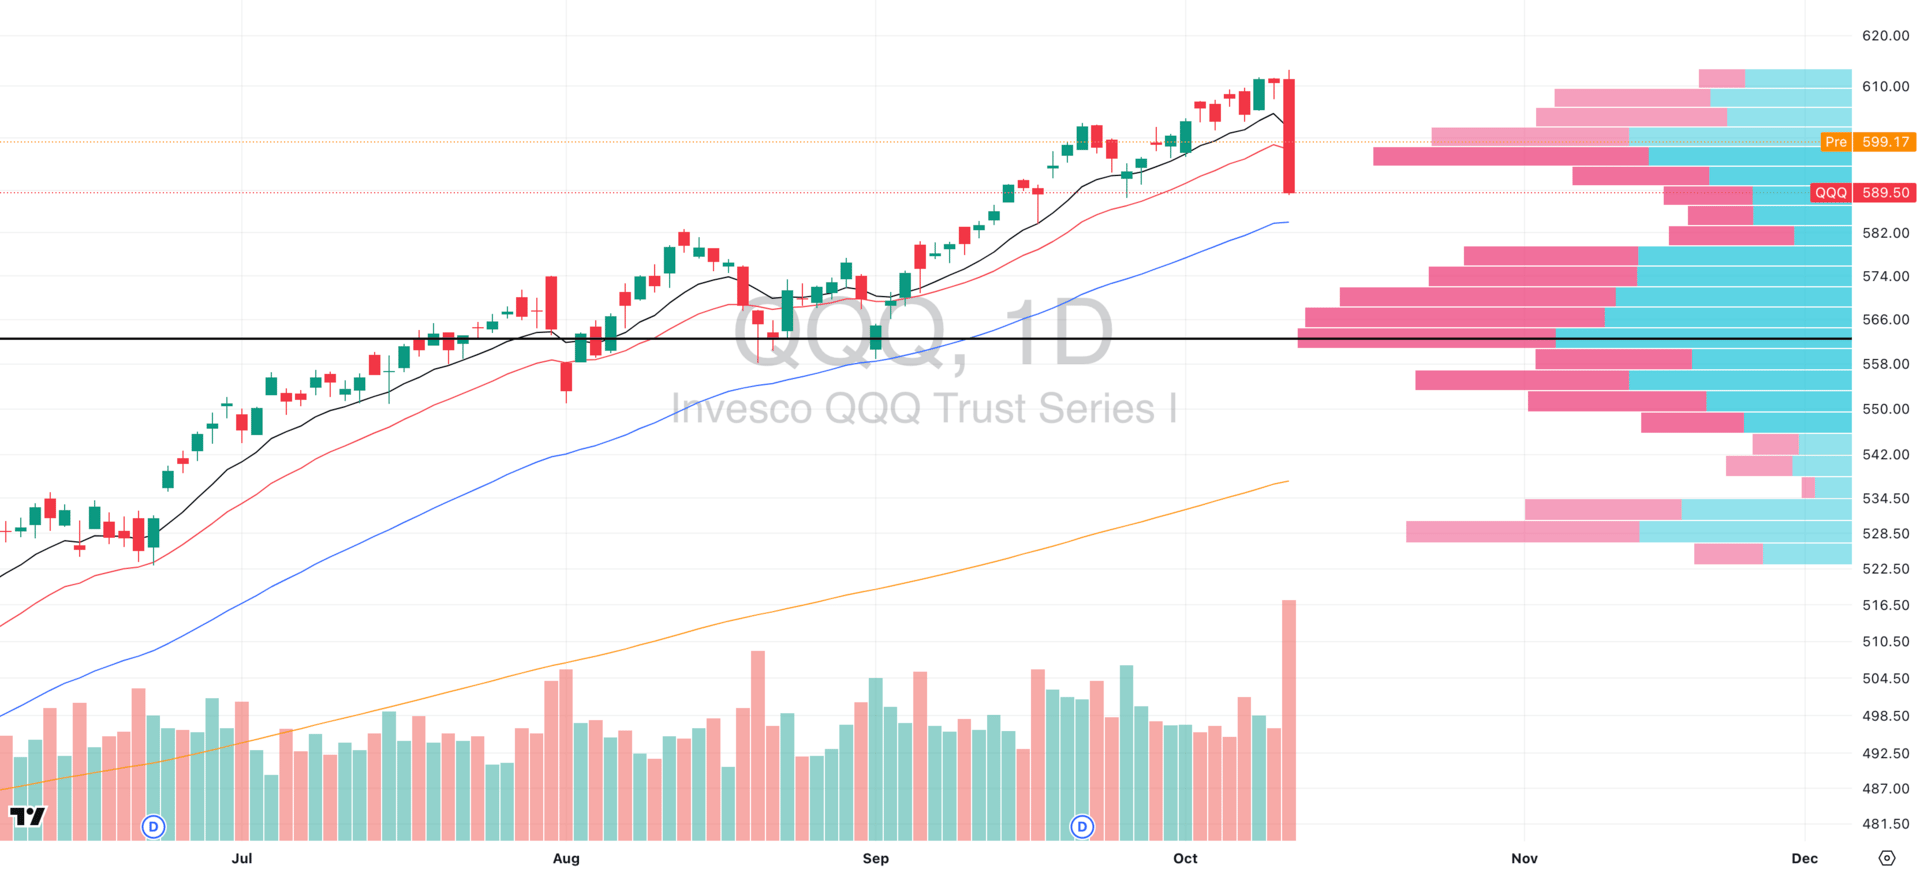
QQQ VRVP Daily Chart
% over 20 EMA: 27.72% | % over 50 EMA: 41.58% | % over 200 EMA: 53.46%
Severe Breakdown: QQQ logged one of its sharpest selloffs of the year Friday, plunging ~3.6% on heavy institutional volume.
Price sliced clean through the 20-day moving average, closing deep below prior support near 595–600.
Volume Signature Matters: The selling accelerated into the close which is a hallmark of fund-level repositioning, not emotional selling. When volume expands while price collapses late in the day, it’s usually continued distribution, not a good signal of exhaustion.
Premarket Bounce ≠ Recovery: QQQ is attempting to bounce toward 599 premarket, but that area now represents overhead resistance. The 20-day MA and broken support zone are the exact levels where trapped buyers often exit, creating “relief rallies” that fade.
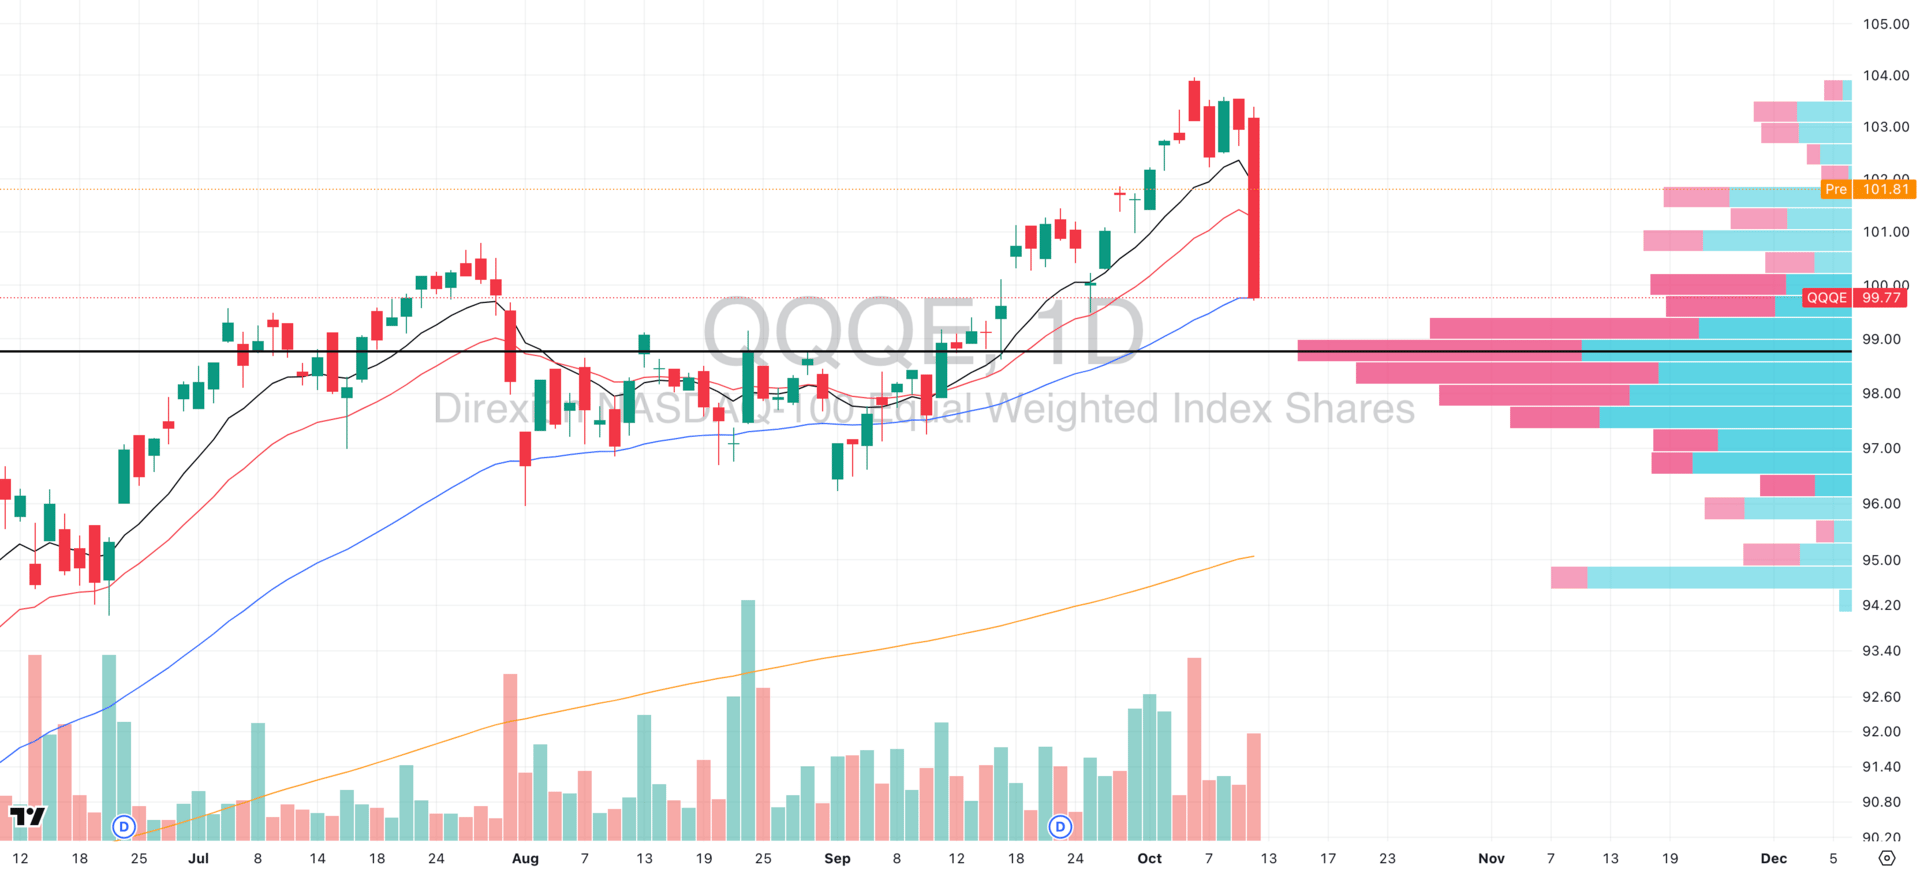
QQQE VRVP Daily Chart
Equal-Weight Nasdaq (QQQE) Even Weaker: QQQE fell harder than the cap-weighted QQQ, confirming that selling was broad-based, not isolated to mega-cap tech. The median Nasdaq stock broke down more violently.
Why Caution Today Is Critical:
No confirmed base yet and one-day gaps don’t rebuild broken structure.
Overhead supply between 595–600 acts as an immediate ceiling.
Breadth deterioration remains severe, and buyers have yet to step in with conviction.
What We’d Need to See Before Getting Long:
2–3 days of sideways stabilization above Friday’s lows.
A decisive reclaim of the 50-day MA on strong volume.
Breadth improvement (more Nasdaq names recovering, not just the Mag 7).
Monday’s gap up looks like relief, not reversal and the kind of bounce that tempts traders before the next leg lower.
Until QQQ can reclaim 600 with authority and internal breadth improves, this is a bounce to respect, not a dip to buy.
S&P 400 Midcap
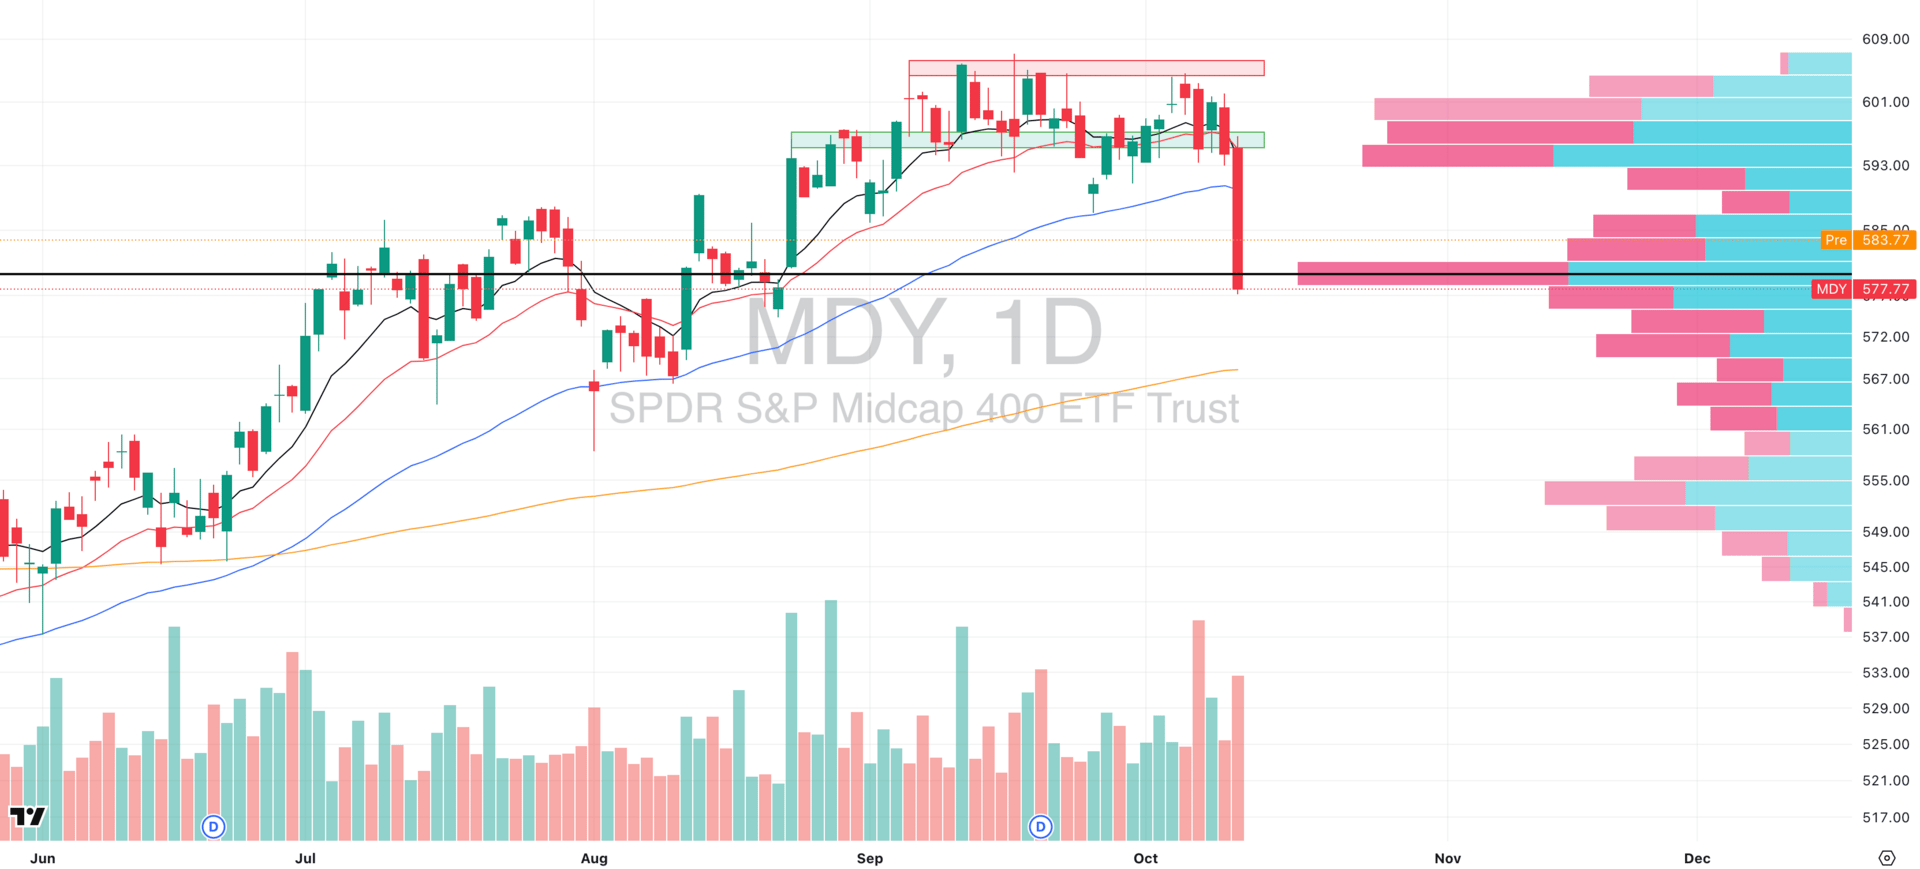
MDY VRVP Daily Chart
% over 20 EMA: 17.70% | % over 50 EMA: 27.18% | % over 200 EMA: 47.38%
Leading the Downside: Midcaps were already the softest group before Friday’s breakdown, and they’ve now become the clear laggard across all major indices.
Breadth has collapsed: only 17.7% of components sit above their 20-day EMA, showing just how narrow and fragile participation has become.
Technical Structure Cracks: The $602.50 supply zone rejected price again last week, triggering an aggressive reversal on extremely high relative volume.
That rejection came with almost no demand response at the 10- and 20-day EMAs as buyers simply didn’t show up.
MDY now clings to its Point of Control (POC) and the final visible demand shelf around $595, which, if lost, would likely accelerate the decline.
Russell 2000
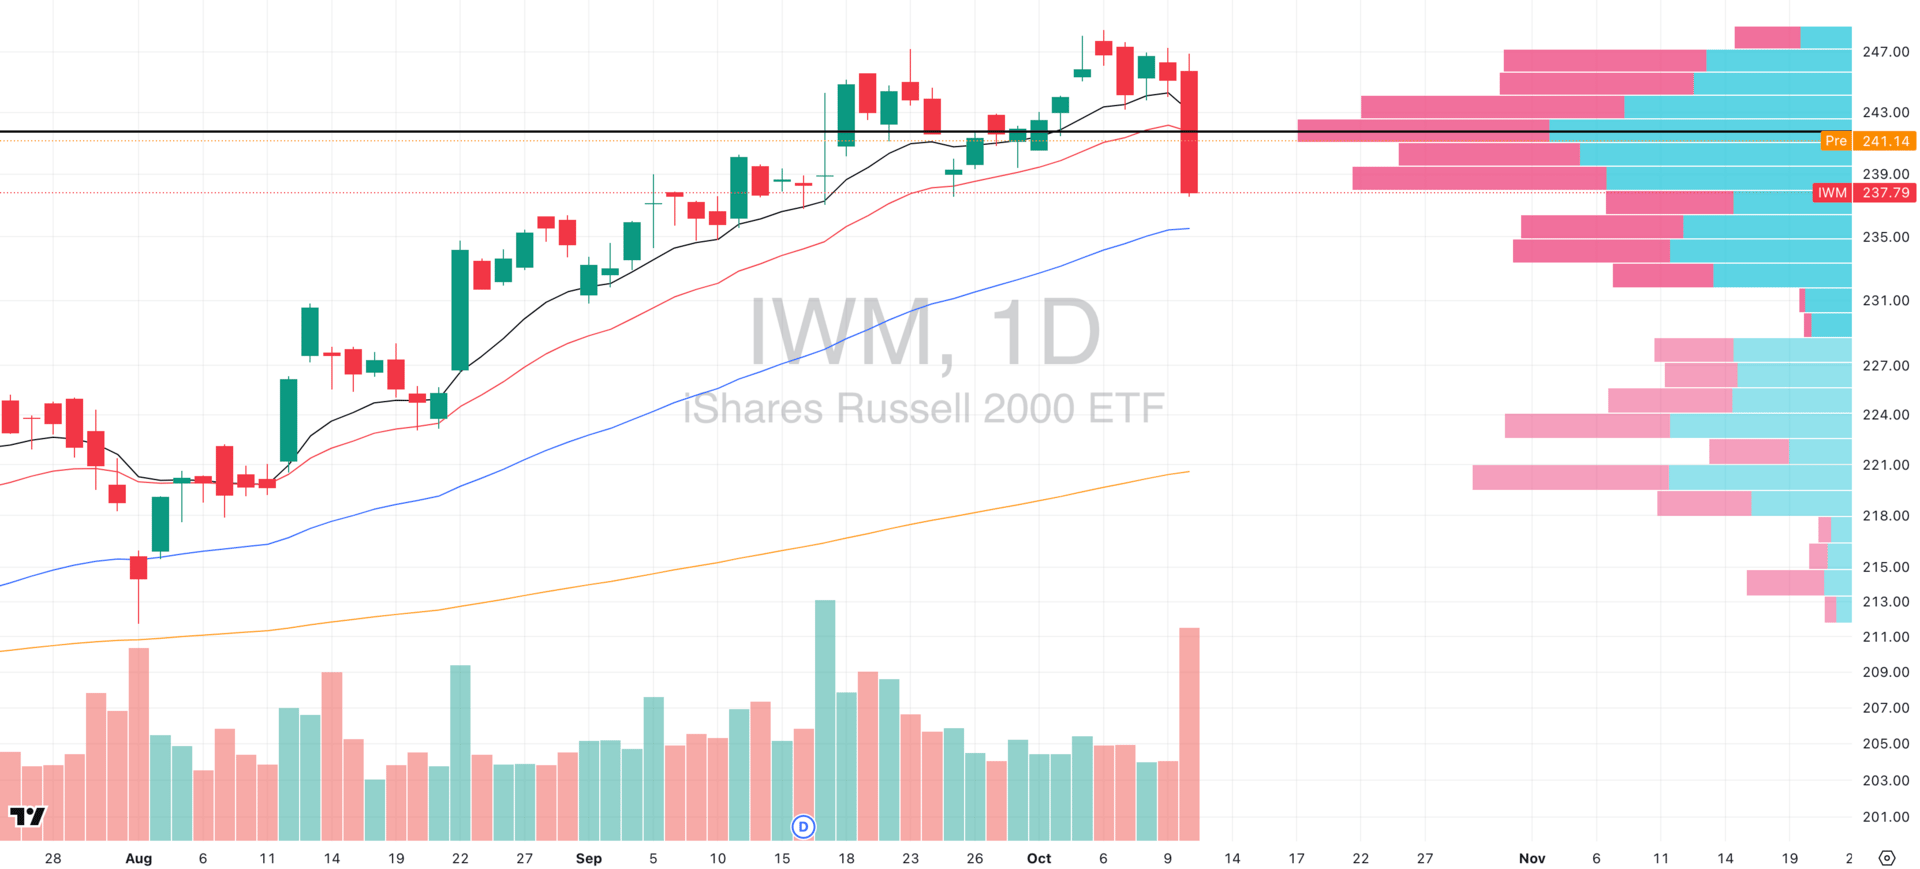
IWM VRVP Daily Chart
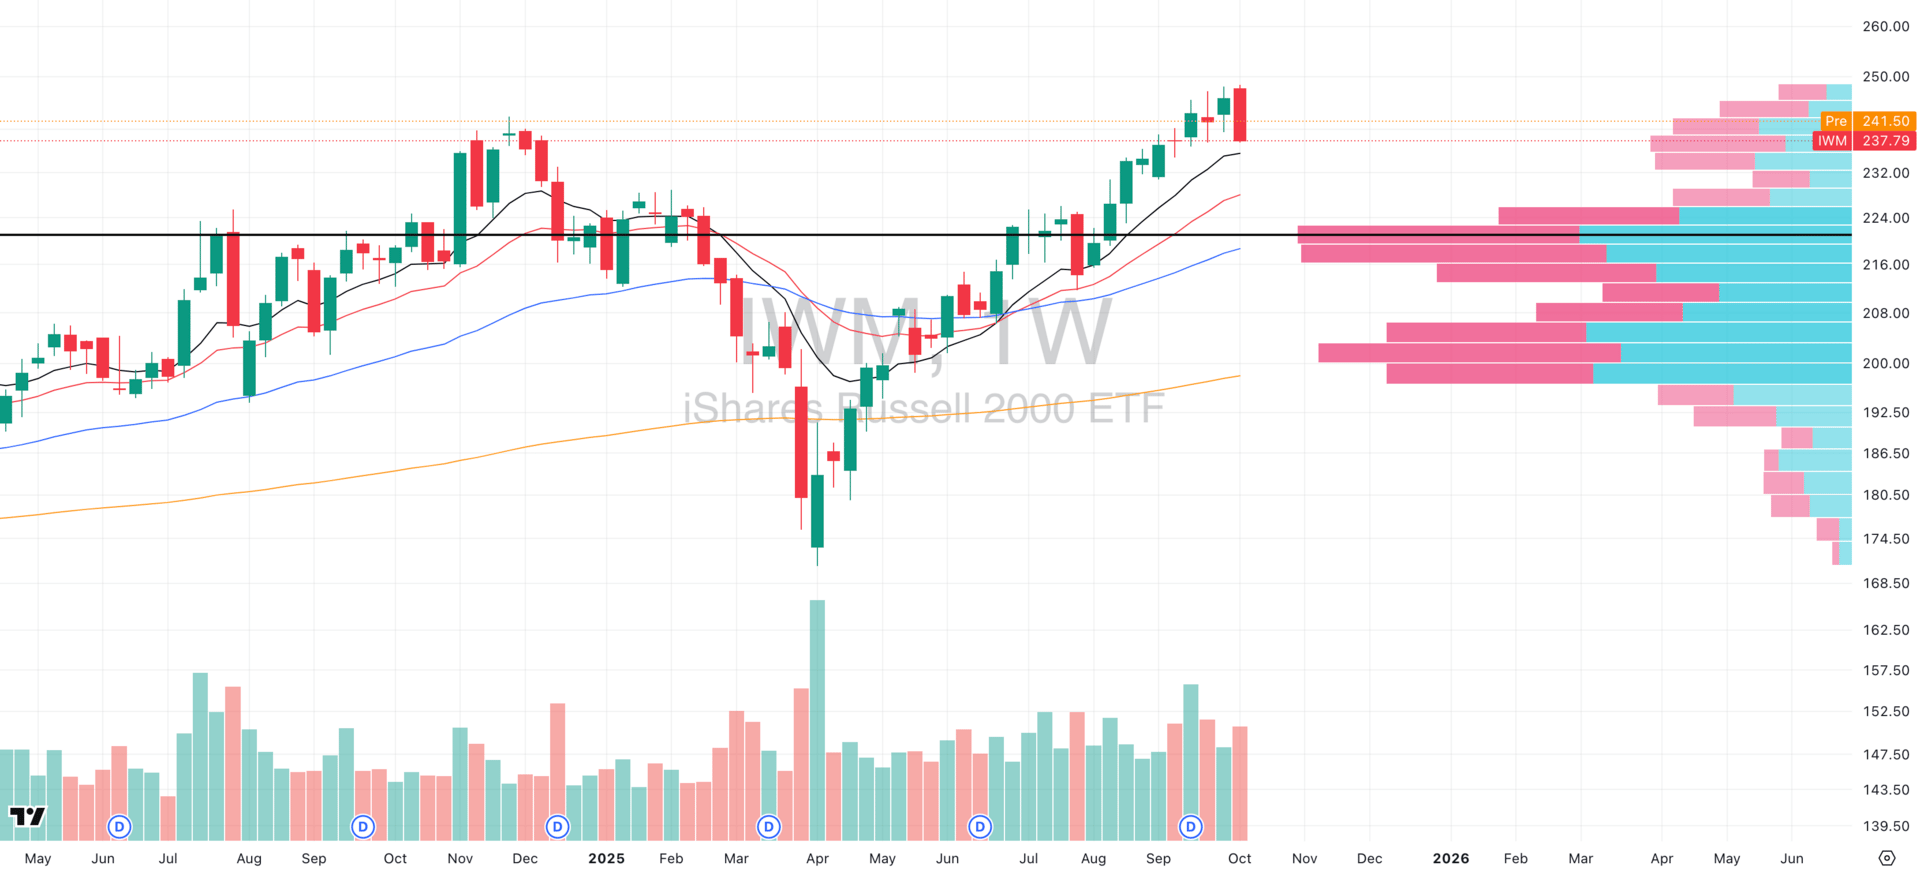
IWM VRVP Weekly Chart
% over 20 EMA: 22.90% | % over 50 EMA: 34.60% | % over 200 EMA: 49.51%
Short-Term Damage, Long-Term Context: Small caps (IWM) sold off hard Friday alongside the broader market, slicing back through short-term support and tagging the 20-day EMA on high volume.
But zooming out, the weekly chart still shows price holding above the rising 10-week EMA — a sign that, structurally, the longer-term trend remains intact for now.
However, it’s too early to call this a simple pullback; today’s session will be key in confirming whether buyers are willing to defend this area or not.
Breadth Weakening, But Not Collapsing: Only 22.9% of small caps remain above their 20-day EMA, confirming broad deterioration but not total capitulation.
Compared to midcaps, small caps are holding slightly better, but both groups are now vulnerable (and lagging with the Nasdaq) if today’s bounce fails to attract follow-through volume.
Breathe First, Act Later
One big down day doesn’t erase a multi-month uptrend.
One premarket gap doesn’t define a new bottom.
Clarity > Emotion. Today isn’t about predicting direction, it’s about observing how the market absorbs damage.
We recommend all traders take today to watch rather than react. Let the market confirm strength before trying to “catch” reversals.
Crash Expert: “This Looks Like 1929” → 70,000 Hedging Here
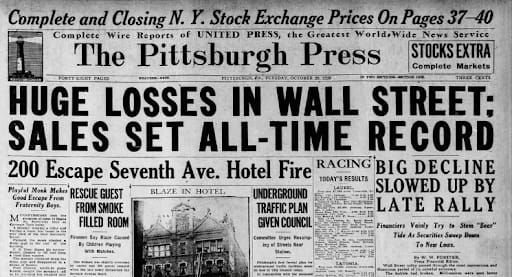
Mark Spitznagel, who made $1B in a single day during the 2015 flash crash, warns markets are mimicking 1929. Yeah, just another oracle spouting gloom and doom, right?
Vanguard and Goldman Sachs forecast just 5% and 3% annual S&P returns respectively for the next decade (2024-2034).
Bonds? Not much better.
Enough warning signals—what’s something investors can actually do to diversify this week?
Almost no one knows this, but postwar and contemporary art appreciated 11.2% annually with near-zero correlation to equities from 1995–2024, according to Masterworks Data.
And sure… billionaires like Bezos and Gates can make headlines at auction, but what about the rest of us?
Masterworks makes it possible to invest in legendary artworks by Banksy, Basquiat, Picasso, and more – without spending millions.
23 exits. Net annualized returns like 17.6%, 17.8%, and 21.5%. $1.2 billion invested.
Shares in new offerings can sell quickly but…
*Past performance is not indicative of future returns. Important Reg A disclosures: masterworks.com/cd.
FOCUSED STOCK
PLTR: Key Support Retest in Progress
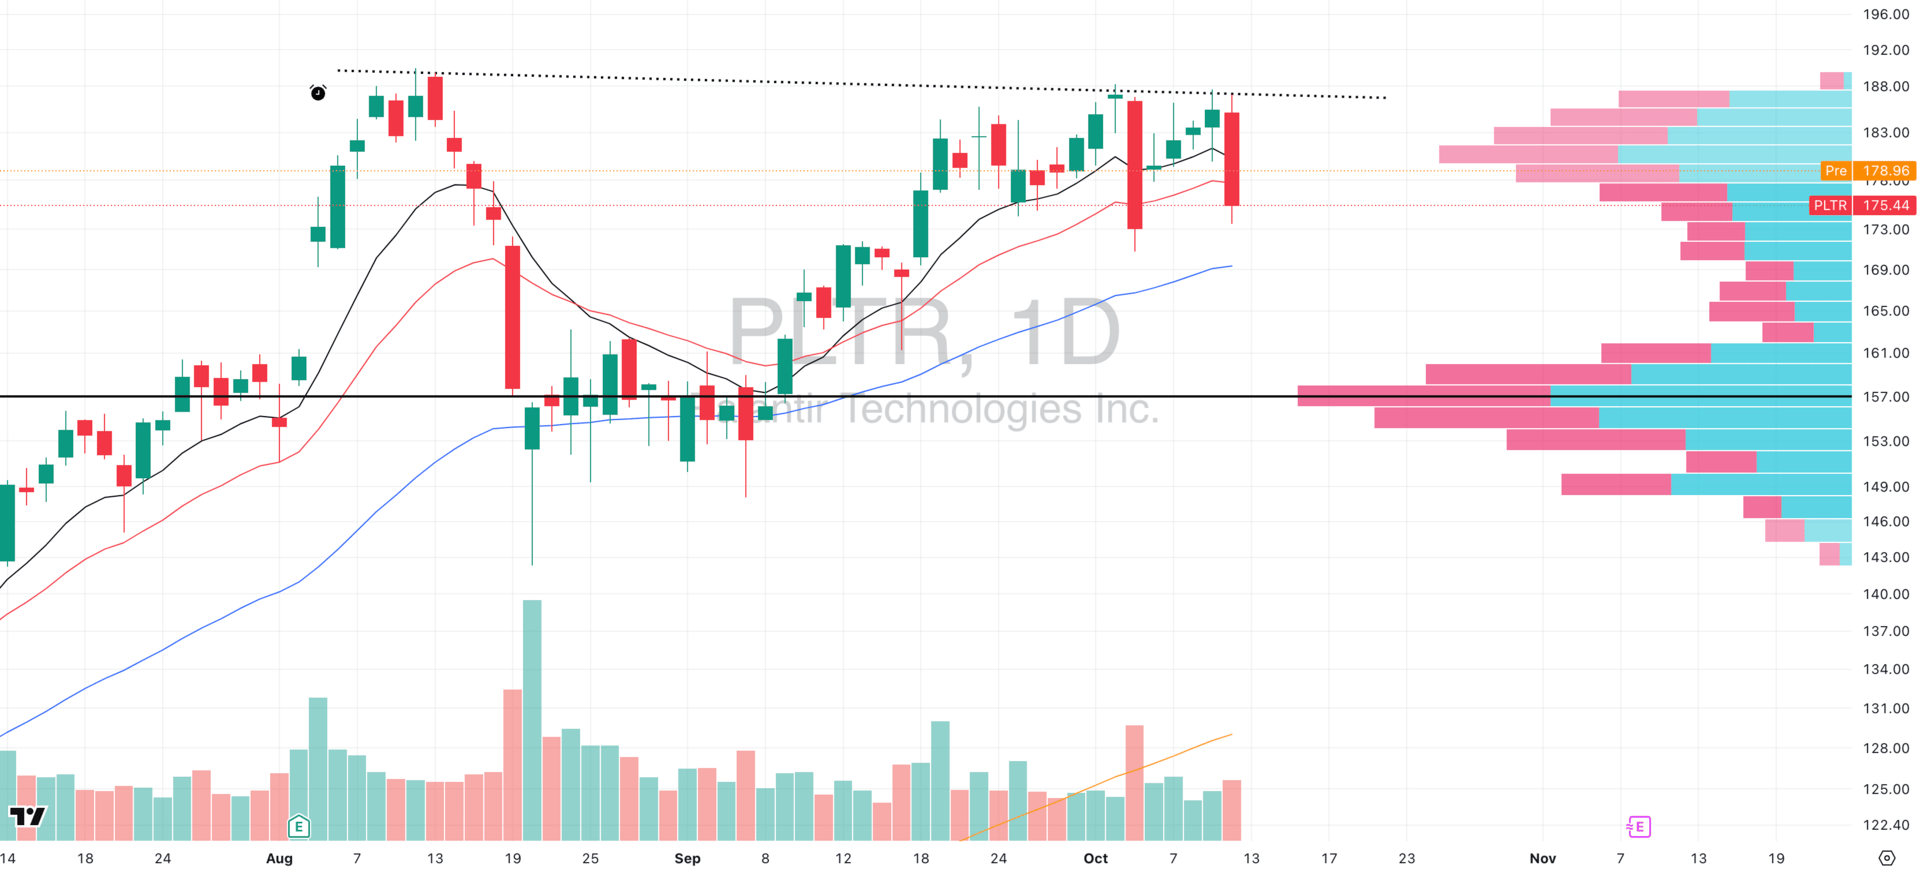
PLTR VRVP Daily Chart
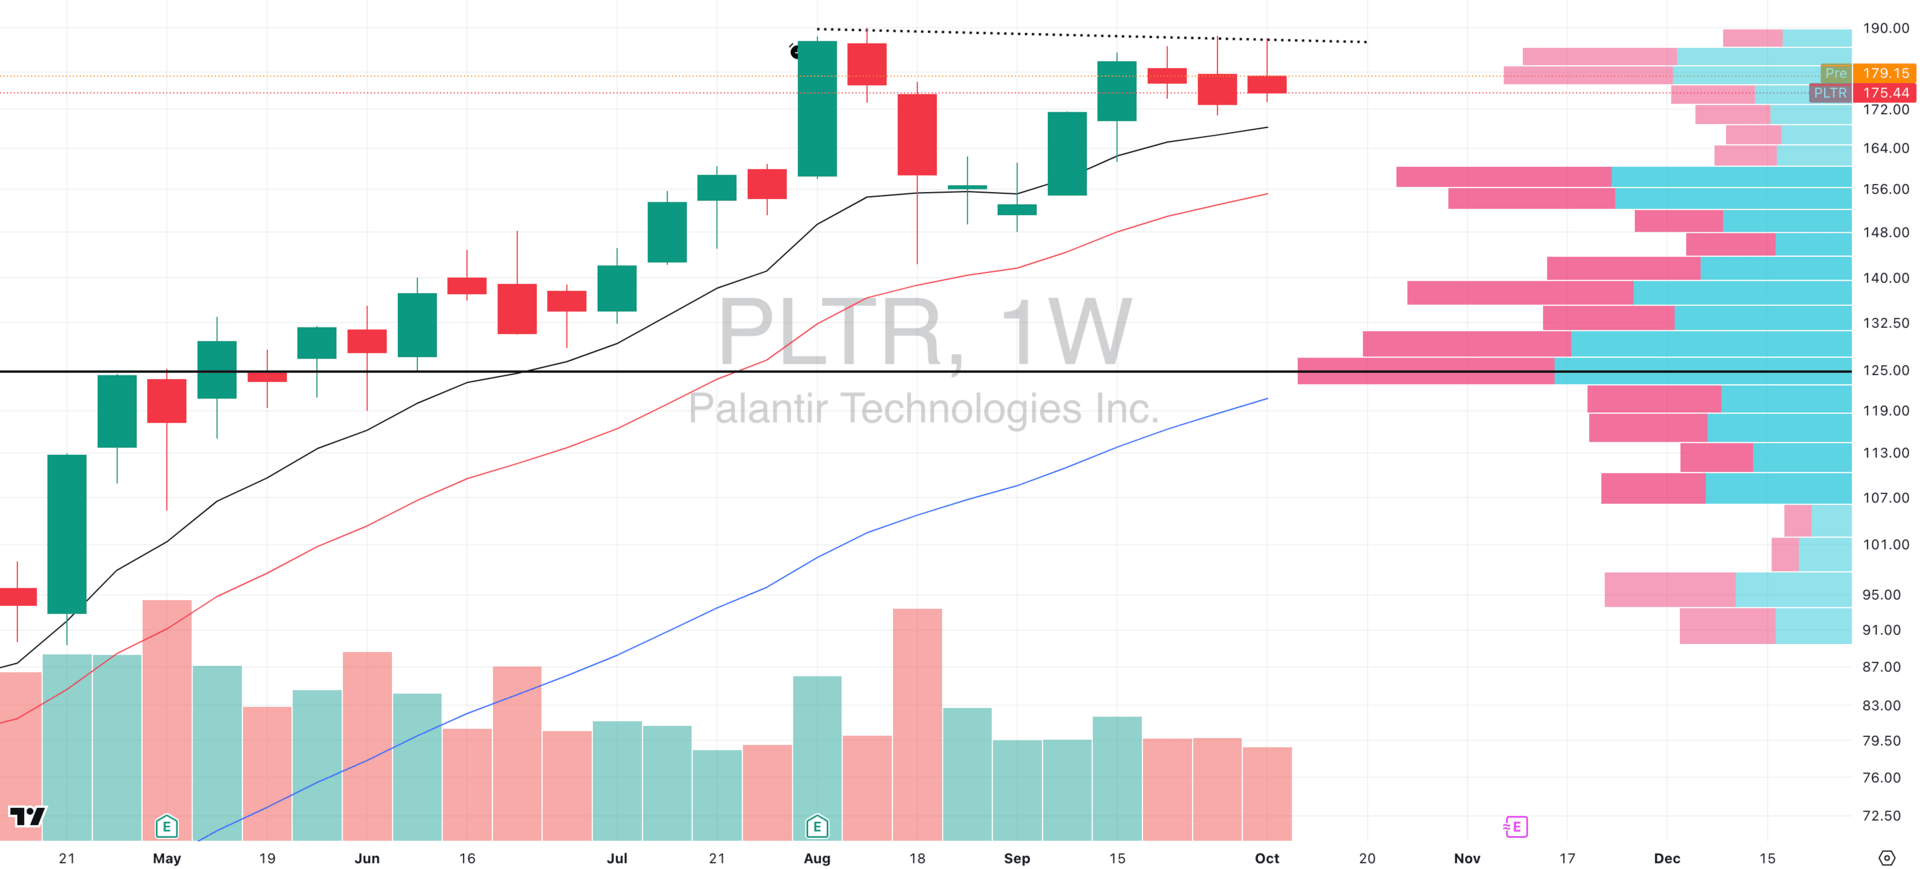
PLTR VRVP Weekly Chart
ADR%: 4.04% | Off 52-week high: -7.7% | Above 52-week low: +334.7%
Controlled Pullback: PLTR sold off on Friday with only 81% of its 20-day relative volume, signaling rotation rather than panic.
The decline brought price directly into a critical confluence zone where the daily 50-EMA and weekly 10-EMA both align near $168, on a level that’s repeatedly acted as support this cycle.
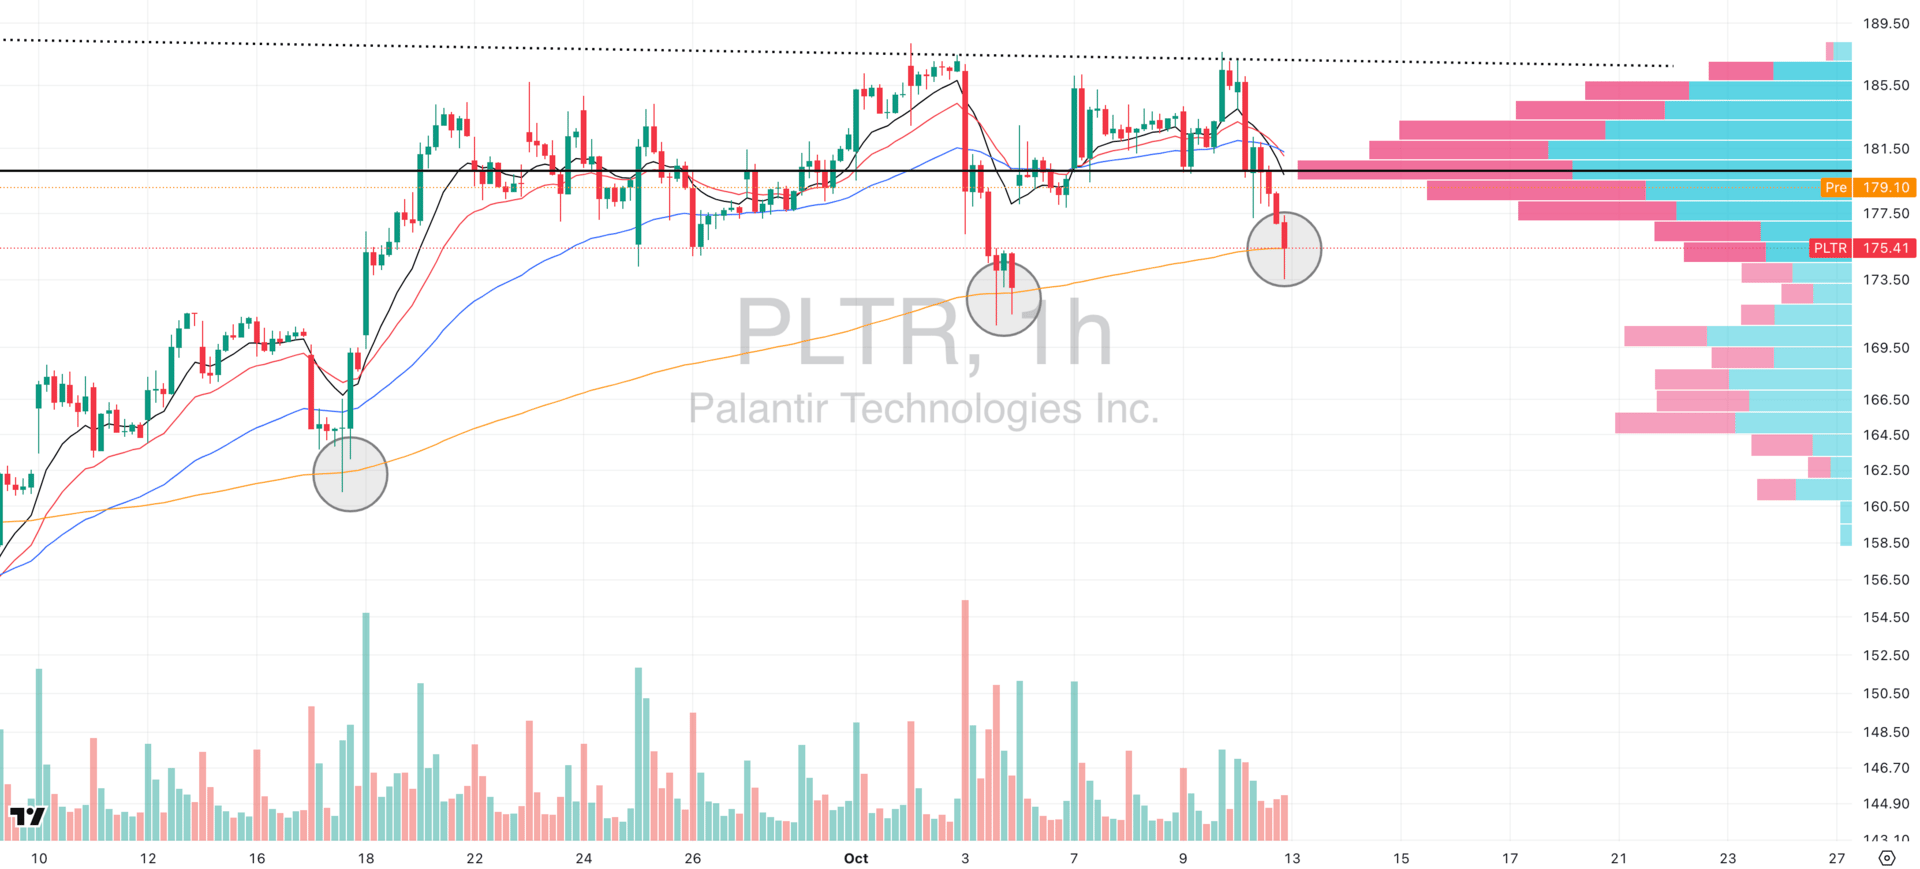
PLTR VRVP Hourly Chart
Hourly Structure Insight: On the hourly chart, PLTR has now tested its rising 200-EMA for the third time, and once again, buyers defended.
Each prior test has led to a sharp rebound into the $179–$180 supply zone, where overhead resistance continues to cap progress.
What This Means: This is a key inflection point. The 200-EMA test shows real demand still active, but the cluster of supply around $180 remains a ceiling until proven otherwise.
A decisive close above $181 would confirm absorption and likely reaccelerate momentum, while a break below $167–$168 would imply demand fatigue and open room back toward the $158–$160 VRVP pocket.
We again highlight you don’t NEED to trade today. Stay safe, the emotions are running hot.
FOCUSED GROUP
XLU: The Relative Strength Leader
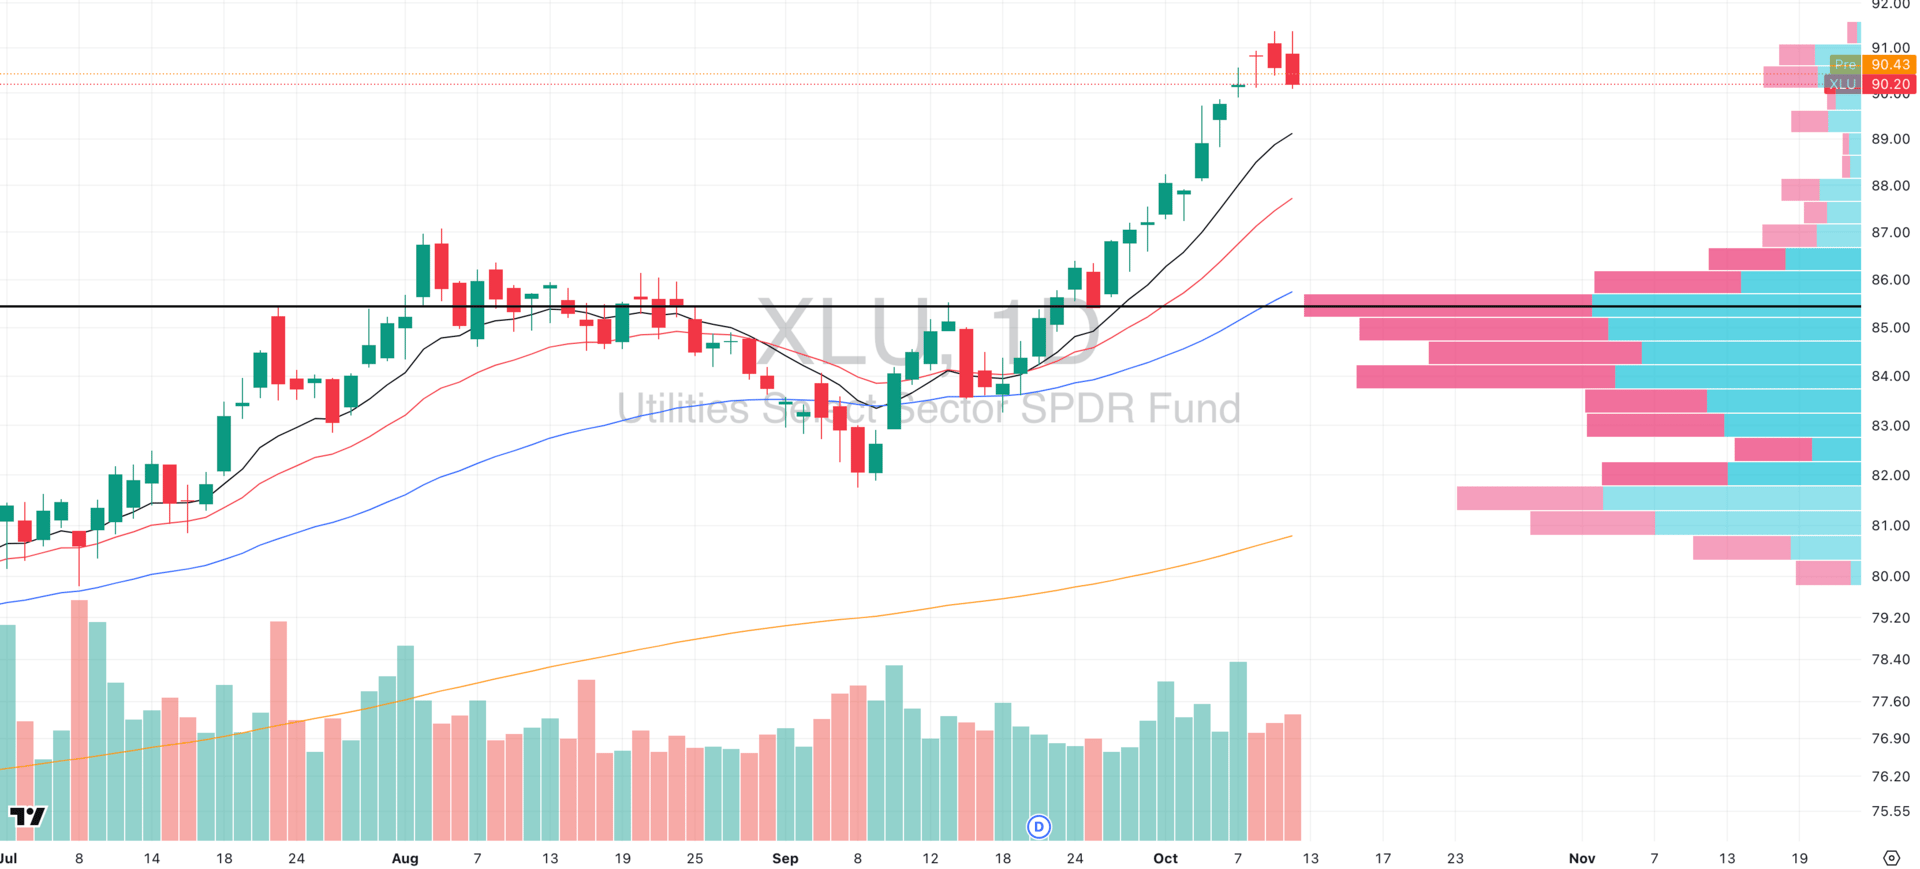
XLU VRVP Daily Chart
What Utilities Represent: The Utilities sector, which includes power generation, water, and gas companies, isn’t about growth or speculation; it’s about stability, predictability, and consistent cash flow.
These companies sell essentials people use every day, regardless of market conditions. Because of that, utilities behave almost like equity bonds with low volatility, steady dividends, and a strong correlation with interest-rate expectations.
Why They Matter in Market Structure: Utilities sit at the crossroads of risk sentiment and rates:
When bond yields fall, Utilities benefit as their dividend yields become relatively more attractive.
When equity volatility rises, Utilities act as a defensive parking lot for institutional money.
When the market’s leadership gets too narrow or speculative (like AI recently), Utilities’ outperformance is a warning sign that smart money is quietly hedging exposure (supported by rising VIX too)
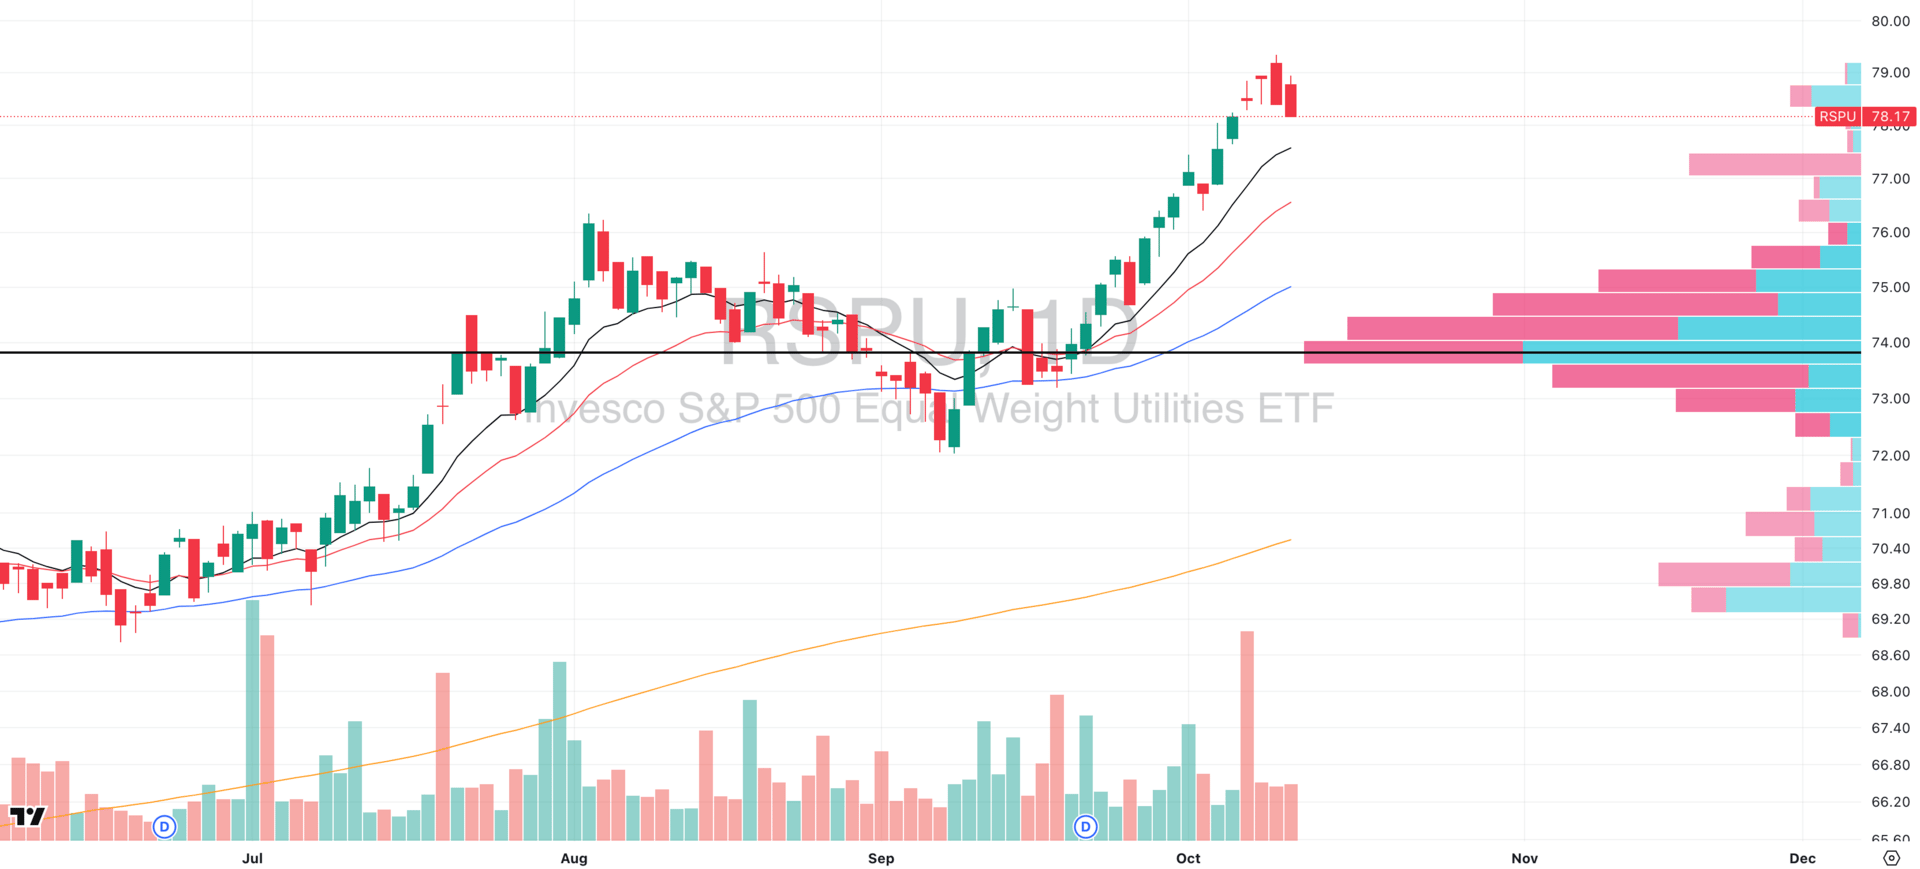
RSPU VRVP Daily Chart
Current Structure: Both XLU (market cap weighted) and RSPU (equal weight) show nearly identical, exceptionally clean trends with a steep advance from September lows, minimal drawdown, and tight control above rising short-term moving averages.
Unlike high-beta sectors that suffered high-volume distribution on Friday, Utilities barely flinched, maintaining their trend integrity. That’s unlikely to be random.

Did you find value in today's publication?This helps us better design our content for our readers |
Reply