- Swingly
- Posts
- The Longest Losing Streak Since 2022
The Longest Losing Streak Since 2022
In partnership with

MARKET ANALYSIS
Here’s What You Need To Know

U.S. equity futures are under pressure again to start the shortened week, with technology leading the weakness. Nasdaq 100 futures are down roughly 0.6%, S&P 500 futures about 0.3%, and Dow futures around 0.1%, reflecting continued rotation out of growth-heavy segments.
The broader context matters here. The Nasdaq just logged its fifth consecutive weekly decline, its longest losing streak since 2022. The S&P 500 and Dow have now fallen in four of the last five weeks. That is no longer random volatility; it reflects a shift in positioning and risk appetite.
The dominant narrative remains AI disruption. What began as a concentrated unwind in high-multiple software has now spread across industries, from logistics to wealth management to transport. Markets are moving from blind optimism about AI spending to a far more selective phase where capital is differentiating between likely winners and structural losers.
Interestingly, last week’s cooler-than-expected CPI failed to spark a sustained bid. Inflation came in below estimates, which in isolation should have been supportive for risk assets. The fact that equities still sold off suggests that growth and earnings concerns are now outweighing rate relief.
Attention now shifts to the Personal Consumption Expenditures index on Friday and the Fed minutes on Wednesday. While markets are still pricing roughly three rate cuts this year (around 64 basis points by year-end), some strategists argue that may be overly optimistic given resilient growth and sticky core inflation. That leaves room for repricing if the data does not cooperate.
The dollar has begun to firm for a second consecutive session despite aggressive cut pricing, a subtle but important development. A stronger dollar in this environment typically tightens financial conditions further and is not particularly friendly to high-beta risk assets.
Earnings remain a secondary driver but can still create sharp crosscurrents. Nvidia’s upcoming report on February 25th carries an exceptionally high bar, particularly around gross margins, component costs, and hyperscaler demand. With combined AI capex from Amazon, Alphabet, Meta, and Microsoft expected north of $600 billion this year versus roughly $350 billion in 2025, investors are starting to ask whether spending plateaus or reaccelerates from here.
Gold holding near the $5,000 mark after its recent pullback is another signal worth noting. It reflects a market that is not fully comfortable with the macro backdrop,
Nasdaq
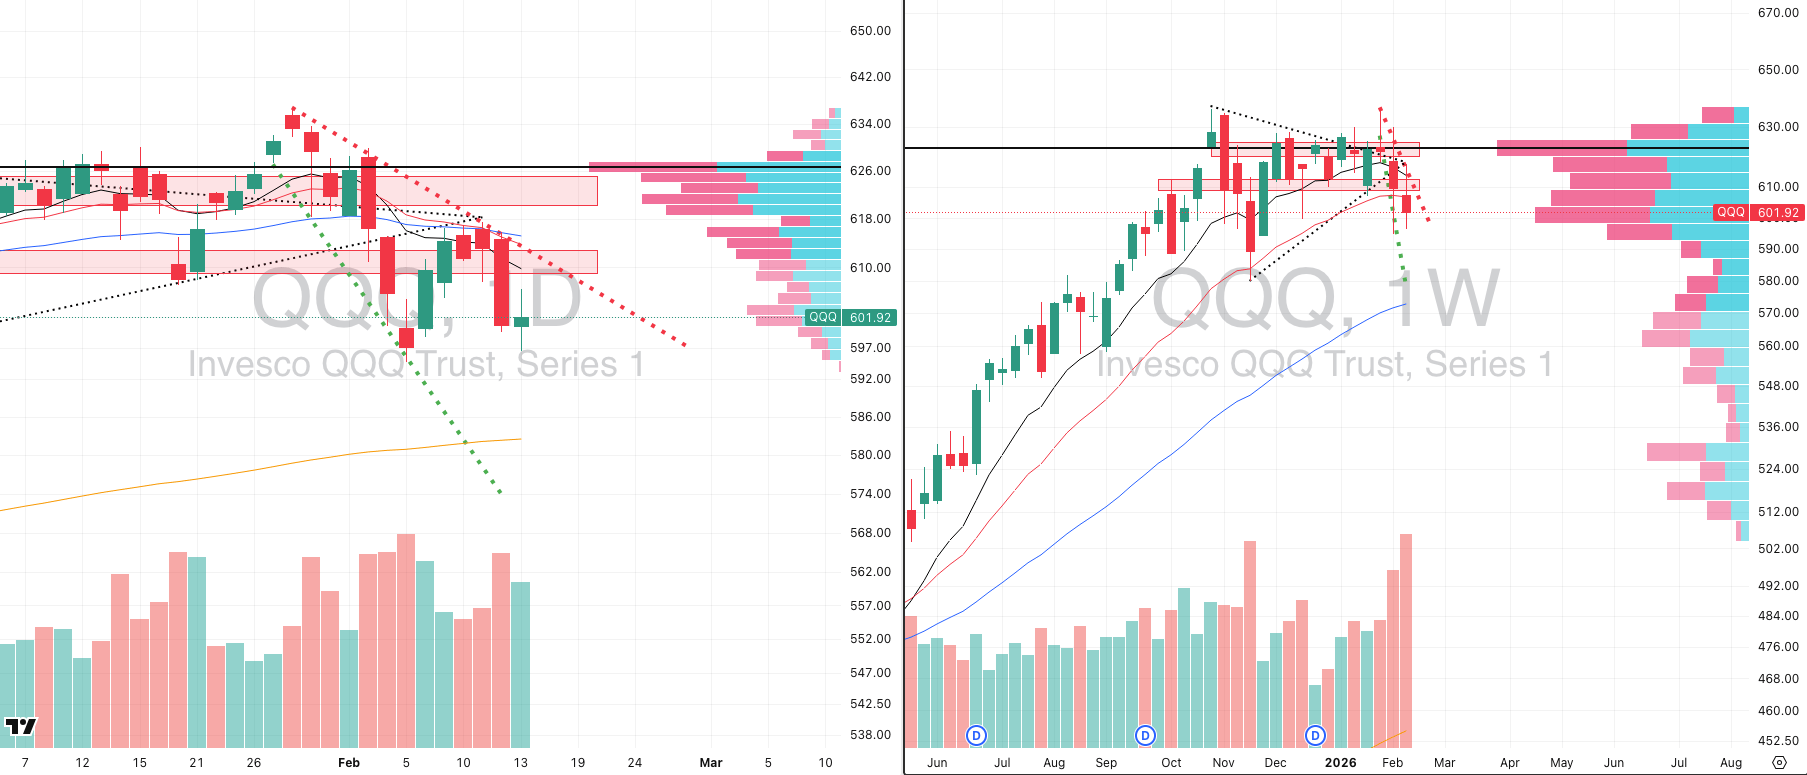
QQQ VRVP Daily & Weekly Chart

QQQE VRVP Daily & Weekly Chart
45.54%: over 20 EMA | 47.52%: over 50 EMA | 51.48%: over 200 EMA
We have been tracking the descending broadening wedge in the QQQ for several sessions now, and that structure remains fully intact. The descending resistance line, established from the January 28th peak, has now been tested five times, which makes it a technically validated level rather than a casual trendline.
The most recent test at 615.34 resulted in a sharp rejection, reinforcing that sellers are still defending that zone aggressively. Until that level is reclaimed on expanding volume, it remains clear overhead supply.
Our base case continues to be a drift toward the 200-day EMA at 582.64. From current levels, that represents roughly a 3% downside move. Given the QQQ’s 1.63% average daily range, that magnitude of move can unfold in less than two sessions.
We are seeing some short-term stabilization around the 596 area, which coincides with the February 5th low. If that level holds and we begin to pivot higher, a potential double bottom could form within the wedge. That would be constructive and could eventually support an upside resolution.
However, the weekly structure is the more important signal. Relative volume last week expanded to nearly 180% of the 20-week average on a highly volatile candle, and price is now trading below the rising 20-week moving average for the first time since the stage 2 rally began in April 2025. That is not a small development.
Until the QQQ reclaims the 20-week EMA and shows genuine demand on the weekly timeframe, it is premature to be positioning aggressively on the long side. The broader structure still leans toward further weakness before any durable recovery.
The QQQE, which strips out mega-cap distortion, is showing a similar descending broadening wedge. The volatility is wider, but structurally it is mirroring the QQQ. It is attempting to form a double bottom near the February 5th low, and notably, it is still holding above its 20-week EMA.
That divergence is worth noting, but not yet actionable. Both ETFs remain inside corrective structures.
With volatility elevated, trade duration must shorten. The higher the volatility index, the shorter your holding period should be. In this environment, exposure should be intraday whenever possible. Overnight risk is being punished on both sides.
S&P 400 Midcap

MDY VRVP Daily & Weekly Chart
61.30%: over 20 EMA | 66.83%: over 50 EMA | 67.58%: over 200 EMA
The mid-caps delivered the mean reversion we had been anticipating after an extended run above the 10-week EMA. Thursday’s candle posted a 3.25% range, more than twice the 1.5% average daily range, accompanied by expanding relative volume. That is expected exhaustion behavior after extension.
Importantly, Friday’s session defended the rising 20-day EMA. That is constructive. The 20-day has consistently acted as a pivot area during this stage 2 advance.
From a structural standpoint, the MDY remains in a powerful stage 2 rally that originated from the November 2024 base breakout and was retested in early January. Nothing on the weekly chart suggests a structural breakdown at this stage.
Our base case here is contraction rather than collapse. After extended breadth readings and sharp volatility expansion, the most likely outcome is a sideways base that allows momentum to reset.
Given the recent increase in daily volatility, mid-caps are not ideal swing candidates unless you are comfortable with wide stop placement. For most traders, this is better approached either through patience or intraday participation.
Breadth within the mid-cap complex had been the strongest of the major capitalization segments, which is why the pullback needed to occur.
Russell 2000

IWM VRVP Daily & Weekly Chart
49.17%: over 20 EMA | 54.71%: over 50 EMA | 63.12%: over 200 EMA
The IWM continues to work through an Adam and Eve-style double top structure. While price has softened, the broader pattern has not yet confirmed a breakdown.
The most important development is the defense of the rising 10-week EMA at 258.07. That level also aligns with the 50-day EMA and has now held multiple tests, including the February 5th flush and last week’s pullback.
That confluence of moving averages and prior demand makes this a meaningful technical level. As long as it holds, the small caps remain in a stage 2 consolidation rather than a stage 4 decline.
The primary concern is rising relative volume during consolidation. On the weekly timeframe, volume has been expanding since mid-January while price has stalled. That dynamic can suggest distribution beneath the surface.
For now, the small caps appear to be chopping within a volatile range rather than trending decisively. Expect erratic behavior and headline sensitivity until either the 10-week EMA breaks decisively or new highs are reclaimed with conviction.
What Will Your Retirement Look Like?

Planning for retirement raises many questions. Have you considered how much it will cost, and how you’ll generate the income you’ll need to pay for it? For many, these questions can feel overwhelming, but answering them is a crucial step forward for a comfortable future.
Start by understanding your goals, estimating your expenses and identifying potential income streams. The Definitive Guide to Retirement Income can help you navigate these essential questions. If you have $1,000,000 or more saved for retirement, download your free guide today to learn how to build a clear and effective retirement income plan. Discover ways to align your portfolio with your long-term goals, so you can reach the future you deserve.
FOCUSED STOCK
APH: A Bull Flag On Strong Weekly Defense
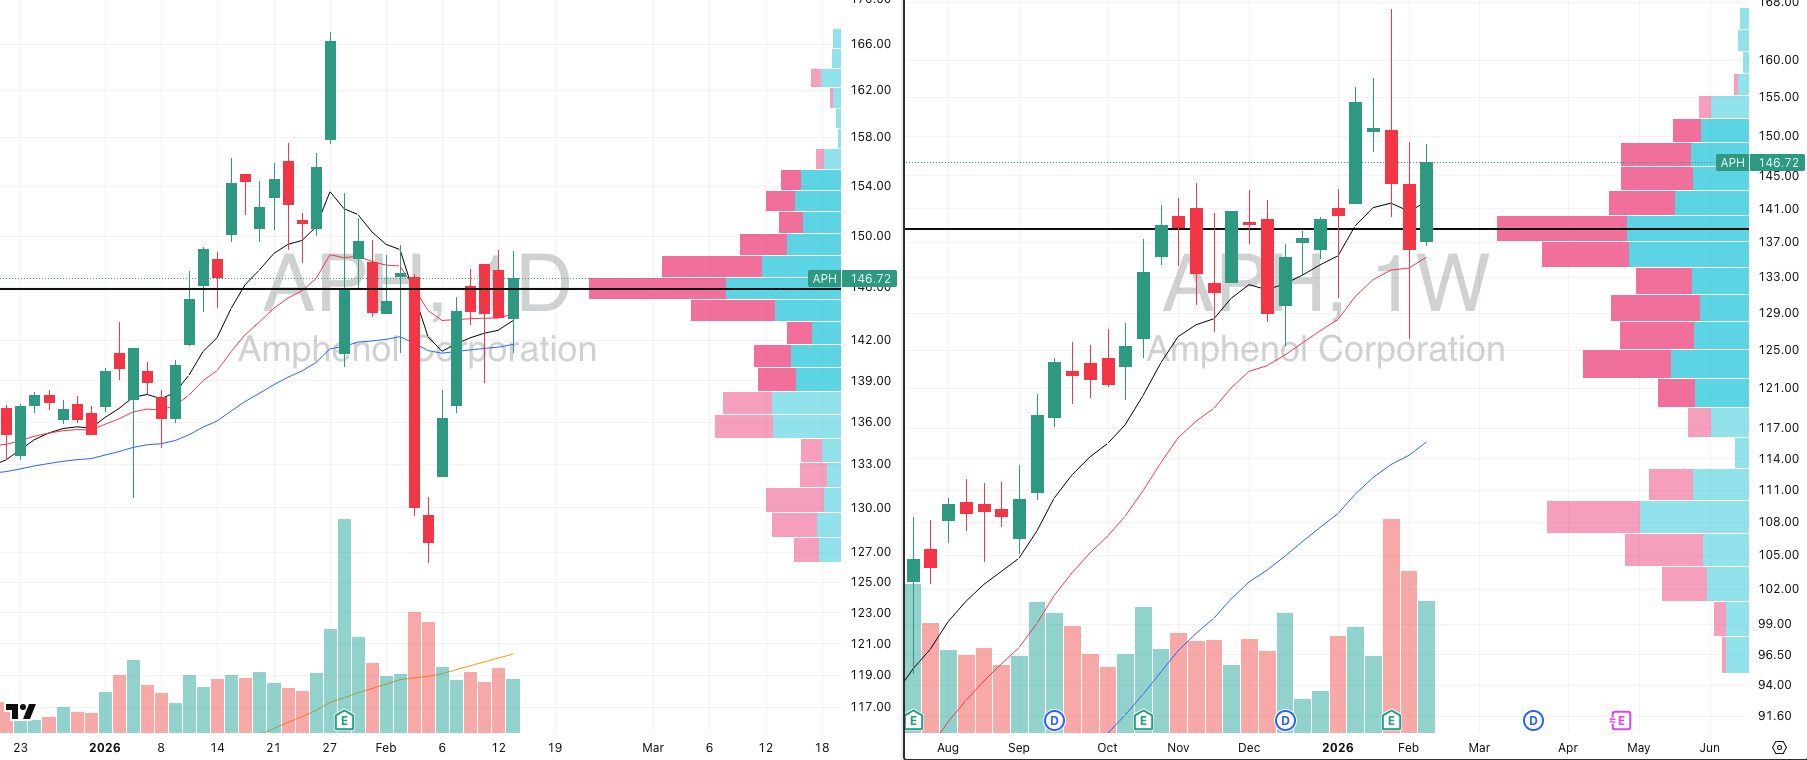
APH VRVP Daily & Weekly Chart
ADR%: 5.07% | Off 52-week high: -12.2% | Above 52-week low: +161.2%
APH continues to stand out as a relative strength leader in an otherwise fragile technology landscape. It carries a relative strength rating of 95 versus the broad market, which immediately puts it in the top tier of momentum names.
The stock defended its weekly point of control at 136.26 last week and bounced cleanly from that level. That is institutional behavior, not random noise.
On the daily chart, APH has formed an inverse head and shoulders structure. The left shoulder developed between January 29th and February 3rd, the head between February 4th and February 9th, and the right shoulder between February 10th and February 13th. Since then, price has tightened into a short bull flag.
Importantly, APH is trading above its key moving averages while many peers are below theirs. In weak markets, leadership often reveals itself early through relative resilience.
Fundamentally, the company continues to post strong revenue growth and earnings expansion, which aligns with the characteristics we look for in sustained market leaders.
We are not advocating aggressive breakout buying in this volatility regime. However, APH is firmly on our watchlist. When growth conditions stabilize, stocks showing this combination of structural strength and fundamental momentum are typically among the first to move.
On the weekly timeframe, the April 2025 earnings breakout launched a 121% advance. That type of expansion is not accidental. It reflects institutional sponsorship. Names with that profile tend to reassert themselves once broader conditions improve.

Did you find value in today's publication?This helps us better design our content for our readers |
Reply